

Abstract
The mechanistic target of rapamycin (mTOR) exists in two complexes that regulate diverse cellular processes. mTOR complex 1 (mTORC1), the canonical target of rapamycin, has been well studied, whereas the physiological role of mTORC2 remains relatively uncharacterized. In mice in which the mTORC2 component Rictor is deleted in liver [Rictor-knockout (RKO) mice], we used genomic and phosphoproteomic analyses to characterize the role of hepatic mTORC2 in vivo. Overnight food withdrawal followed by refeeding was used to activate mTOR signaling. Rapamycin was administered before refeeding to specify mTORC2-mediated events. Hepatic mTORC2 regulated a complex gene expression and post-translational network that affects intermediary metabolism, ribosomal biogenesis, and proteasomal biogenesis. Nearly all changes in genes related to intermediary metabolic regulation were replicated in cultured fetal hepatocytes, indicating a cell-autonomous effect of mTORC2 signaling. Phosphoproteomic profiling identified mTORC2-related signaling to 144 proteins, among which were metabolic enzymes and regulators. A reduction of p38 MAPK signaling in the RKO mice represents a link between our phosphoproteomic and gene expression results. We conclude that hepatic mTORC2 exerts a broad spectrum of biological effects under physiological conditions. Our findings provide a context for the development of targeted therapies to modulate mTORC2 signaling.—Lamming, D. W., Demirkan, G., Boylan, J. M., Mihaylova, M. M., Peng, T., Ferreira, J., Neretti, N., Salomon, A., Sabatini, D. M., Gruppuso, P. A. Hepatic signaling by the mechanistic target of rapamycin complex 2 (mTORC2).
Keywords: gene expression, proteomics, liver, metabolism, signal transduction
Rapamycin, a product of the bacterium Streptomyces hygroscopicus, was originally identified as an antifungal agent (1). However, this macrolide also has significant biological effects on mammalian cells and tissues. It has been shown to be a potent modifier of cell size and proliferation, mRNA translation, and autophagy. Rapamycin and its analogs are now FDA approved as immunosuppressants and anticancer agents. In addition, these compounds have attracted attention for their ability to increase longevity in a spectrum of model organisms (2–4).
Rapamycin exerts its effects by first binding to the immunophilin FKBP12. The rapamycin–FKBP12 complex then binds to and inhibits many functions of the mechanistic target of rapamycin (mTOR), a serine/threonine phosphatidylinositol 3-kinase (PI3K)-related protein kinase. mTOR is found in two complexes, each with distinct substrates and activities (5). mTOR complex (mTORC)-1 regulates ribosomal biogenesis, cap-dependent translation, and autophagy through its effects on substrates that include ribosomal protein S6 kinase (S6K), eukaryotic initiation factor 4E binding protein-1 (4E-BP1), and unc-51 like kinase (ULK)-1 (5). mTOR is also a component of a second complex, mTORC2, which regulates metabolism, glucose homeostasis, and the cytoskeleton, through substrates that include the protein kinases AKT, serum- and glucocorticoid-induced kinase (SGK), and protein kinase C (PKC)-α (5). Owing to the fact that mTORC1 is the canonical target for rapamycin, its biological role and mechanistic properties have been explored extensively. mTORC2 has been much less well studied.
Until recently, rapamycin was considered to be a specific inhibitor of mTORC1 function. However, it was recently shown that prolonged treatment of cancer cell lines with rapamycin not only disrupts mTORC1 signaling, but also inhibits mTORC2 (6). We recently found that chronic administration of rapamycin to mice for as little as 2 wk physically disrupts both mTORC1 and mTORC2 in normal tissues, including liver, adipose tissue, and skeletal muscle. In doing so, rapamycin impairs mTORC2 signaling in vivo (7). We further demonstrated that disruption of hepatic mTORC2 by rapamycin results in glucose intolerance and hyperglycemia, and mice specifically lacking the mTORC2 component RICTOR display this same metabolic dysregulation (7). These data, as well as those in other studies showing that mice lacking hepatic mTORC2 have defects in both gluconeogenesis and lipogenesis (8, 9), indicate that mTORC2 is involved in the regulation of hepatic glucose and lipid metabolism, establishing an important physiological role for hepatic mTORC2 signaling.
Systematic analysis of the in vivo role of mTORC2 in mammals has yet to be performed. To more broadly define mTORC2 biological functions, we characterized the role of hepatic mTORC2 in vivo in the mouse by investigating the effects of a targeted hepatic deletion of Rictor on the liver transcriptome and phosphoproteome.
MATERIALS AND METHODS
Animals
Rictor floxed mice were generated as described elsewhere (10), as were Rictor-knockout (RKO) mice (albumin-Cre RictorloxP/loxP; ref. 7). For experiments in the RKO mice, the control animals were RictorloxP/loxP. All animals were backcrossed to C57BL/6 for ≥6 generations. Animal studies were approved by the Committee for Animal Care at the Massachusetts Institute of Technology (MIT) and under supervision of the Department of Comparative Medicine at MIT.
For the RKO microarray experiment, mice were unfed overnight for 16 h starting at 5 PM, then given ad libitum access to food for 3 h. After euthanasia, the livers were immediately removed, rinsed in PBS, and flash-frozen in liquid nitrogen. RNA was extracted (11) and applied to Affymetrix Genechip Mouse Gene 1.0 ST arrays (Affymetrix, Santa Clara CA, USA). For the rapamycin microarray experiment, mice were unfed for 22 h and then treated with either 10 mg/kg rapamycin suspended in 0.9% NaCl and 2% ethanol at a concentration of 1 mg/ml (547 μM) or vehicle only. After an additional 2 h, 1 group of mice (time 0 h) was euthanized. The remaining mice were given ad libitum access to food and euthanized after an additional 3, 6, or 12 h. Each group comprised 3 mice. RNA was analyzed with Affymetrix MG-U74 v2 microarrays in accordance with the manufacturer's protocol.
For the RKO phosphoproteomics experiment, mice were unfed for 23 h starting at 2 PM and then injected with 10 mg/kg rapamycin suspended in 0.9% NaCl and 2% ethanol at a concentration of 1 mg/ml (547 μM). After 1 h, the mice were given ad libitum access to food for 45 min. After euthanasia, the livers were immediately removed and flash-frozen in liquid nitrogen.
Microarray data analysis
Microarray data discussed in this publication have been deposited in the Gene Expression Omnibus (GEO) at the U.S. National Center for Biotechnology Information (NCBI; Bethesda, MD, USA; http://www.ncbi.nlm.nih.gov/geo). The results of the RKO microarray experiment are accessible through GEO series accession number GSE46515. The results of the rapamycin microarray experiment are accessible through GEO series accession number GSE46582.
Identification of differentially expressed genes [false discovery rate (FDR)<0.05] was performed with the Partek Genomic Suite 6.6β (Partek Inc., St. Louis, MO, USA). For Ingenuity Pathway Analysis (IPA; Ingenuity Systems, Redwood City, CA, USA), genes that differed between control and experimental groups by >1.5-fold were compared to 5 equally sized groups of control genes (fold change <1.1). When a gene was represented more than once in the array results, IPA used the probe with the highest fold change. IPA categories were deemed significant when they resulted in P values that were below the range of those obtained for the 5 control datasets. Microarray results were also examined using the 5 Gene Set Enrichment Analysis (GSEA) Molecular Signature Databases (12, 13), including KEGG, Reactome, and Biocarta. Unlike IPA, this analysis examines the full spectrum of genes detected in the array, determining whether an a priori defined set of genes shows statistically significant, concordant differences in expression between 2 biological states.
Sample preparation for phosphoproteomic analysis of liver tissue
Mouse liver homogenates were prepared in 20 ml/g wet weight of buffer A (50 mM Tris base, pH 8.1; 75 mM NaCl; 6 M urea; 10 mM sodium pyrophosphate; 1 mM sodium orthovanadate; 1 mM NaF; and 1 mM β-glycerophosphate) using a glass/Teflon homogenizer (7 strokes at 700 rpm). Homogenates were sonicated with 3 bursts of 30 s each at 8°C. They were then centrifuged at 13,000 rpm for 15 min at 8°C. The resulting pellets were discarded; supernatants were retained and stored at −70°C until used.
Samples containing 10 mg protein (measured by Bradford assay; Bio-Rad Laboratories, Hercules, CA, USA) were reduced by dithiothreitol, added to a final concentration of 4.5 mM, followed by incubation for 20 min at 60°C. The samples were then alkylated by the addition of iodoacetamide (final concentration, 10 mM), followed by incubation for 15 min at room temperature in the dark. The resulting preparations were diluted 3-fold with 20 mM HEPES (pH 8.0) and incubated overnight at 37°C with sequencing-grade modified trypsin at a 1:100 protease:protein ratio. The resulting peptides were adjusted to pH 2.7 with trifluoroacetic acid, and cleared by centrifugation at 1800 g for 5 min. The peptides were desalted with Oasis HLB extraction cartridges and dried in a SpeedVac concentrator (Thermo Fisher Scientific, Waltham, MA, USA).
Dry peptides were reconstituted in buffer B (25 mM ammonium formate, pH 7.5) and loaded onto a Zorbax 300 Extended-C18 (2.1-×150-mm) column (Agilent Technologies, Santa Clara, CA, USA) equilibrated with buffer B. The column was eluted with a linear gradient of 0–50% buffer C (25 mM ammonium formate, pH 7.5, and 90% acetonitrile) over 50 min, followed by a linear gradient of 50–70% buffer C over 10 min. Flow rate was 200 μl/min, and 40 fractions (200 μl each) were collected. The 40 fractions were combined into 4 fraction pools that were dried in a SpeedVac concentrator and stored at −70°C. Following reconstitution, the phosphopeptides were enriched with Titansphere Phos-TiO reagents (GL Sciences, Inc., Tokyo, Japan; ref. 14).
Proteomic analyses were performed on a fully automated phosphoproteomic technology platform (15). Samples were eluted from a C18 analytical column with a reverse-phase gradient of 0–70% 0.1 M acetic acid in acetonitrile that was developed over 30 min at a flow rate of 200 nl/min. Eluates were applied directly to the mass spectrometer (Linear Trap Quadrupole-Orbitrap; Thermo Fisher Scientific). The electrospray voltage of 2.0 kV was applied in a split flow configuration, and spectra were collected in positive-ion mode (16). One full mass spectrometry (MS) scan in the Fourier transform (from m/z 400 to 1800) was followed by 10 data-dependent MS/MS spectra in the Orbitrap from the 10 most abundant ions. Selected ions were dynamically excluded for 30 s and screened for charge states of +1, +2, and +3.
MS/MS spectra were automatically searched against the UniProt mouse complete proteome set database (UniProt release 2010_05; 64,389 sequences) by using the Mascot algorithm provided by Matrix Science (Boston, MA, USA; ref. 17). Peak lists were generated using extract_msn.exe 4.0 and a mass range of 600–4500, precursor ion tolerance (for grouping) of 0.005 atomic mass unit, minimum ion count of 5, group scan of 0, and minimum group count of 1. The UniProt mouse database contained 128,778 protein sequence entries (50% forward, 50% reverse). The Mascot search was performed with the following parameters: trypsin enzyme specificity, 2 possible missed cleavages, 7 ppm mass tolerance for precursor ions, and 0.5 Da mass tolerance for fragment ions. Search parameters specified a differential modification of phosphorylation (+79.9663 Da) on serine, threonine, and tyrosine residues and a static modification of carbamidomethylation (+57.0215 Da) on cysteine. To provide high-confidence phosphopeptide sequence assignments, we filtered the data for Mowse score (>20) and precursor mass error (<2 ppm). The FDR was estimated to be 1%, according to the decoy database approach after final assembly of nonredundant data into a comparison file (18). To validate the position of phosphorylation sites, we applied the Ascore algorithm (19) to all data. Ascore probabilities are provided in the full phosphoproteomic data table (Supplemental Table S1A). Quantitative data analysis was accomplished with PeptideDepot software (14, 15). A label-free comparison data file was generated for the evaluation of phosphopeptide abundance in RKO and control mice. Based on an approach in which samples from RKO and control mice were processed and analyzed in parallel, all comparisons were paired. All other data settings and filters were the same as published elsewhere (14). Kinase prediction was done with the Kinexus PhosphoNET kinase predictor software (Kinexus Bioinformatics Corp., Vancouver, BC, Canada; http://www.phosphonet.ca).
Quantitative real-time reverse transcription polymerase chain reaction (RT-PCR)
Total liver RNA was extracted with an RNeasy Mini Kit (Qiagen, Gaithersburg, MD, USA), according to the manufacturer's instructions. The concentration and purity of RNA were determined by absorbance at 260/280 nm, and 1 μg of RNA was used to generate cDNA (Superscript III with Oligo dT primers; Invitrogen, Carlsbad, CA, USA). Primers for real-time PCR were obtained from Integrated DNA Technologies (Coralville, IA, USA). Reactions were run on an Applied Biosystems Prism machine with Sybr Green Master Mix (Applied Biosystems, Foster City, CA, USA). 36B4, a housekeeping gene, was used to normalize results from gene-specific reactions (20). Primer sequences used to produce gene-specific amplicons are given in Supplemental Table S2A.
Primary hepatocyte cultures
Primary hepatocytes were isolated from 7- to 10-wk-old wild-type (WT) and RKO male mice and maintained in serum-free medium 199 (Invitrogen-Gibco, Grand Island, NY, USA) (21). The medium was changed daily, and on the third day after isolation, primary hepatocytes were harvested 3 h after medium change.
Immunoblot analysis
Cells lysates were prepared in cold RIPA buffer supplemented with phosphatase and protease inhibitor cocktail tablets. Lysates were incubated at 4°C with gentle rocking for 15 min and then centrifuged for 10 min. Tissues were homogenized in RIPA buffer with FastPrep 24 (MP Biomedicals, Solon, OH, USA). After incubation on ice for 5 min, the homogenates were centrifuged, and protein concentrations were determined by Bradford assay. Protein (20 μg) was separated by sodium dodecyl sulfate-polyacrylamide gel electrophoresis (SDS-PAGE) on 8, 10, or 16% resolving gels (Invitrogen).
Antibodies to phospho-AKT S473 (9271, 4058), AKT (9272), phospho-ribosomal protein S6 S240/S244 (2215), RICTOR (2140), phospho-p38 mitogen-activated protein kinase (MAPK) T180/Y182 (9211), p38 MAPK (9212), phospho-FOXO1/FOXO3A T24/T32 (9464), phospho-eukaryotic elongation factor-2 kinase (eEF2K) S366 (3691), phospho-ERK T202/Y204 (9101), ERK (4695), insulin receptor substrate 2 (IRS2; 3089), phospho-MKK4 S257 (4514), phospho-MKK3/6 S189/S207 (9236), phospho-signal transducer and activator of transcription 1 (STAT1) S727 (9177), STAT1 (9172), and phospho-CREB/ATF1 S133/S63 (9198) were from Cell Signaling Technology (Danvers, MA, USA). Leptin receptor antibody (NB120-5593) was from Novus Biologicals (Littleton, CO, USA). Phospho-X-box binding protein 1 (XBP1) S61 antibody was from Umut Ozcan (Boston Children's Hospital, Boston, MA, USA; ref. 22). Anti-XBP1 (37152) was from Abcam (Cambridge, MA, USA). Anti-MKK4 (1650-1) was from Epitomics (Burlingame, CA, USA). Antibodies directed toward actin (sc-7210) and β-tubulin (sc-9104) were from Santa Cruz Biotechnology (Santa Cruz, CA, USA).
RESULTS
mTORC2 is involved in the regulation of a broad spectrum of hepatic genes
To examine the role of mTORC2 in the regulation of hepatic gene expression, control and RKO mice (n=4/group) were unfed overnight and refed for 3 h as described above. Among the 22,914 annotated genes on the Affymetrix Genechip Mouse Gene 1.0 ST arrays, 4 were identified as differentially expressed between the control and RKO animals, on the basis of a stringent FDR (<0.05). Expression of the leptin receptor (Lepr) was 14.9-fold higher in the RKO mice than in the control mice. Insulin-like growth factor binding protein 1 (Igfbp1) and Irs2 were also upregulated in the RKO mice (5.2- and 1.9-fold, respectively). Glucokinase (Gck) was overexpressed 5.2-fold in the control mice, relative to the RKO mice. No other individual genes were significantly different in the two groups.
We confirmed that these 4 genes were significantly altered by using quantitative PCR (qPCR) on an expanded set of liver samples from WT and RKO mice unfed overnight and then refed for 3 h (Fig. 1A). Western immunoblot analyses of these same livers showed the expected deletion of RICTOR and the expected marked reduction of the mTORC2 target, AKT Ser473. We were able to confirm increased levels of IRS2 protein, consistent with the up-regulation of Irs2 in the RKO livers. Results of Western blot analyses for the leptin receptor (not shown) were inconclusive. Lepr, Igfbp1, and Irs2 have been characterized as targets of the FOXO family of transcription factors, which are retained in the cytoplasm and are inactive when phosphorylated. Consistent with the increased expression of these 3 genes (5), RKO mice show decreased phosphorylation of FOXO1 and FOXO3A (Fig. 1B).
Figure 1.

Gene expression changes resulting from liver-specific deletion of Rictor. A) qPCR validation of genes identified in the RKO liver microarray analysis. WT and RKO male mice were unfed overnight and refed for 3 h (n=4 WT vs. 11 RKO mice) **P < 0.005. B) Western blot analysis of triplicate liver homogenates from WT and RKO mice for RICTOR, IRS2, phospho-FOXO3A and phospho-FOXO1, and phosphorylated and total AKT. C) qPCR analysis of primary hepatocytes derived from WT and RKO mice (n=9 WT vs. 6 RKO). *P < 0.03, **P < 0.001. D) Western blot of lysates from WT and RKO primary hepatocyte cultures. E, F) Genes identified in the RKO microarray were analyzed by using an expanded set of WT and RKO livers (n=4–12 WT vs. 11–18 RKO). *P < 0.02, **P < 0.01. G, H) RNA prepared from WT and RKO primary hepatocyte cultures were analyzed for expression of the same genes (n=9 WT vs. 6 RKO). *P < 0.05, **P < 0.005. Data represent means ± SE.
The analysis of in vivo signaling is complicated by cell-nonautonomous effects mediated by altered hormone and nutrient signaling. To determine whether alterations of gene transcription were cell autonomous, we cultured primary hepatocytes from WT and RKO mice. As with RKO livers, primary hepatocytes cultured from RKO mice had increased expression of Lepr, Igfbp1, and Irs2 and decreased expression of Gck (Fig. 1C). In agreement with the increased mRNA expression of Lepr and Irs2, we observed increased leptin receptor and IRS2 protein content in primary hepatocytes isolated from RKO mice (Fig. 1D).
Using qPCR, we studied the expression of several other genes that appeared to have altered expression in RKO mice, according to the microarray data, but did not reach the statistical threshold of FDR < 0.05. Livers of RKO mice showed increased expression of regulator of G-protein signaling 16 (Rgs16), the Mg2+ transporter Nipal1, the Rho GTPase Cdc42ep5, and the mitochondrial carrier Slc25a47 (Fig. 1E). In agreement with previous findings (7–9), we observed that RKO mice show increased expression of fatty acid binding protein 5 (Fabp5) and glucose 6-phosphatase (G6p), relative to WT mice. We also observed decreased expression in RKO livers of the sodium/bile acid cotransporter Slc10a2, lipocalin-13 (Lcn13), the retinoic acid early-inducible gene Raet1d, the androgen receptor (Ar), N-acetyltransferase 8 (Nat8), the cell adhesion molecule Ncam2, and succinate receptor 1 (Sucnr1) (Fig. 1F).
Although many of the effects of Rictor deletion in vivo were replicated in vitro, we observed decreased (not increased) expression of Slc25a47 in primary hepatocytes in culture (Fig. 1G). In contrast to the in vivo state, we saw no alteration in the expression of Ar in vitro (Fig. 1H). Although Gck expression was decreased both in vivo and in vitro, G6p expression was induced only in vivo; its expression was decreased in primary hepatocytes isolated from RKO mice.
Genes identified in the microarrays that differed in mean expression level by ≥1.5-fold between the control and RKO groups were subjected to IPA. The total number of input genes was 310. Of those, 298 were mapped and included in the analysis. Among this panel, which included all the genes described above, 55% were down-regulated in the RKO group relative to the control mice, and the remaining 45% were upregulated. A control analysis was performed on 5 sets of genes that did not differ in expression level (<1.1-fold difference) between the two groups.
Results for IPA biological functions (Fig. 2A and Table 1) showed that genes that differed in expression between the two groups represented 9 categories relating to carbohydrate and lipid metabolism. Identification of these categories was based on highly significant P values that were well below the range seen for the 5 control analyses. The genes accounting for the identification of these categories (Supplemental Table S2C) were both up- and down-regulated and were consistent with the changes in glucose homeostasis that have been characterized in the RKO mouse (7, 9).
Figure 2.

IPA of RKO microarray data. Genes numbering 298 that were identified in IPA and differed in mean expression level by ≥1.5-fold between the control and RKO groups were subjected to Ingenuity Pathway Analysis. Graphs show the distribution of P values for 5 control gene sets for each analysis, each of which were equal in number to the experimental gene set. A) Biological functions. B) Canonical pathways. C) Transcription factors. Tables 1–3 show IPA categories and corresponding P values for each analysis.
Table 1.
IPA categories and corresponding P values for biological functions
| Category | Log10 P |
|---|---|
| Glucose synthesis | −9.20 |
| Concentration of glucose | −6.94 |
| Concentration of acylglycerol | −6.75 |
| Concentration of triacylglycerol | −6.74 |
| Hexose metabolism | −6.62 |
| Metabolism of glucose | −6.18 |
| Dyslipidemia | −6.06 |
| Glucose tolerance | −5.97 |
| Insulin resistance | −5.89 |
See Fig. 2A.
IPA canonical pathways for which the P values were below the distribution of those obtained with the 5 control gene sets (Fig. 2B and Table 2) were largely accounted for by changes in a small number of genes (Supplemental Table S2D). Most prominent were those encoding cytochrome p450 enzymes (Cyp2a12, Cyp2c9, Cyp2c70, Cyp4f12, and Cyp27a1), hydroxysteroid dehydrogenases (Hsd3b2 and Hsd3b4), and enzymes involved in cholesterol esterification (Ces1, Ces1e, Ces2e, and Ces2b).
Table 2.
IPA categories and corresponding P values for canonical pathways
| Category | Log10 P |
|---|---|
| Glucocorticoid biosynthesis | −3.75 |
| Retinol biosynthesis | −3.66 |
| Androgen biosynthesis | −3.32 |
| Nitric oxide signaling | −2.75 |
| Nicotine degradation III | −2.61 |
| Atherosclerosis signaling | −2.49 |
| Nicotine degradation II | −2.45 |
| Mineralocorticoid biosynthesis | −2.37 |
| Bupropion degradation | −2.36 |
| Acetone degradation I | −2.36 |
| PXR/RXR activation | −2.30 |
| Type II diabetes mellitus signaling | −2.12 |
| Sphingosine-1-phosphate signaling | −2.10 |
| Glutathione-mediated detoxification | −2.03 |
See Fig. 2B.
Twenty-six transcription factors were identified by IPA as having P values that were below the range of the control (Fig. 2C and Table 3). Identification of these transcription factors was accounted for by 87 of the 298 mapped genes that were entered into the analysis (Supplemental Table S2E). It was not surprising that these genes reflected the biological functions and canonical pathways that were identified by IPA. Among the transcription factors that had the highest P values were Rora, which encodes the retinoic acid receptor–related orphan receptor α (RORα), and Rorc, which encodes RORγ. Other significant transcription factors were in the peroxisome proliferator-activated receptor (PPAR) family. Most notable among these was Ppara, which encodes PPARα, a key regulator of lipid metabolism in the liver. Also displaying an apparent high level of significance was the orphan receptor Nr0b2, which has been identified as having a role in regulation of gene expression in hepatocellular carcinoma (23). Also identified were Foxo1 and Foxoa2, consistent with our immunoblot results and with the involvement of mTORC2 in the regulation of carbohydrate and lipid metabolism (24, 25).
Table 3.
IPA categories and corresponding P values for transcription factors
| Category | Log10 P | Category | Log10 P |
|---|---|---|---|
| RORA | −13.00 | SREBF1 | −4.53 |
| RORC | −12.20 | NKX2–3 | −3.98 |
| PPARA | −8.21 | FOXA1 | −3.85 |
| NR0B2 | −7.74 | ESR1 | −3.80 |
| FOXO1 | −7.44 | TAF4B | −3.73 |
| FOXA2 | −6.84 | NR1H3 | −3.60 |
| CTNNB1 | −6.75 | KLF15 | −3.59 |
| RXRA | −6.51 | CEBPA | −3.58 |
| AHR | −6.21 | NR1I2 | −3.57 |
| ESRRA | −6.20 | NCOA2 | −3.53 |
| PPARGC1A | −6.07 | NCOA4 | −3.45 |
| PPARG | −5.77 | FOS | −3.41 |
| STAT3 | −4.79 | NR4A1 | −3.26 |
See Fig. 2C.
GSEA was performed with 5 gene sets, including KEGG, Reactome, and Biocarta. The results (Fig. 3 and Supplemental Table S2) were unexpected. With a conservative FDR of 0.05, 3 KEGG gene sets were found to be upregulated in the RKO mice. The first, ribosome, was accounted for by the coordinated up-regulation of genes encoding ribosomal proteins in the RKO samples. Because of the large number of ribosomal protein pseudogenes in the mouse genome, we followed our initial observation with a reanalysis of the microarray data for which all probesets corresponding to ribosomal protein pseudogenes were removed. The results (Fig. 3A) confirmed the increased expression of functional ribosomal protein genes in the RKO samples. The second GSEA category identified as upregulated in the RKO livers, oxidative phosphorylation, included a spectrum of genes among which NADH subunits were disproportionately represented (Fig. 3B). The third category, proteasome, was accounted for by components of the 26S proteasome (Fig. 3C). GSEA did not reveal any gene sets to be significantly down-regulated in the livers from the RKO mice.
Figure 3.

GSEA of RKO microarray data. GSEA was performed on the full set of genes detected in the RKO microarray experiment. Panels represent 3 KEGG categories that were significant with FDR < 0.05. A) Ribosome. B) Oxidative phosphorylation. C) Proteasome. Enrichment score profile is shown for each category. Right panels are heat maps for the genes in each gene set, along with the specific genes depicted in them.
Several other gene sets contained within KEGG, Reactome, and Biocarta were identified as significant. However, their identification was based on changes in genes that were also identified in the 3 aforementioned KEGG gene sets. For example, Reactome 3_UTR_Mediated_Translational_Regulation, Influenza_Life_Cycle, and Peptide_Chain_Elongation were all identified based on the up-regulation of ribosomal protein genes in the RKO mice.
We sought to compare the effects of RICTOR depletion to the effects of mTORC1 inhibition by rapamycin, by analyzing microarray data generated by the analysis of livers from mice that were unfed overnight, given rapamycin or vehicle, and then refed for various lengths of time before death. As with the RKO mice, we analyzed liver RNA by microarray and performed IPA and GSEA.
Consistent with previous data on the role of rapamycin in vivo, rapamycin induced changes in genes involved in the metabolism or synthesis of cholesterol, as well as changes in the aldosterone signaling pathway (Supplemental Fig. S1A, B and Supplemental Table S2). IPA also identified 16 significantly affected transcription factors. Most notable among these were sterol regulatory element-binding transcription factor 1 and 2 (Srebf1 and Srebf2) and Nfe2l2 (also known as Nrf2) (Supplemental Fig. S1C). The identification of these transcription factors is consistent with previous work on the effects of rapamycin (4, 26–28). Notably, only 3 transcription factors significantly altered in the RKO mice were also altered by rapamycin, and no common IPA pathways or biological functions were identified. These results were interpreted as showing a clear distinction between the physiology of RKO mice and that of mice in which hepatic mTORC1 is inhibited. The effect of rapamycin on cholesterol metabolism was confirmed by GSEA, which also identified decreased steroid biosynthesis in rapamycin-treated mice (Supplemental Fig. S2).
Profiling of the liver phosphoproteome in RKO mice
mTORC2 is thought to directly phosphorylate AKT S473, SGK S422, and PKCα S657 (29). We have previously analyzed the effects of rapamycin on the in vivo liver phosphoproteome of rats (14). Based on the use of a short period of rapamycin exposure (75 min) and refeeding (60 min) before death, we interpreted the results of our prior studies as reflecting inhibition of mTORC1. For the present studies, we used a similar approach to characterize the mTORC2-dependent phosphoproteome in vivo in liver. Three control mice and 3 RKO mice were unfed for 24 h to minimize mTORC2 signaling. We elected to administer 10 mg/kg rapamycin to prevent refeeding from activating the mTORC1-dependent signaling events that we observed in our previous study (14). After 1 h, mice were given ad libitum access to food. They were euthanized 45 min into the refeeding period.
Liver samples were analyzed by immunoblot, to confirm the validity of the experimental model. Results (Fig. 4A) showed the expected marked reduction in RICTOR in the RKO mice. We also observed reduced phosphorylation of AKT at S473 (Fig. 4A), reduced phosphorylation of AKT at T308 and T450, and phosphorylation of PKCα at S657 (data not shown). These results were interpreted as being consistent with selective loss of mTORC2 signaling in liver tissue from the RKO mice. A marked reduction in ribosomal protein S6 phosphorylation confirmed the efficacy with which mTORC1 was inhibited in the animals that received rapamycin.
Figure 4.

Analysis of the RKO phosphoproteome. A) Western blot analysis was performed to validate the model system and to demonstrate the status of mTORC1 (phospho-S6) and mTORC2 (phospho-AKT). For these experiments, some animals received insulin, while others were unfed overnight and refed with standard laboratory chow. All mice except those represented in the first 2 lanes were given rapamycin before insulin or refeeding. B) Distribution of RKO-associated fold change in phosphopeptide abundance was examined. For each peptide identified in all 3 control samples, fold change in the RKO samples was determined to be the minimum fold change among the 3 paired analyses generated for each phosphopeptide. Graph shows the number of peptides in categories ranging from <1.1-fold different to ≥100-fold different. Arrow indicates calculated inflection point.
The final data set derived from the triplicate control and RKO mice contained 4643 nonredundant phosphorylation sites on 1902 proteins. These results were derived from 6141 phosphopeptides that were identified at a 1% FDR confidence level by using the decoy database approach (17). The analyses from the 3 control biological replicates indicated the reproducibility of our results. Eighty-seven percent of the phosphopeptides were identified in all 3 control biological replicates. Only 11 and 2% of the phosphopeptides were identified in 2 and 1 of the control biological replicates, respectively.
Characterization of the mouse liver phosphoproteome based on the combined control and RKO analyses showed that serine phosphorylation predominated (4007 sites representing 86% of all phosphorylation sites). Next in abundance were threonine phosphorylation (561 sites; 12%) and tyrosine phosphorylation (75 sites; 2%). Based on an Ascore > 19, >99% certainty for correct phosphorylation site assignment was achieved for 62% of the data set (3824 of 6141 phosphopeptides). Phosphopeptide site assignments with an Ascore < 19 were considered ambiguous (identified by an asterisk under “phosphosite annotated” in Supplemental Table S1).
As described previously (14), we set a threshold for effects of Rictor deletion at 3.5-fold based on an analysis of the control:RKO ratios for all phosphopeptides (Supplemental Table S1), followed by calculation of an inflection point in the distribution of fold changes (Fig. 4B). Phosphosites for which 3 of 3 paired analyses showed a fold change > 3.5 (Tables 4 and 5) numbered 51. These sites were distributed among 39 proteins. Of the unique phosphopeptides that were detected, 27 were reduced in abundance in the RKO mice, and 24 were increased. Among the sites that were reduced in the RKO mice was RICTOR S21. This result was attributable to the reduction in the content of RICTOR.
Table 4.
Phosphoproteins representing phosphopeptides that were decreased in abundance in the RKO mice
| Protein name | Gene symbol | Phosphosite | WT:RKO ratios |
|---|---|---|---|
| Abhydrolase domain-containing protein 15 | Abhd15 | T142 | 9, >100, >100 |
| α-1B adrenergic receptor | Adra1b | S266 | >100, >100, >100 |
| Atpase, class VI, type 11C | Atp11c | S1113 | 5, 4, 32 |
| Protein dopey-2 | Dopey2 | S718 | >100, 26, 31 |
| Phospholemman | Fxyd1 | S82 | 9, 11, 7 |
| Phospholemman | Fxyd1 | S83 | 8, >100, 9 |
| Phospholemman | Fxyd1 | T79 | 9, 11, 7 |
| GC-rich sequence DNA-binding factor 1 | Gcfc | S262 | >100, >100, 10, |
| Glucagon receptor | Gcgr | S432 | >100, >100, >100 |
| Glycogen [starch] synthase, liver | Gys2 | S645, S652 | >100, 59, >100 |
| HIV Tat-specific factor 1 homolog | Htatsf1 | S441, S446 | >100, >100, >100 |
| Insulin receptor | Insr | S1340 | 34, 10, 7 |
| N-myc downstream regulated 2 | Ndrg2 | S328, T330, S332, T334 | 11, 19, 51 |
| N-myc downstream regulated 2 | Ndrg2 | S335, S338 | 7, 9, 10 |
| N-myc downstream regulated 2 | Ndrg2 | S346, S350, S353 | 5, 7, 8 |
| N-myc downstream regulated 2 | Ndrg2 | S346, S353 | 4, 6, 6 |
| N-myc downstream regulated 2 | Ndrg2 | S346, T348, S353 | >100, 7, 30 |
| N-myc downstream regulated 2 | Ndrg2 | S352, S353, S355 | 4, 4, 6 |
| N-myc downstream regulated 2 | Ndrg2 | T330, S332, S335, S338 | >100, 9, >100 |
| N-myc downstream regulated 2 | Ndrg2 | T348, S350, S353 | 4, 8, 5 |
| N-myc downstream regulated 3 | Ndrg3 | T329, S331 | 4, 6, >100 |
| N-myc downstream regulated 3 | Ndrg3 | T332, S333, S335 | 5, >100, >100 |
| Protein phosphatase 1 regulatory subunit 7 | Ppp1r7 | S24 | >100, >100, >100 |
| Protein kinase D3 | Prkd3 | S734 | 11, 8, 5 |
| Rapamycin-insensitive companion of mTOR | Rictor | S21 | 14, >100, 29 |
| Regulation of nuclear pre-mRNA domain-containing protein 1B | Rprd1b | S134 | >100, >100, >100 |
| Serine/arginine repetitive matrix protein 2 | Srrm2 | S1037 | >100, 4, >100 |
The 3 WT:RKO ratios shown for each peptide represent the results of triplicate paired analyses.
Table 5.
Phosphoproteins representing phosphopeptides that were increased in abundance in the RKO mice
| Protein name | Gene symbol | Phosphosite | WT:RKO ratios |
|---|---|---|---|
| A-kinase anchor protein 1, mitochondrial | Akap1 | S101 | 0.04, 0.10, <0.01 |
| Bcl-2-like protein 13 | Bcl2l13 | S347 | <0.01, 0.27, 0.01 |
| BCL2/adenovirus E1B 19 kDa protein-interacting protein 3-like | Bnip3l | S165 | <0.01, 0.01, 0.26 |
| Uncharacterized protein C6orf64 homolog | C6orf64 | S16 | <0.01, <0.01, <0.01 |
| Copper chaperone for superoxide dismutase | Ccs | S267 | 0.27, 0.12, <0.01 |
| Carbamoyl-phosphate synthetase 1 | Cps1 | T784 | 0.20, 0.01, 0.11 |
| Receptor tyrosine-protein kinase erbB-3 | Erbb3 | S980 | 0.11, <0.01, <0.01 |
| Protein ETHE1, mitochondrial | Ethe1 | S14 | 0.28, 0.17, 0.04 |
| Golgb1 protein | Golgb1 | S2655 | 0.17, 0.21, 0.03 |
| G-protein-coupled receptor 107 | Gpr107 | S537 | 0.05, 0.05, 0.09 |
| General transcription factor IIF subunit 1 | Gtf2f1 | S217, S218, S221 S224 | 0.02, 0.26, 0.12 |
| Glycogen [starch] synthase, liver | Gys2 | S6S11 | 0.08, 0.26, 0.28 |
| Glycogen [starch] synthase, liver | Gys2 | S8S11 | 0.11, 0.14, 0.28 |
| Interferon regulatory factor 2 binding protein 2 | Irf2bp2 | S440 | <0.01, <0.01, <0.01 |
| Krueppel-like factor 3 | Klf3 | S91, S98 | 0.04, 0.20, 0.16 |
| Phenylalanine-4-hydroxylase | Pah | Y24 | 0.11, 0.13, 0.22 |
| Pleckstrin homology-like domain family B member 2 | Phldb2 | S486, S490 | 0.17, 0.09, 0.15 |
| Ribonuclease P/MRP protein subunit POP5 | Pop5 | S157 | 0.03, <0.01, <0.01 |
| SAM and SH3 domain-containing protein 1 | Sash1 | S500 | <0.01, <0.01, <0.01 |
| Vesicle-trafficking protein SEC22b | Sec22b | S137 | 0.11, 0.21, 0.21 |
| Splicing factor 3A subunit 3 | Sf3a3 | S365, S367, S369 | 0.26, 0.26, 0.08 |
| Acetyl-coenzyme A transporter 1 | Slc33a1 | S42 | 0.28, 0.23, 0.01 |
| Serine/arginine repetitive matrix protein 2 | Srrm2 | S924, S926, S928 | 0.25, 0.12, <0.01 |
| Ubiquitin-conjugating enzyme E2 J1 | Ube2j1 | T267 | 0.20, 0.22, 0.03 |
The 3 control:RKO ratios shown for each peptide represent the results of triplicate paired analyses.
Several of the phosphorylation sites that were altered in the RKO mice drew our attention. Multiple peptides representing 15 phosphorylation sites on N-myc downstream regulated 2 (NDRG2) were consistently reduced in abundance in the RKO mice. We were not able to assess NDRG2 abundance by immunoblot. It is possible that the consistent change in NRDG2 phosphorylation status reflects a reduction in protein content, but we did note that Nrdg2 expression was not altered in our microarray results. In addition, NDRG2 has been identified as a substrate for SGK (29).
A peptide containing the dually phosphorylated S645/S652 on glycogen synthase was markedly reduced, as was the S24 site on protein phosphatase 1 regulatory subunit 7 (PPP1R7). In both cases, additional sites on these proteins were identified but did not show similar differences, indicating that protein abundance was unlikely to account for the findings. Somewhat surprising was the identification of a novel site on the insulin receptor that was down-regulated in the RKO mice, S1340. Similarly, a peptide containing S432 of the glucagon receptor was markedly reduced in abundance in the RKO mice. Western blot analysis demonstrated no change in the abundance of either the insulin or glucagon receptors (data not shown).
Among the phosphorylated peptides that were increased in abundance in the RKO mice were those containing the S6/S8/S11 sites on glycogen synthase. This was in contrast to the aforementioned reduction in S645/S652-containing peptides in the RKO mice. The spectrum of functions among the proteins containing sites that were upregulated in the RKO mice was broad. They included several metabolic enzymes, receptors, transport and trafficking proteins, and mitochondrial proteins.
To determine the extent to which mTORC1-regulated sites were altered in the RKO mice, we compared the present data to our previous phosphoproteomics analysis of rapamycin's effect in vivo (14) and to a previously performed quantitative analysis of rapamycin-sensitive sites in cell lines (30). For these and other subsequent analyses, we broadened the array of phosphoproteins by including those whose phosphorylation state changed by 3.5-fold in 2 of 3 biological replicates and ≥1-fold in the same direction in the third replicate. This allowed the categorization of 144 RKO-regulated candidate proteins. Of these 144 proteins, only 1 phosphorylated residue, CAD S1859, an S6K substrate (31, 32), had been identified as either rapamycin sensitive or mTORC1 regulated. We detected altered phosphopeptide abundance in 12 additional proteins with rapamycin-sensitive or mTORC1-dependent sites. However, these proteins were modified in the RKO mice at different residues than those identified in our previous mTORC1 studies. Examination of gene ontology by IPA did not reveal any biological function or subcellular localization classifications that were altered in the RKO mice.
We analyzed the phosphorylation sites that were decreased in RKO mice using the Kinexus PhosphoNET kinase predictor. SGK scored highly as a candidate kinase for multiple sites in NDRG2 and for sites in FXDY1, phosphofructo-2-kinase/fructose-2,6-biphosphatase (PFKFB1), PPP1R7, and PRKD3 (Table 6). In addition, we observed that mitogen- and stress-activated protein kinase 1 and 2 (MSK 1 and MSK2), which are regulated by the p38 MAPK and ERK signaling pathways, were prominent as predicted kinases for phosphorylated residues down-regulated in RKO mice. p38 MAPK itself appeared in the kinase identification results, but was not among the most frequently identified kinases.
Table 6.
Predicted kinases for each of the phosphorylation sites that were down-regulated in livers from RKO mice
| Gene symbol | P-site | Predicted kinase 1 | Predicted kinase 2 | Predicted kinase 3 | Predicted kinase 4 | Predicted kinase 5 |
|---|---|---|---|---|---|---|
| Adra1b | S266 | MSK1 (288) | MSK2 (269) | IKKb (267) | TRIO (266) | IKKa (262) |
| Atp11c | S1113 | MSK1 (534) | CHK1 (494) | AURA (489) | DCAMKL1 (476) | PRKY (475) |
| Dopey2 | S718 | p38d MAPK (739) | CDKL5 (611) | PFTAIRE1 (587) | NUAK1 (377) | IKKb (370) |
| Fxyd1 | T79 | IKKb (211) | MSK1 (199) | LATS1 (187) | MEK7 (182) | ASK2 (182) |
| Fxyd1 | S82 | CHK1 (291) | ASK2 (276) | TRIO (257) | ROCK2 (251) | MSK1 (247) |
| Fxyd1 | S83 | MSK1 (492) | ROCK2 (457) | SGK (424) | PRKY (415) | AURA (399) |
| Gcfc | S262 | ASK2 (318) | DCAMKL1 (308) | MEK7 (307) | CASK (288) | GAK (276) |
| Gys2 | S645 | CDKL5 (757) | p38d MAPK (749) | PFTAIRE1 (674) | IKKb (479) | IKKa (467) |
| Gys2 | S652 | IKKb (341) | CDKL5 (321) | CHK1 (302) | BUB1 (302) | ROCK2 (293) |
| Ndrg2 | S328 | PRKY (306) | MSK2 (303) | NUAK1 (303) | SGK (292) | IKKb (291) |
| Ndrg2 | T330 | CHK1 (402) | SGK (340) | PRKY (308) | DCAMKL1 (297) | DRAK2 (288) |
| Ndrg2 | S332 | SGK (700) | PRKY (690) | MSK2 (613) | MSK1 (595) | NUAK1 (542) |
| Ndrg2 | T334 | SGK (216) | NUAK1 (188) | PRKY (176) | MSK2 (176) | MPSK1 (139) |
| Ndrg2 | S335 | p38d MAPK (284) | IKKb (263) | PRKY (261) | IKKa (245) | MAST4 (240) |
| Ndrg2 | S338 | CHK1 (319) | DCAMKL1 (299) | MSK2 (286) | MSK1 (279) | SGK (276) |
| Ndrg2 | S346 | PRKY (520) | SGK (509) | MSK2 (498) | MSK1 (466) | DAPK3 (465) |
| Ndrg2 | T348 | SGK (544) | PRKY (507) | MSK2 (459) | NuaK1 (427) | MSK1 (412) |
| Ndrg2 | S350 | SGK (732) | PRKY (682) | MSK2 (607) | MSK1 (598) | p38d MAPK (592) |
| Ndrg2 | S352 | NUAK1 (427) | SGK (394) | PRKY (383) | MSK2 (370) | MSK1 (339) |
| Ndrg2 | S353 | PDK1 (320) | p38d MAPK (316) | IKKa (301) | SGK (300) | PRKY (296) |
| Ndrg2 | S355 | CDKL5 (286) | IKKb (285) | MAST3 (284) | NUAK1 (277) | IKKa (273) |
| Ndrg3 | T329 | CHK1 (383) | SGK (374) | PRKY (347) | MSK2 (333) | DRAK2 (309) |
| Ndrg3 | S331 | SGK (720) | PRKY (708) | MSK2 (649) | MSK1 (619) | DAPK3 (605) |
| Ndrg3 | T332 | p38d MAPK (130) | BUBR1 (91) | MAST3 (91) | LATS1 (83) | PFTAIRE1 (81) |
| Ndrg3 | S333 | SGK (416) | NUAK1 (413) | CHK1 (401) | MSK2 (366) | PRKY (364) |
| Ndrg3 | S335 | NUAK1 (409) | PRKY (377) | p38d MAPK (365) | SGK (356) | IKKb (333) |
| Ppp1r7 | S24 | PRKY (443) | SGK (416) | MSK1 (412) | RSK1 (411) | CHK1 (405) |
| Prkd3 | S734 | PDK1 (501) | MSK1 (474) | AURA (442) | SGK (440) | ROCK2 (440) |
| Rictor | S21 | PRKY (565) | SGK (555) | MSK2 (554) | MSK1 (539) | RSK1 (525) |
Following each kinase, in parentheses, is a score derived from empiric data that indicates the likelihood of the relationship between site and kinase. P-site, phosphosite.
Signaling by p38 MAPK is modulated in RKO mice
p38 MAPK activity is regulated by its phosphorylation at T180/Y182. Our MS analysis identified a mean 3.2-fold decrease in p38α Y182 phosphorylation in RKO mice (control:RKO ratios of 1.48, 3.44, and 4.81). We decided to further investigate this result. Western blot analysis of the samples used for MS (unfed overnight and refed in the presence of rapamycin) demonstrated a decrease in p38 T180/Y182 phosphorylation in the RKO livers (Fig. 5A). The same decrease in p38 T180/Y182 phosphorylation was observed in the livers of the RKO mice unfed overnight and then refed without prior administration of rapamycin (Fig. 5B). In neither case was there a change in total p38 content.
Figure 5.
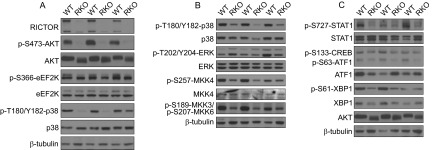
Decreased p38 pathway signaling in RKO livers. A) Western blot analysis was performed with samples from animals that were unfed overnight and given rapamycin before refeeding. These were the same samples that were used for MS. B) An independent set of mouse liver samples derived from WT and RKO mice unfed overnight and refed for 45 min without rapamycin was similarly analyzed. C) These same samples were analyzed for the phosphorylation of p38 substrates.
p38 T180/Y182 phosphorylation is mediated by the upstream kinases MKK4 and MKK3/6 (33). The activity of these kinases is regulated by the phosphorylation of MKK4 S257 and MKK3 S189/MKK6 S207. The RKO mice were found to have a decrease in the phosphorylated forms of these kinases (Fig. 5B). In the case of MKK4, we found consistent content of the kinase, indicating a change in the stoichiometry of phosphorylation. We do not have data on the content of MKK3/6, and so the basis for the change in phosphorylation is less certain. Dissecting the signaling further upstream is complicated by both the number of activating kinases and the lack of available antibodies. However, our MS analyses did detect phosphopeptides for TAO1 S445 and MLK4 S728, two kinases that function upstream in the p38 MAPK signaling pathway. As discussed above for p38α, although only one replicate showed a greater than 3.5-fold change, phosphorylation of both TAO1 S445 and MLK4 S728 showed mean decreases of ∼5-fold in the RKO livers.
p38 MAPK has numerous substrates, including STAT1, MSK1/2, XBP1, and eEF2K. Immunoblot analysis showed a decrease in eEF2K phosphorylation in RKO mice unfed overnight and refed in the presence of rapamycin (Fig. 5A). This same change did not occur in refed mice that were not given rapamycin, indicating that mTORC1 and mTORC2 may have divergent effects on signaling to eEF2K. Based on this observation, we used the samples obtained in the absence of rapamycin for further analysis. In contrast to the change in p38, Erk signaling did not show consistent changes in the RKO mice (Fig. 5B). With regard to p38 substrates, we saw decreased phosphorylation of STAT1 S727 in the RKO livers (Fig. 5C). We also observed decreased phosphorylation of ATF1 S63, which is regulated by MSK1/2 in response to p38 MAPK and ERK signaling (Fig. 5C). Total eEF2k, Stat1, and ATF1 were similar in the control and RKO samples, indicating that the change in these potential p38 MAPK substrates was a result of altered phosphorylation, not content. In contrast, XBP1 S61, a purported p38 MAPK substrate (22), was also reduced in the RKO livers (Fig. 5C). However, p38 MAPK signaling positively regulates XBP1 protein levels (22), and we observed decreased total protein levels of XBP1 in the RKO livers (Fig. 5C).
DISCUSSION
When first identified, mTORC2 was shown to be a rapamycin-insensitive regulator of actin cytoskeleton reorganization and cell migration (34). Since that time, data have been published pointing to roles in protein synthesis, protein maturation, autophagy, and metabolic regulation (29). Several purported mTORC2 substrates have been described, further defining its biological role. Foremost among these substrates are AKT, PKC isotypes, and SGK (29). The goal of the present study was to use genomic and proteomic approaches to more broadly define the physiological role of hepatic mTORC2 signaling in vivo. Rapamycin administration is now receiving significant attention as a potential treatment for age-related diseases, yet we now understand that chronic treatment with rapamycin inhibits not only mTORC1 but also mTORC2. Potent mTOR kinase inhibitors, such as Torin 1 (35) and pp242 (36), which strongly inhibit both mTORC1 and mTORC2, are also under investigation as potent inducers of autophagy and powerful antiproliferative agents. The inhibition of mTORC2 by chronic rapamycin treatment and by mTOR kinase inhibitors may be problematic, based on the biological role of mTORC2, or it could be desirable, depending on the role of mTORC2 in these and other disease processes. Although studies in tissue-specific RKO mice have indicated that mTORC2 plays an important role in organismal physiology and metabolism (7), the broader spectrum of signaling mechanisms, pathways, and processes regulated by mTORC2 have remained relatively unexplored.
We chose a food withdrawal–refeeding protocol to activate mTORC2 and administration of rapamycin to minimize the effects of mTORC1 activation. With this experimental paradigm, our gene expression results showed a relationship between mTORC2 and the regulation of intermediary metabolism. Refeeding-associated induction of glucokinase was abrogated in the RKO mice, as was down-regulation of G6p. IPA identified highly significant biological function categories relating to carbohydrate and lipid metabolism, and one of the 3 significant GSEA categories, oxidative phosphorylation, was based on altered expression of components of NADH dehydrogenase, which comprises complex I of the mitochondrial respiratory chain. Some of the gene expression effects that we observed suggested mediation through changes in FOXO signaling, an effect we were able to demonstrate directly by using phospho-specific Western blot analyses. Our data indicate that mTORC2 plays a major role in the control of intermediary metabolism through regulation at the level of gene expression. Furthermore, our comparison studies using rapamycin indicated that observations in the RKO mice could not be attributed to secondary effects on mTORC1 signaling.
Our genomic data indicated the potential involvement of 26 candidate transcription factors identified by IPA. Identification of a potential role for the FOXO and PPAR transcription factors is consistent with prior observations (29). The cell-autonomous effects on gene expression that we observed in the primary hepatocyte cultures are consistent with a direct role for FOXO in mediating mTORC2's effects on gene expression, but a definitive demonstration of this role would require additional experiments. The same can be stated for the sterol regulatory element-binding transcription factors (8, 9). In fact, Srebf1 and Srebf2 were identified in our study as being sensitive to short-term rapamycin administration, indicating that effects mediated by these transcription factors may involve both mTOR complexes. Our identification of the retinoic acid receptor-related orphan receptors as candidate mTORC2-regulated transcription factors is a novel finding.
Another effect of Rictor deletion at the level of gene expression level was the increased expression of Lepr. Increased leptin receptor abundance has been observed in mice that do not express insulin receptor in the liver [liver-specific insulin receptor knockout (LIRKO); ref. 37]. Despite these changes, neither LIRKO mice nor RKO mice exhibit increased body weight or changes in food intake (37). The increased expression of Lepr and Irs2 in RKO mice may well reflect a feedback mechanism downstream from a reduction in PI3K signaling. Both the Lepr and Irs2 promoters contain insulin response elements, and expression of both genes is regulated by insulin (37, 38). The decreased expression of Lcn13 is also noteworthy. Recent work has found that LCN13 is an insulin-sensitizing hormone that promotes glucose tolerance and suppresses hepatic glucose production (39). Lcn13 expression was decreased not only in liver but also in cultured primary hepatocytes, indicating that this change is cell autonomous and is not a consequence of an altered in vivo environment. Decreased Lcn13 expression may contribute to the hepatic insulin resistance of RKO mice.
Using GSEA, we identified broad changes in the expression of ribosomal proteins and of components of the 26S proteosome in liver tissue from RKO mice. This analytical method looks at the hierarchy of fold difference in all genes and then determines whether the genes in a particular gene set show differing hierarchies in the two experimental groups. Thus, this analytical approach, unlike the approach involving IPA, allows for the identification of groups of genes that are altered under specific experimental conditions, even when the fold change in individual genes is small.
Although it has been established that ribosomal proteins are regulated in parallel at the mRNA level (40), transcriptional or post-transcriptional mechanisms accounting for this regulation are not well characterized. It may be of physiological significance that we observed RKO-related changes in a large number of ribosomal protein pseudogenes. An examination of tissue-to-tissue variation in these pseudogenes has been interpreted as indicating a possible contribution to tissue-specific biological processes (41). The most direct interpretation of our results is that abrogation of mTORC2 signaling in liver results in a general up-regulation of hepatic ribosomal protein expression. It is unlikely that this is attributable to indirect effects on mTORC1 signaling. We found no evidence that deletion of Rictor in the liver results in a change in mTORC1 signaling. In fact, we examined phosphorylation of S6 in the livers used for the gene expression analysis, and it was the same in the control and RKO livers used for this experiment (data not shown). In addition, we had not previously observed rapamycin-associated changes in ribosomal proteins in our own studies in the late gestation fetal rat (42) or in cells with constitutively activated mTORC1 (26). We saw similar up-regulation of ribosomal protein expression in refed adult rats exposed to chronic rapamycin (unpublished results), but this might well be due to secondary disruption of mTORC2 (7). Components of the 26S proteosome were also up-regulated in RKO liver. The observation that these two gene sets were affected in a highly significant and specific manner in liver tissue with attenuated mTORC2 signaling is consistent with the conclusion that both mTORC1 and TORC2 may have a role in the modulation of global protein synthesis and degradation.
The phosphoproteomic profiling of liver tissue from RKO mice identified only one phosphoprotein predicted by prior observations, NDRG2. This lack of concordance with earlier findings may be due to the complexity of the samples subjected to analysis and the likely low abundance or low stoichiometry of phosphorylation of most signaling proteins and transcription factors. Nonetheless, our phosphoproteomic results coincided with our gene expression data. Both are consistent with mTORC2-mediated regulation of gluconeogenesis and glycolysis. In addition to changes in the expression of G6p and Gck, we observed increased phosphorylation of S33 of PFKFB2, a heterodimeric enzyme that regulates the rates of glycolysis and gluconeogenesis. Phosphorylation of PFKFB2 at this residue promotes fructose-2,6-biphosphatase activity while attenuating phosphofructokinase 1 activity, thus favoring hepatic gluconeogenesis relative to glycolysis (43, 44). In addition, we identified increased phosphorylation of PFKFB2 at Y216, a site for which functional significance has not been assigned. We also observed decreased phosphorylation of specific residues on the insulin receptor and glucagon receptor in RKO mice. Although the functional consequences of these modifications is not known, they may represent additional points at which mTORC2 modulates glycolysis and gluconeogenesis. The phosphorylation site on the glucagon receptor is conserved in humans and rats, suggesting that it has functional significance. We also observed decreased phosphorylation of glycogen synthase at S645 and S652; phosphorylation of S645 decreases the activity of glycogen synthase (45). This finding is consistent with the possibility that depletion of mTORC2 favors increased glycogen synthesis in the context of increased gluconeogenesis and, therefore, increased substrate availability for glycogen formation.
Perhaps our most unexpected result was the observation that mTORC2 is involved in the regulation of in vivo hepatic p38 MAPK signaling. We saw a consistent decrease in p38 MAPK signaling in the livers of RKO mice. Coincident with changes in p38, we found decreased phosphorylation of upstream kinases as well as p38-regulated substrates. Our studies do not establish a role or requirement for p38 MAPK signaling in metabolic regulation by mTORC2, and understanding the significance of the altered p38 MAPK signaling to organismal physiology will require extensive additional research. Nonetheless, altered p38 MAPK signaling in the RKO mice may contribute to changes in carbohydrate metabolism. The regulation of XBP1, a p38 target, has recently been implicated in the control of hepatic gluconeogenesis (22). This and our other results are consistent with the hypothesis that the altered p38 MAPK signaling in RKO livers contributes to the hepatic insulin resistance we have observed in these mice. We propose a model in which mTORC2 signaling in vivo promotes the activation of p38 MAPK through ≥1 upstream p38 regulator (Fig. 6). Among these, we have included a link between SGK1 and MEKK3, which we base on a prior report (46). The downstream effectors of p38 signaling that we include in this proposed pathway are based on our phosphoproteomic data, immunoblot results, and kinase prediction. p38 MAPK was also identified as a predicted kinase for S645 on glycogen synthase, a phosphosite that we found to be decreased in RKO mice. Finally, p38 MAPK signaling has been shown to regulate the nuclear localization and transcriptional activity of FOXO transcription factors (47, 48). As discussed above, we identified FOXO1 and FOXOA2 as significant transcription factors in our IPA results, thus indicating a link between our microarray and phosphoproteomics studies.
Figure 6.

A proposed signaling network involving mTORC2 and the p38 pathway. This schematic was assembled from MS data, Western blot analyses, and kinase prediction (gray font).
In summary, our work represents a systematic analysis of the role of hepatic mTORC2 in vivo. Our results provide evidence for broad effects on gene expression, transcriptional regulatory mechanisms, hepatic intermediary metabolism, broad and diverse effects on the liver phosphoproteome and, more specifically, changes in hepatic p38 MAPK signaling. Some effects were cell autonomous, whereas others may have been secondary to a complex interaction between mTORC2 signaling and organismal physiological regulation. Our data indicate diverse biological roles for mTORC2 that, in some cases, overlap with the biological functions assigned to mTORC1. Our observations are consistent with a complex mTOR signaling network in which the two mTOR complexes work in tandem to regulate cell metabolism and gene expression, consistent with the conclusion that mTORC2 may be involved in metabolic dysregulation in a variety of pathophysiologic settings. It follows that hepatic mTORC2 may serve as a therapeutic target that modulates liver metabolism. Inhibition of mTORC2 signaling has been suggested as a therapeutic approach for the treatment of certain cancers (10), and mTOR kinase inhibitors that inhibit both mTORC1 and mTORC2 and the dual mTOR/PI3K inhibitors, are being developed for clinical use (49–51). Our results suggest that such inhibitors will have metabolic consequences through their effects on hepatic mTORC2, and our data provide a context for better understanding the consequences of therapeutic modalities that modulate mTORC2 activity.
Supplementary Material
Acknowledgments
The authors thank all the members of the D.M.S. and P.A.G. laboratories for their insightful comments and suggestions. The XBP1 S61 antibody was the kind gift of Umut Ozcan (Boston Children's Hospital, Boston, MA, USA), and the XBP1 and MKK4 antibodies were the kind gifts of Yuxiong Feng and Sandhya Sanduja (laboratory of Piyush Gupta, Whitehead Institute, Cambridge, MA, USA). The total STAT1 antibody was the kind gift of Christine Patterson (laboratory of Harvey Lodish, Whitehead Institute). The Rictor conditional-knockout mice were the generous gift of Mark Magnuson (Vanderbilt University Medical Center, Nashville, TN, USA). The authors thank Tom DiCesare (Whitehead Institute, Cambridge, MA, USA) for assistance with graphic design. D.W.L. is supported by an NIH K99/R00 Pathway to Independence Award (AG041765). M.M. is supported by a fellowship from the Damon Runyon Foundation.
This project was funded in part by a Julie Martin Mid-Career Award in Aging Research from the American Federation of Aging Research (AFAR) to D.M.S., by U.S. National Institute on Aging (NIA) grant R01 AI083636 to A.S., by a Mentored Quantitative Research Development Award from the U.S. National Institutes of Health (NIH)/NIA K25 AG028753 to N.N., and by U.S. National Institute of Child Health and Human Development (NICHD) grant R01 HD024455 to P.A.G. This research is based in part on work conducted in the Rhode Island National Science Foundation (NSF)/Experimental Program to Stimulate Competitive Research (EPSCoR) Proteomics Shared Resource Facility, which is supported in part by NSF/EPSCoR grant 1004057, NIH grant S10 RR020923, a Rhode Island Science and Technology Advisory Council grant, and the Division of Biology and Medicine at Brown University. D.M.S. is an investigator at the Howard Hughes Medical Institute.
This article includes supplemental data. Please visit http://www.fasebj.org to obtain this information.
- AR
- androgen receptor
- eEF2K
- eukaryotic elongation factor-2 kinase
- FDR
- false discovery rate
- G6P
- glucose 6-phosphatase
- GCK
- glucokinase
- GSEA
- Gene Set Enrichment Analysis
- IGFBP1
- insulin-like growth factor binding protein 1
- IPA
- Ingenuity Pathway Analysis
- IRS2
- insulin receptor substrate 2
- LCN13
- lipocalin-13
- LEPR
- leptin receptor
- LIRKO
- liver-specific insulin receptor knockout
- MAPK
- mitogen-activated protein kinase
- MS
- mass spectrometry
- MSK
- mitogen- and stress-activated protein kinase
- mTOR
- mechanistic target of rapamycin
- mTORC
- mechanistic target of rapamycin complex
- NDRG
- N-myc downstream regulated
- PCR
- polymerase chain reaction
- PFKFB2
- 6-phosphofructo-2-kinase/fructose-2,6-biphosphatase
- PI3K
- phosphatidylinositol 3-kinase
- PKC
- protein kinase C
- PP1R7
- protein phosphatase 1 regulatory subunit 7
- PPAR
- peroxisome proliferator-activated receptor
- q PCR
- quantitative polymerase chain reaction
- RKO
- Rictor knockout
- ROR
- retinoic acid receptor-related orphan receptor
- RT-PCR
- reverse transcription polymerase chain reaction
- S6K
- ribosomal protein S6 kinase
- SGK
- serum and glucocorticoid-induced kinase
- SREBF
- sterol regulatory element-binding transcription factor
- STAT1
- signal transducer and activator of transcription 1
- WT
- wild type
- XBP1
- X-box binding protein 1
REFERENCES
- 1. Crespo J. L., Diaz-Troya S., Florencio F. J. (2005) Inhibition of target of rapamycin signaling by rapamycin in the unicellular green alga Chlamydomonas reinhardtii. Plant Physiol. 139, 1736–1749 [DOI] [PMC free article] [PubMed] [Google Scholar]
- 2. Harrison D. E., Strong R., Sharp Z. D., Nelson J. F., Astle C. M., Flurkey K., Nadon N. L., Wilkinson J. E., Frenkel K., Carter C. S., Pahor M., Javors M. A., Fernandez E., Miller R. A. (2009) Rapamycin fed late in life extends lifespan in genetically heterogeneous mice. Nature 460, 392–395 [DOI] [PMC free article] [PubMed] [Google Scholar]
- 3. Miller R. A., Harrison D. E., Astle C. M., Baur J. A., Boyd A. R., de Cabo R., Fernandez E., Flurkey K., Javors M. A., Nelson J. F., Orihuela C. J., Pletcher S., Sharp Z. D., Sinclair D., Starnes J. W., Wilkinson J. E., Nadon N. L., Strong R. (2011) Rapamycin, but not resveratrol or simvastatin, extends life span of genetically heterogeneous mice. J. Gerontol. A Biol. Sci. Med. Sci. 66, 191–201 [DOI] [PMC free article] [PubMed] [Google Scholar]
- 4. Robida-Stubbs S., Glover-Cutter K., Lamming D. W., Mizunuma M., Narasimhan S. D., Neumann-Haefelin E., Sabatini D. M., Blackwell T. K. (2012) Tor signaling and rapamycin influence longevity by regulating skn-1/nrf and daf-16/foxo. Cell Metab. 15, 713–724 [DOI] [PMC free article] [PubMed] [Google Scholar]
- 5. Laplante M., Sabatini D. M. (2012) Mtor signaling in growth control and disease. Cell 149, 274–293 [DOI] [PMC free article] [PubMed] [Google Scholar]
- 6. Sarbassov D. D., Ali S. M., Sengupta S., Sheen J. H., Hsu P. P., Bagley A. F., Markhard A. L., Sabatini D. M. (2006) Prolonged rapamycin treatment inhibits mtorc2 assembly and akt/pkb. Mol. Cell 22, 159–168 [DOI] [PubMed] [Google Scholar]
- 7. Lamming D. W., Ye L., Katajisto P., Goncalves M. D., Saitoh M., Stevens D. M., Davis J. G., Salmon A. B., Richardson A., Ahima R. S., Guertin D. A., Sabatini D. M., Baur J. A. (2012) Rapamycin-induced insulin resistance is mediated by mtorc2 loss and uncoupled from longevity. Science 335, 1638–1643 [DOI] [PMC free article] [PubMed] [Google Scholar]
- 8. Hagiwara A., Cornu M., Cybulski N., Polak P., Betz C., Trapani F., Terracciano L., Heim M. H., Ruegg M. A., Hall M. N. (2012) Hepatic mtorc2 activates glycolysis and lipogenesis through akt, glucokinase, and srebp1c. Cell Metab. 15, 725–738 [DOI] [PubMed] [Google Scholar]
- 9. Yuan M., Pino E., Wu L., Kacergis M., Soukas A. A. (2012) Identification of akt-independent regulation of hepatic lipogenesis by mammalian target of rapamycin (mtor) complex 2. J. Biol. Chem. 287, 29579–29588 [DOI] [PMC free article] [PubMed] [Google Scholar]
- 10. Guertin D. A., Stevens D. M., Saitoh M., Kinkel S., Crosby K., Sheen J. H., Mullholland D. J., Magnuson M. A., Wu H., Sabatini D. M. (2009) Mtor complex 2 is required for the development of prostate cancer induced by pten loss in mice. Cancer Cell 15, 148–159 [DOI] [PMC free article] [PubMed] [Google Scholar]
- 11. Chirgwin J. M., Przybyla A. E., MacDonald R. J., Rutter W. J. (1979) Isolation of biologically active ribonucleic acid from sources enriched in ribonuclease. Biochemistry 18, 5294–5299 [DOI] [PubMed] [Google Scholar]
- 12. Mootha V. K., Lindgren C. M., Eriksson K. F., Subramanian A., Sihag S., Lehar J., Puigserver P., Carlsson E., Ridderstrale M., Laurila E., Houstis N., Daly M. J., Patterson N., Mesirov J. P., Golub T. R., Tamayo P., Spiegelman B., Lander E. S., Hirschhorn J. N., Altshuler D., Groop L. C. (2003) Pgc-1alpha-responsive genes involved in oxidative phosphorylation are coordinately downregulated in human diabetes. Nat. Genet. 34, 267–273 [DOI] [PubMed] [Google Scholar]
- 13. Subramanian A., Kuehn H., Gould J., Tamayo P., Mesirov J. P. (2007) Gsea-p: a desktop application for gene set enrichment analysis. Bioinformatics 23, 3251–3253 [DOI] [PubMed] [Google Scholar]
- 14. Demirkan G., Yu K., Boylan J. M., Salomon A. R., Gruppuso P. A. (2011) Phosphoproteomic profiling of in vivo signaling in liver by the mammalian target of rapamycin complex 1 (mtorc1). PLoS One 6, e21729. [DOI] [PMC free article] [PubMed] [Google Scholar]
- 15. Yu K., Salomon A. R. (2010) Htapp: high-throughput autonomous proteomic pipeline. Proteomics 10, 2113–2122 [DOI] [PMC free article] [PubMed] [Google Scholar]
- 16. Ficarro S. B., Salomon A. R., Brill L. M., Mason D. E., Stettler-Gill M., Brock A., Peters E. C. (2005) Automated immobilized metal affinity chromatography/nano-liquid chromatography/electrospray ionization mass spectrometry platform for profiling protein phosphorylation sites. Rapid Commun. Mass Spectrom. 19, 57–71 [DOI] [PubMed] [Google Scholar]
- 17. Perkins D. N., Pappin D. J., Creasy D. M., Cottrell J. S. (1999) Probability-based protein identification by searching sequence databases using mass spectrometry data. Electrophoresis 20, 3551–3567 [DOI] [PubMed] [Google Scholar]
- 18. Elias J. E., Gygi S. P. (2010) Target-decoy search strategy for mass spectrometry-based proteomics. Methods Mol. Biol. 604, 55–71 [DOI] [PMC free article] [PubMed] [Google Scholar]
- 19. Beausoleil S. A., Villen J., Gerber S. A., Rush J., Gygi S. P. (2006) A probability-based approach for high-throughput protein phosphorylation analysis and site localization. Nat. Biotechnol. 24, 1285–1292 [DOI] [PubMed] [Google Scholar]
- 20. Festuccia W. T., Blanchard P. G., Richard D., Deshaies Y. (2010) Basal adrenergic tone is required for maximal stimulation of rat brown adipose tissue ucp1 expression by chronic ppar-gamma activation. Am. J. Physiol. Regul. Integr. Comp. Physiol. 299, R159–R167 [DOI] [PubMed] [Google Scholar]
- 21. Mihaylova M. M., Vasquez D. S., Ravnskjaer K., Denechaud P. D., Yu R. T., Alvarez J. G., Downes M., Evans R. M., Montminy M., Shaw R. J. (2011) Class iia histone deacetylases are hormone-activated regulators of foxo and mammalian glucose homeostasis. Cell 145, 607–621 [DOI] [PMC free article] [PubMed] [Google Scholar]
- 22. Lee J., Sun C., Zhou Y., Gokalp D., Herrema H., Park S. W., Davis R. J., Ozcan U. (2011) P38 mapk-mediated regulation of xbp1s is crucial for glucose homeostasis. Nat. Med. 17, 1251–1260 [DOI] [PMC free article] [PubMed] [Google Scholar]
- 23. Zhang Y., Xu P., Park K., Choi Y., Moore D. D., Wang L. (2008) Orphan receptor small heterodimer partner suppresses tumorigenesis by modulating cyclin d1 expression and cellular proliferation. Hepatology 48, 289–298 [DOI] [PMC free article] [PubMed] [Google Scholar]
- 24. Wolfrum C., Asilmaz E., Luca E., Friedman J. M., Stoffel M. (2004) Foxa2 regulates lipid metabolism and ketogenesis in the liver during fasting and in diabetes. Nature 432, 1027–1032 [DOI] [PubMed] [Google Scholar]
- 25. Haeusler R. A., Kaestner K. H., Accili D. (2010) Foxos function synergistically to promote glucose production. J. Biol. Chem. 285, 35245–35248 [DOI] [PMC free article] [PubMed] [Google Scholar]
- 26. Duvel K., Yecies J. L., Menon S., Raman P., Lipovsky A. I., Souza A. L., Triantafellow E., Ma Q., Gorski R., Cleaver S., Vander Heiden M. G., MacKeigan J. P., Finan P. M., Clish C. B., Murphy L. O., Manning B. D. (2010) Activation of a metabolic gene regulatory network downstream of mtor complex 1. Mol. Cell 39, 171–183 [DOI] [PMC free article] [PubMed] [Google Scholar]
- 27. Steinbaugh M. J., Sun L. Y., Bartke A., Miller R. A. (2012) Activation of genes involved in xenobiotic metabolism is a shared signature of mouse models with extended lifespan. Am. J. Physiol. Endocrinol. Metab. 303, E488–E495 [DOI] [PMC free article] [PubMed] [Google Scholar]
- 28. Laplante M., Festuccia W. T., Soucy G., Gelinas Y., Lalonde J., Berger J. P., Deshaies Y. (2006) Mechanisms of the depot specificity of peroxisome proliferator-activated receptor gamma action on adipose tissue metabolism. Diabetes 55, 2771–2778 [DOI] [PubMed] [Google Scholar]
- 29. Oh W. J., Jacinto E. (2011) Mtor complex 2 signaling and functions. Cell Cycle 10, 2305–2316 [DOI] [PMC free article] [PubMed] [Google Scholar]
- 30. Hsu P. P., Kang S. A., Rameseder J., Zhang Y., Ottina K. A., Lim D., Peterson T. R., Choi Y., Gray N. S., Yaffe M. B., Marto J. A., Sabatini D. M. (2011) The mtor-regulated phosphoproteome reveals a mechanism of mtorc1-mediated inhibition of growth factor signaling. Science 332, 1317–1322 [DOI] [PMC free article] [PubMed] [Google Scholar]
- 31. Robitaille A. M., Christen S., Shimobayashi M., Cornu M., Fava L. L., Moes S., Prescianotto-Baschong C., Sauer U., Jenoe P., Hall M. N. (2013) Quantitative phosphoproteomics reveal mtorc1 activates de novo pyrimidine synthesis. Science 339, 1320–1323 [DOI] [PubMed] [Google Scholar]
- 32. Ben-Sahra I., Howell J. J., Asara J. M., Manning B. D. (2013) Stimulation of de novo pyrimidine synthesis by growth signaling through mtor and s6k1. Science 339, 1323–1328 [DOI] [PMC free article] [PubMed] [Google Scholar]
- 33. Cuadrado A., Nebreda A. R. (2010) Mechanisms and functions of p38 mapk signalling. Biochem. J. 429, 403–417 [DOI] [PubMed] [Google Scholar]
- 34. Jacinto E., Loewith R., Schmidt A., Lin S., Ruegg M. A., Hall A., Hall M. N. (2004) Mammalian tor complex 2 controls the actin cytoskeleton and is rapamycin insensitive. Nat. Cell Biol. 6, 1122–1128 [DOI] [PubMed] [Google Scholar]
- 35. Thoreen C. C., Kang S. A., Chang J. W., Liu Q., Zhang J., Gao Y., Reichling L. J., Sim T., Sabatini D. M., Gray N. S. (2009) An atp-competitive mammalian target of rapamycin inhibitor reveals rapamycin-resistant functions of mtorc1. J. Biol. Chem. 284, 8023–8032 [DOI] [PMC free article] [PubMed] [Google Scholar]
- 36. Feldman M. E., Apsel B., Uotila A., Loewith R., Knight Z. A., Ruggero D., Shokat K. M. (2009) Active-site inhibitors of mtor target rapamycin-resistant outputs of mtorc1 and mtorc2. PLoS Biol. 7, e38. [DOI] [PMC free article] [PubMed] [Google Scholar]
- 37. Cohen S. E., Kokkotou E., Biddinger S. B., Kondo T., Gebhardt R., Kratzsch J., Mantzoros C. S., Kahn C. R. (2007) High circulating leptin receptors with normal leptin sensitivity in liver-specific insulin receptor knock-out (lirko) mice. J. Biol. Chem. 282, 23672–23678 [DOI] [PubMed] [Google Scholar]
- 38. Hirashima Y., Tsuruzoe K., Kodama S., Igata M., Toyonaga T., Ueki K., Kahn C. R., Araki E. (2003) Insulin down-regulates insulin receptor substrate-2 expression through the phosphatidylinositol 3-kinase/akt pathway. J. Endocrinol. 179, 253–266 [DOI] [PubMed] [Google Scholar]
- 39. Cho K. W., Zhou Y., Sheng L., Rui L. (2011) Lipocalin-13 regulates glucose metabolism by both insulin-dependent and insulin-independent mechanisms. Mol. Cell. Biol. 31, 450–457 [DOI] [PMC free article] [PubMed] [Google Scholar]
- 40. Hu H., Li X. (2007) Transcriptional regulation in eukaryotic ribosomal protein genes. Genomics 90, 421–423 [DOI] [PubMed] [Google Scholar]
- 41. Tonner P., Srinivasasainagendra V., Zhang S., Zhi D. (2012) Detecting transcription of ribosomal protein pseudogenes in diverse human tissues from rna-seq data. BMC Genomics 13, 412. [DOI] [PMC free article] [PubMed] [Google Scholar]
- 42. Gruppuso P. A., Boylan J. M., Sanders J. A. (2011) The physiology and pathophysiology of rapamycin resistance: implications for cancer. Cell Cycle 10, 1050–1058 [DOI] [PMC free article] [PubMed] [Google Scholar]
- 43. Payne V. A., Arden C., Wu C., Lange A. J., Agius L. (2005) Dual role of phosphofructokinase-2/fructose bisphosphatase-2 in regulating the compartmentation and expression of glucokinase in hepatocytes. Diabetes 54, 1949–1957 [DOI] [PubMed] [Google Scholar]
- 44. Kurland I. J., el-Maghrabi M. R., Correia J. J., Pilkis S. J. (1992) Rat liver 6-phosphofructo-2-kinase/fructose-2,6-bisphosphatase: properties of phospho- and dephospho- forms and of two mutants in which ser32 has been changed by site-directed mutagenesis. J. Biol. Chem. 267, 4416–4423 [PubMed] [Google Scholar]
- 45. Skurat A. V., Roach P. J. (1995) Phosphorylation of sites 3a and 3b (ser640 and ser644) in the control of rabbit muscle glycogen synthase. J. Biol. Chem. 270, 12491–12497 [DOI] [PubMed] [Google Scholar]
- 46. Chun J., Kwon T., Kim D. J., Park I., Chung G., Lee E. J., Hong S. K., Chang S. I., Kim H. Y., Kang S. S. (2003) Inhibition of mitogen-activated kinase kinase kinase 3 activity through phosphorylation by the serum- and glucocorticoid-induced kinase 1. J. Biochem. 133, 103–108 [DOI] [PubMed] [Google Scholar]
- 47. Asada S., Daitoku H., Matsuzaki H., Saito T., Sudo T., Mukai H., Iwashita S., Kako K., Kishi T., Kasuya Y., Fukamizu A. (2007) Mitogen-activated protein kinases, erk and p38, phosphorylate and regulate foxo1. Cell. Signal. 19, 519–527 [DOI] [PubMed] [Google Scholar]
- 48. Clavel S., Siffroi-Fernandez S., Coldefy A. S., Boulukos K., Pisani D. F., Derijard B. (2010) Regulation of the intracellular localization of foxo3a by stress-activated protein kinase signaling pathways in skeletal muscle cells. Mol. Cell. Biol. 30, 470–480 [DOI] [PMC free article] [PubMed] [Google Scholar]
- 49. Willems L., Chapuis N., Puissant A., Maciel T. T., Green A. S., Jacque N., Vignon C., Park S., Guichard S., Herault O., Fricot A., Hermine O., Moura I. C., Auberger P., Ifrah N., Dreyfus F., Bonnet D., Lacombe C., Mayeux P., Bouscary D., Tamburini J. (2012) The dual mtorc1 and mtorc2 inhibitor azd8055 has anti-tumor activity in acute myeloid leukemia. Leukemia 26, 1195–1202 [DOI] [PubMed] [Google Scholar]
- 50. Giubellino A., Bullova P., Nolting S., Turkova H., Powers J. F., Liu Q., Guichard S., Tischler A. S., Grossman A. B., Pacak K. (2013) Combined inhibition of mtorc1 and mtorc2 signaling pathways is a promising therapeutic option in inhibiting pheochromocytoma tumor growth: in vitro and in vivo studies in female athymic nude mice. Endocrinology 154, 646–655 [DOI] [PMC free article] [PubMed] [Google Scholar]
- 51. Zhou H. Y., Huang S. L. (2012) Current development of the second generation of mtor inhibitors as anticancer agents. Chin. J. Cancer 31, 8–18 [DOI] [PMC free article] [PubMed] [Google Scholar]
Associated Data
This section collects any data citations, data availability statements, or supplementary materials included in this article.