Abstract
A modeling framework relating exposure, biomarkers (vascular endothelial growth factor (VEGF), soluble vascular endothelial growth factor receptor (sVEGFR)-2, -3, soluble stem cell factor receptor (sKIT)), and tumor growth to overall survival (OS) was extended to include adverse effects (myelosuppression, hypertension, fatigue, and hand–foot syndrome (HFS)). Longitudinal pharmacokinetic–pharmacodynamic models of sunitinib were developed based on data from 303 patients with gastrointestinal stromal tumor. Myelosuppression was characterized by a semiphysiological model and hypertension with an indirect response model. Proportional odds models with a first-order Markov model described the incidence and severity of fatigue and HFS. Relative change in sVEGFR-3 was the most effective predictor of the occurrence and severity of myelosuppression, fatigue, and HFS. Hypertension was correlated best with sunitinib exposure. Baseline tumor size, time courses of neutropenia, and relative increase of diastolic blood pressure were identified as predictors of OS. The framework has potential to be used for early monitoring of adverse effects and clinical response, thereby facilitating dose individualization to maximize OS.
A challenge of pharmacological interventions for the treatment of cancer is to provide the most effective drug at the most efficient dosing regimen to increase the probability of successful outcomes. If objective (and early) prognostic measures of the pharmacodynamic activity for a given anticancer drug can be established, identification of the patients most likely to respond to treatment, in addition to patients with a higher risk of experiencing adverse effects, can be envisioned.
Tyrosine kinase inhibitors comprise a group of anticancer drugs where effectiveness may be improved through use of a biomarker-guided dose individualization approach. Currently, these drugs are typically dosed as a fixed regimen (dose amount and frequency) across all patients despite the high between-patient variability in pharmacokinetics (PK). Such regimens increase the potential for suboptimal exposures being achieved in particular patients.1
Sunitinib malate (SUTENT, Pfizer) is an oral, small-molecule, multitargeted tyrosine kinase inhibitor currently approved in, e.g., the United States and Europe for the treatment of metastatic renal cell carcinoma, imatinib-resistant gastrointestinal stromal tumor (GIST), and pancreatic neuroendocrine tumor.
In a companion article, we present an overarching modeling framework that links drug exposure, soluble biomarkers, tumor growth dynamics, and overall survival (OS) with the aim of identifying robust predictors of clinical response.2 A soluble form of the vascular endothelial growth factor (VEGF) receptor, soluble vascular endothelial growth factor receptor (sVEGFR)-3, was identified as the most effective predictor of OS in sunitinib-treated GIST patients. sVEGFR-3 was found to be a more effective predictor of OS than the relative change in tumor size at week 7, which was previously proposed for other cytotoxic treatments.3 An additional question to address was whether sVEGFR-3 or any of the other previously investigated candidate biomarkers (VEGF, sVEGFR-2, or sKIT) were predictive of adverse effects, which could assist in determining an individualized dose. Additionally, the adverse effects themselves may be “useful” alternative early indicators of pharmacodynamic activity as they could be more practical to use in the clinical setting. Hypertension is a commonly observed adverse effect for VEGF(R) inhibitors4 and has been reported as a biomarker of treatment efficacy in metastatic renal cell carcinoma patients treated with sunitinib.5,6 A positive correlation has also been identified between the severity of neutropenia and both time to progression and OS7 in sunitinib-treated GIST.
Relationships between drug exposure, candidate biomarkers (VEGF, sVEGFR-2, sVEGFR-3, and sKIT), and the sunitinib-related adverse effects—fatigue, hand–foot syndrome (HFS), neutropenia, and hypertension—were assessed in sunitinib-treated GIST using nonlinear mixed-effects pharmacokinetic–pharmacodynamic modeling. Adverse events were also evaluated as potential predictors of OS.
Results
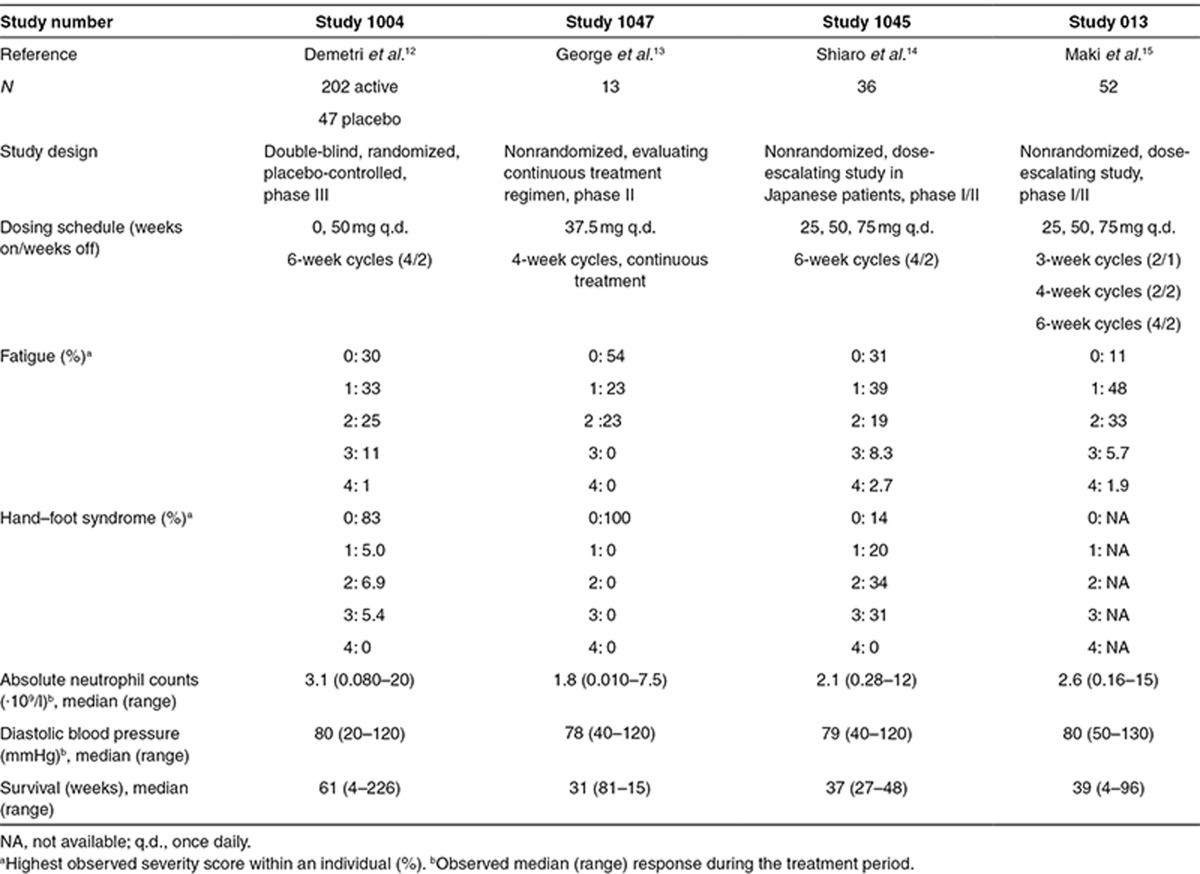
The analysis included data pooled from four clinical trials8,9,10,11 in phases I–III, which comprised 303 patients with imatinib-resistant malignant GIST treated with sunitinib and/or placebo (Table 1). Available data were biomarker candidates (VEGF, sVEGFR-2, sVEGFR-3, and sKIT), OS, and the most commonly reported treatment-related adverse effects, fatigue, HFS, neutropenia, and hypertension (diastolic blood pressure, dBP).
Table 1. Data summary of the analyzed studies.
Longitudinal information on dose, sunitinib daily area under the concentration–time curve (AUC), and biomarkers were evaluated as predictors for adverse effects. The time courses of the biomarker [BM(t)] concentrations were characterized by indirect response models, as described in the study by Hansson et al.2 The predicted value of the different biomarkers for adverse effects was assessed by investigating how descriptive measures of the individual model–predicted biomarker time courses were, alone or in addition to drug exposure. The model-predicted baselines (BM0), absolute and relative change from baseline (BMREL), or the complete biomarker time courses were evaluated as predictors.
Myelosuppression model
A semiphysiological myelosuppression model12 using Box–Cox-transformed data adequately described the extent and time course of the change in absolute neutrophil count (ANC) following sunitinib treatment. A more pronounced reduction in ANC was observed during the first treatment cycle, with partial recovery to baseline levels during the subsequent off-treatment period. A smaller decline in ANC was subsequently observed during the second treatment cycle and thereafter. Placebo-treated patients did not show any systematic alterations in ANC levels.
All of the investigated biomarkers were statistically significantly correlated with the changes in ANC levels when assessed at a fixed time point (landmark). However, the longitudinal model–predicted relative change in sVEGFR-3 from baseline (sVEGFR-3REL) was the better descriptor of the myelosuppression time course (change in the objective function value, ΔOFV = 170.8, compared with AUC). No further improvement in the description of the data was observed when any of the other biomarkers or sunitinib AUC was added to the univariate model.
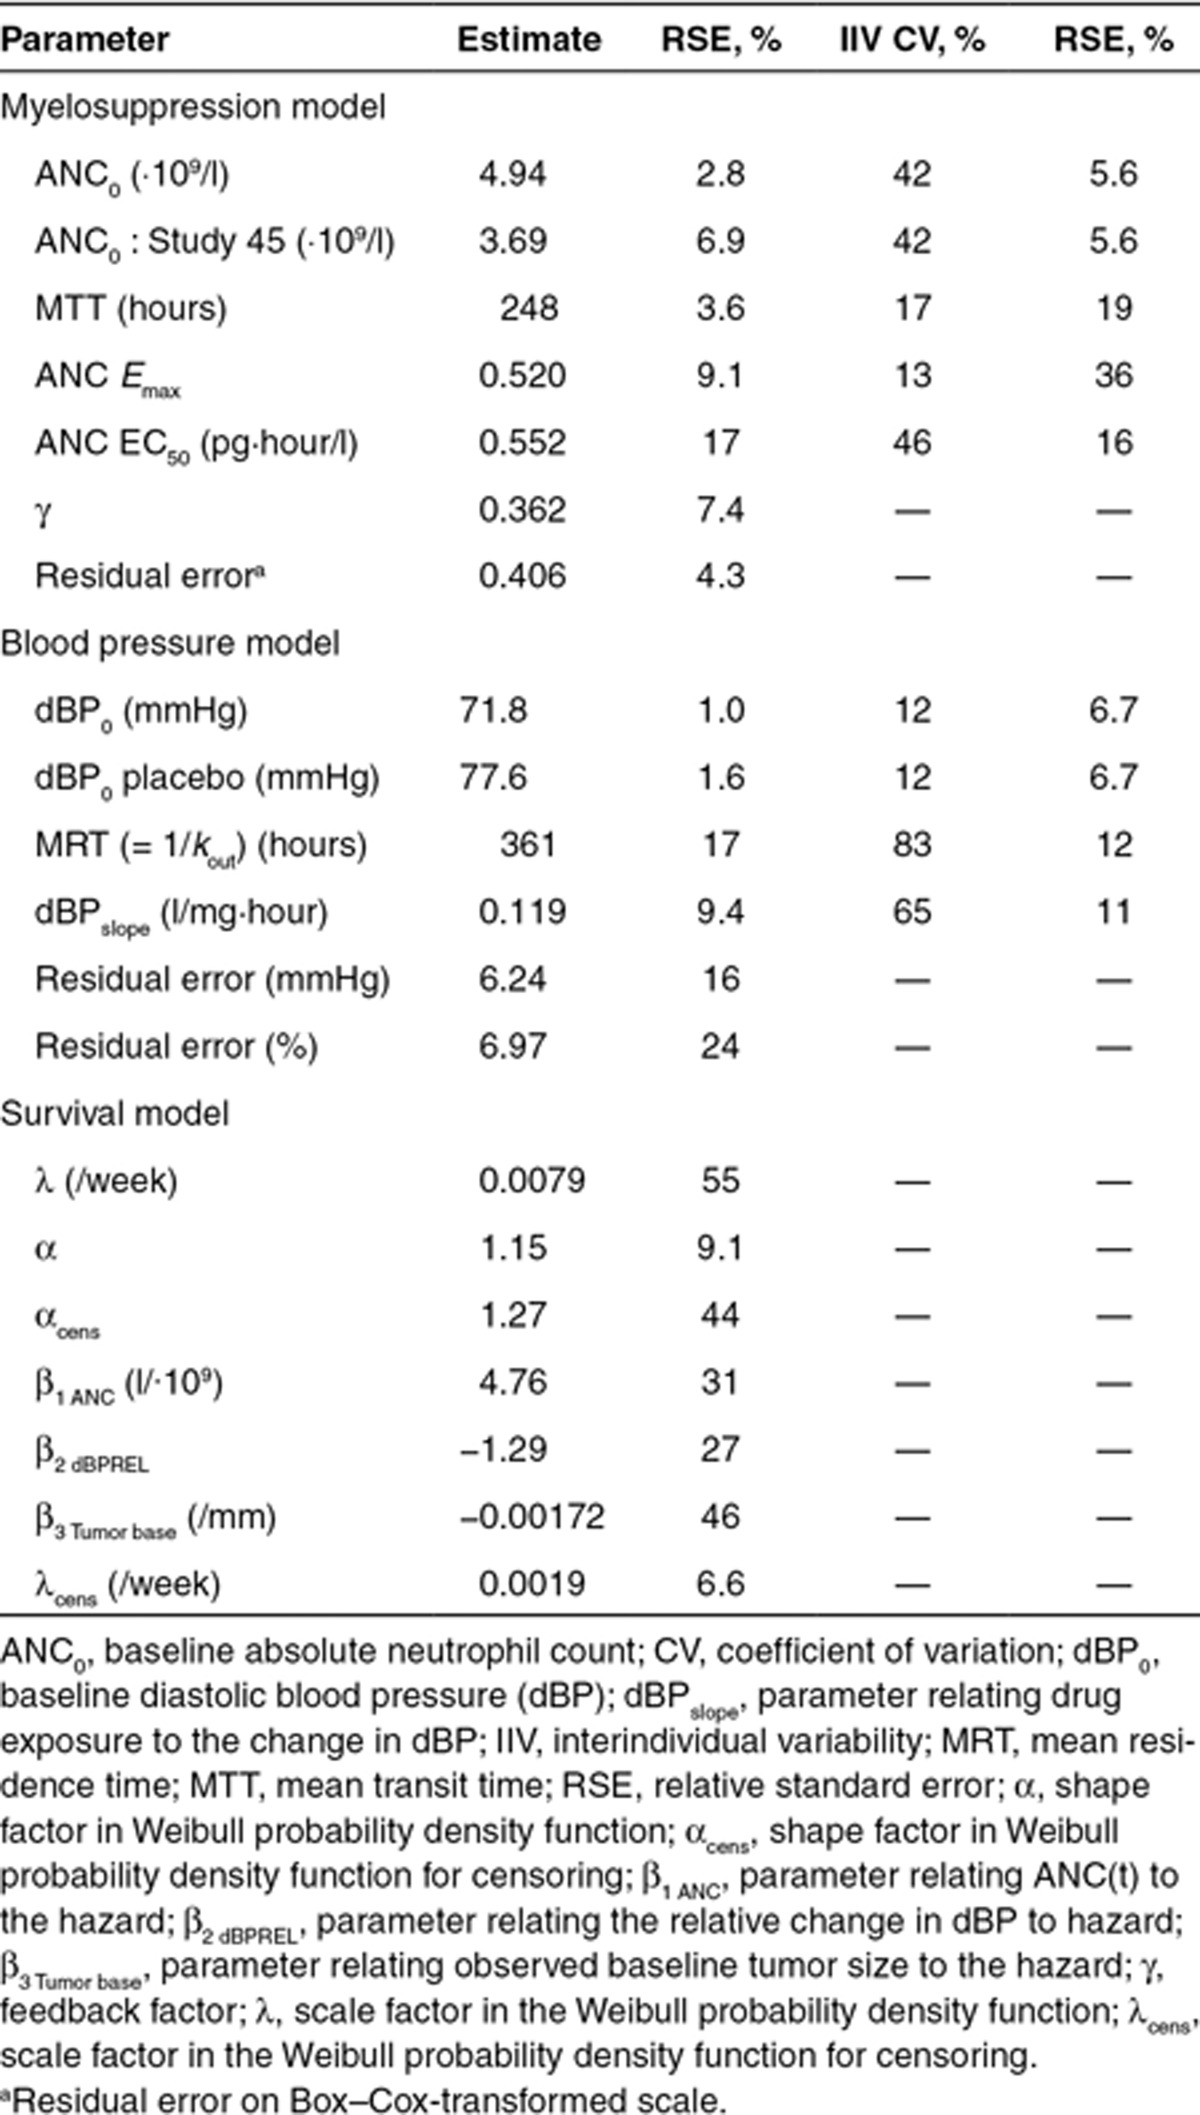
An Emax function most appropriately characterized the biomarker–ANC relationship. A separate baseline parameter (ANC0) was estimated to account for lower ANC levels in Study 45, which was conducted in Japanese patients. The final model included interindividual variability in ANC0, mean transit time (MTT) through the nonsensitive compartments, Emax and EC50 (Table 2), with a correlation between ANC0 and Emax of 90%. For a typical patient receiving a daily 50-mg sunitinib dose (4/2 schedule) and an ANC0 of 4.94 (·109/l), the model predicted a 62% decrease in ANC corresponding to a nadir of 1.9 (·109/l).
Table 2. Final model parameter estimates (relative SE, %).
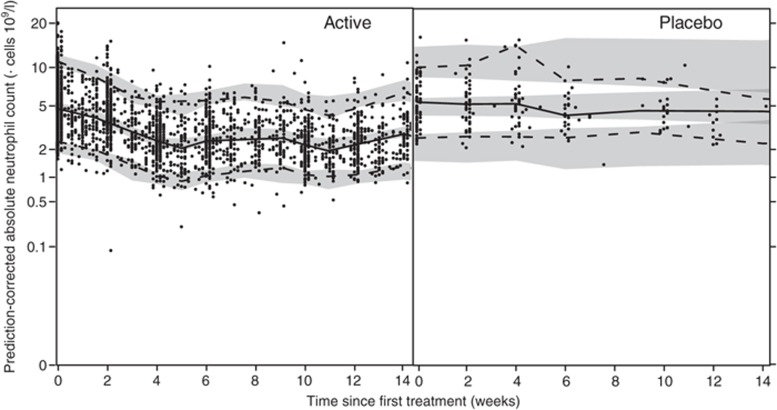
The predictive performance of the final myelosuppression model, as illustrated by a prediction-corrected visual predictive check (VPC; Figure 1), shows a good description of the ANC data.
Figure 1.
Prediction-corrected visual predictive checks of the final semimechanistic myelosuppression model for sunitinib-treated (left) and placebo-treated (right) patients using soluble vascular endothelial growth factor receptor (sVEGFR)-3REL as descriptor. Solid circles (•) represent observed absolute neutrophil counts, solid lines (—) represent the median of the observed data, and dashed lines (---) represent the 5th and 95th percentiles of the observed data. Shaded areas are the 95% confidence intervals based on the simulated data (n = 500) for the corresponding percentiles.
Blood pressure model
An indirect response model with stimulation of the production rate (Kin), as proposed by Keizer et al. for another antiangiogenic drug,13 described the observed elevated dBP during sunitinib treatment periods and the return to near baseline during off-treatment periods (Eq. 1). No increase in dBP could be identified for placebo patients. However, this group had a significantly higher baseline dBP (dBP0) when estimated separately.
 |
 |
Sunitinib AUC was linked to the production rate (Kin) by a linear slope factor (dBPDrug effect). None of the evaluated biomarkers were found to be significantly related to the dBP time course. Interindividual variability was estimated for dBP0, the mean residence time MRT (=1/kout), and dBPDrug effect, and a combined additive and proportional residual error model was used. A correlation between dBP0 and dBPDrug effect (65%) was estimated. The final model predicted a drug-induced increase in dBP by 10 mmHg for the typical patient with a baseline dBP of 71.8 mmHg treated with 50 mg sunitinib receiving a 4/2 schedule.
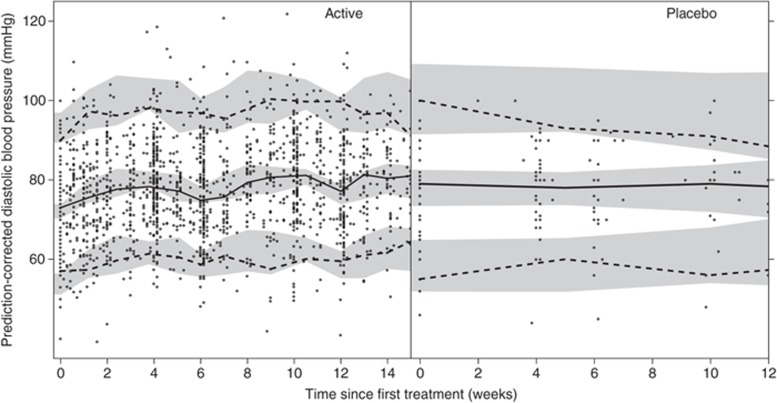
The relative standard errors (RSEs, %) for the estimated parameters were low to intermediate, showing an adequate precision in the estimates (Tables 2). The prediction-corrected VPC shows a good predictive performance of the final blood pressure model (Figure 2).
Figure 2.
Illustration of the predictive performance of the final blood pressure model for sunitinib-treated (left) and placebo-treated (right) patients by prediction-corrected visual predictive checks. Solid circles (•) represent observed diastolic blood pressure, solid lines (—) correspond to the median of the observed blood pressure data, and dashed lines(---) correspond to the 5th and 95th percentiles of the observed data. The shaded areas are the 95% confidence intervals based on the simulated data (n = 500) for the corresponding percentiles.
Fatigue and HFS models
The data were treated as ordered categorical (grades 0, 1, 2, ≥ 3), and an extension of the proportional odds model was used to describe the probability and severity of fatigue and HFS over time.14,15 The extension included a first-order Markov model to condition the probability of transition between different severities based on the preceding one, thereby accounting for that the severity of the adverse effects is not independent from one time point to another. Logit transformations were used to constrain the estimated probabilities to values between 0 and 1, and the function describing the probability of transition from grade a to grade b for the ith patient at the jth observation was given the structure shown in Eq. 2.
 |
 |
where fb|a is a function of baseline transition probabilities (Bb|a), and g(xi) is a linear function on the logit scale relating explanatory factors, such as time, drug exposure (dose and AUC), and absolute/relative changes in biomarker concentrations over time, to the probability of developing fatigue and HFS. The interindividual random effect for patient i (ηi) was assumed to be normally distributed with a mean of zero and a variance of ω2.
All of the biomarkers were significantly related to the probability and severity of fatigue and HFS. However, the relative change over time for sVEGFR-3 (sVEGFR-3REL) showed the most profound relationship (ΔOFV = −103 for fatigue, ΔOFV = −159 for HFS, compared with AUC), and no further improvement in the description of the data was observed when AUC or the other biomarkers were also incorporated. No significant trend over time was identified. Increasing sVEGFR-3REL, i.e., a more pronounced reduction in sVEGFR-3, was associated with increased probability and severity of fatigue and HFS. Incorporation of an effect compartment into the model [ke0 = 0.424/hour (fatigue) and 0.347/hour (HFS)] significantly improved both the fatigue and HFS models (Table 3).
Table 3. Time course for the probability and severity of HFS and fatigue.
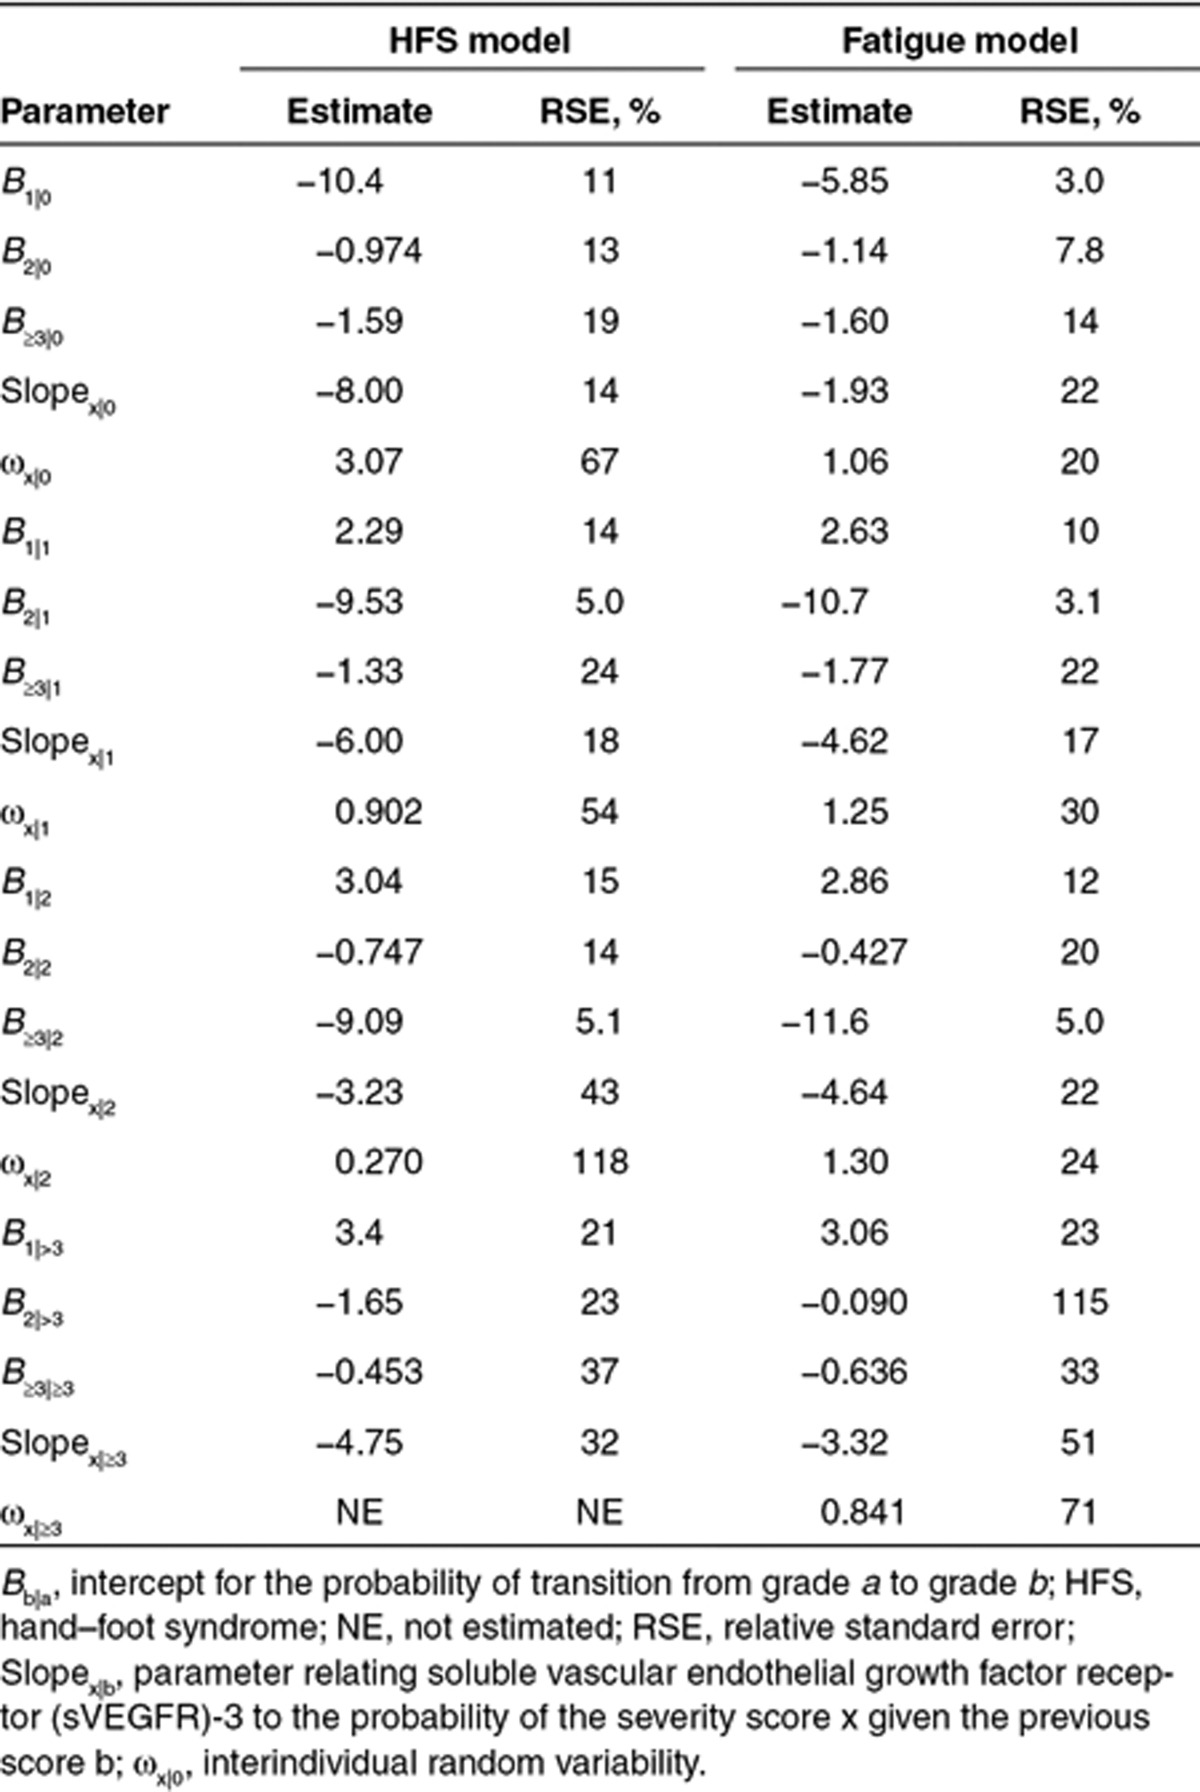
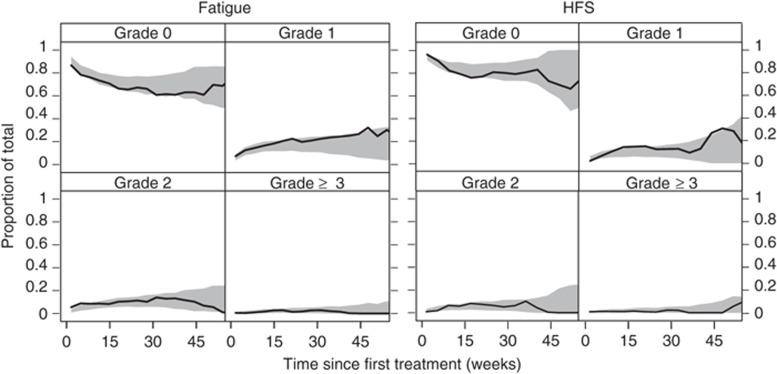
The parameters were estimated with acceptable precision and are reported on the logit scale in Table 3. The simulation-based model evaluation described well the time course for the probability and severity of fatigue and HFS (Table 3, Figure 3). Furthermore, the simulated numbers of transitions between different severity grades were consistent with the observed values (results not shown).
Figure 3.
Visual predictive check of the final model for the time course of the probability and severity of fatigue (left) and hand–foot syndrome (HFS) (right) for actively treated patients stratified by severity grade. The solid lines (—) represent the observed time course of each severity grade, and the shaded areas are the 95% confidence intervals generated from simulations.
OS model
A Weibull model described the underlying baseline hazard for the observed survival data (λ hazard coefficient, α shape factor; Eq. 3, Table 2). The time course of neutropenia [ANC(t)] was the most significant predictor of OS (ΔOFV = −42.6). Additionally, dBPREL(t) was significantly related to OS (ΔOFV = −25.4), whereas fatigue and HFS were not related. A more pronounced decrease in ANC over time and/or a larger relative increase in dBP decreased the hazard risk of death.
To be able to compare our model with the previously reported survival model from that in our companion article,2 which included sVEGFR-3REL and tumor size at start of treatment as predictors, these two predictors were also included and reevaluated for significance, in addition to the presence of the adverse events. The model including ANC and dBP resulted in a similar OFV as sVEGFR-3REL and could thereby be an alternative to the model developed earlier.2 A summary table of differences in OFV for the significant predictors is provided in Supplementary Table S1 online. The final model using adverse effects as predictors was parameterized as in Eq. 3.
 |
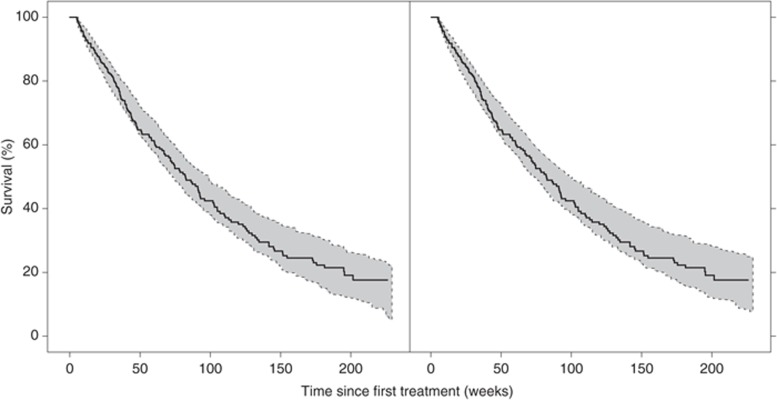
The predictive properties of the survival model are adequate as shown in the VPC (Figure 4). The Kaplan–Meier plot of the observed survival data is well within the 95% confidence interval calculated from simulations of 200 data sets. The median number of simulated events (n = 151, range: 126–176) was in accordance with the number of observed events (n = 163).
Figure 4.
Kaplan–Meier plot of the observed survival data (solid line) and the 95% confidence interval (shaded area) based on the simulated data (n = 200) for the final survival model (left). A Weibull model (λ = 0.0019, α = 1.3) was applied in the simulations to describe censoring. The right panel illustrates the predictive properties of the model when only using data from the first 6 weeks of treatment.
Evaluation of how well the model can predict survival using the model-predicted time course of ANC and dBP based on data from only the first treatment cycle (<6 weeks, and an average of five (ANC) and four (dBP) measurements), compared with the use of all data, resulted in a similar model fit (ΔOFV = 9.5). This indicated that a small number of ANCs and blood pressure measurements may be needed during the first treatment cycle to predict survival given the model. The predictive properties of the model when using data from only the first treatment course are illustrated by the Kaplan–Meier plot in Figure 4.
Discussion
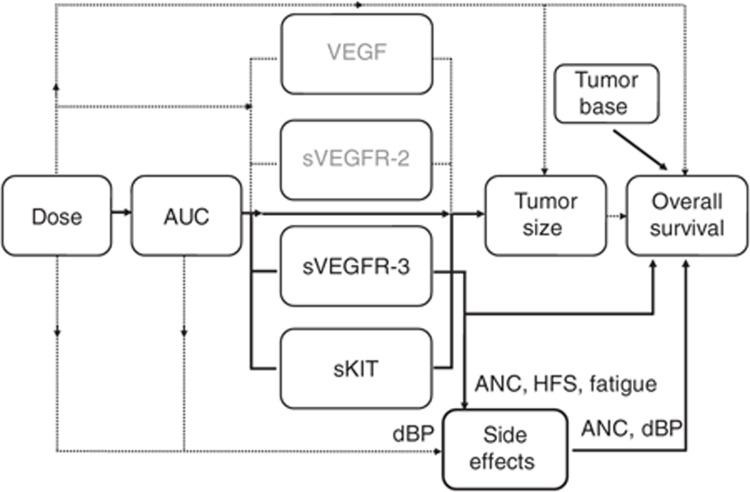
This study described the association between sunitinib exposure, selected biomarkers, myelosuppression, hypertension, fatigue, and HFS through the development of longitudinal pharmacokinetic–pharmacodynamic models, and relationships were added to the modeling framework described for sunitinib in GIST (Figure 5). Predictors of the toxicity dynamics were assessed, and the soluble protein sVEGFR-3 was identified as being most predictive of neutropenia, fatigue, and HFS. The link between the longitudinal adverse effects data and OS indicated that dBP, myelosuppression, and baseline tumor size were most predictive. The relationship between AUC and adverse effects has previously partially been characterized in this population without considering the time aspect.16 In this study, the complete time course of the adverse effects were characterized to evaluate the relationships.17
Figure 5.
Relationships evaluated in the framework for sunitinib in gastrointestinal stromal tumor. Solid lines indicate relationships included in the final models, and dashed lines indicate relationships investigated but not included in the final models. In contrast to the other adverse effects investigated, blood pressure was, however, better predicted by sunitinib daily area under the concentration–time curve (AUC) than soluble vascular endothelial growth factor receptor (sVEGFR)-3. Tumor size before treatment initiation (baseline) was a predictor in the final model of overall survival, whereas the relative change in sVEGFR-3 over time was a better predictor than other evaluated metrics of tumor size after start of treatment.2 The current analysis showed that absolute neutrophil count (ANC) and diastolic blood pressure (dBP) are, in combination, as good predictors of overall survival as is sVEGFR-3. HFS, hand–foot syndrome; sKIT, soluble stem cell factor receptor.
A semimechanistic model12 was successfully applied to describe sunitinib-induced myelosuppression. sVEGFR-3 was statistically the best predictor of the neutropenic time course. All of the investigated biomarkers were, however, significantly related to the time course of myelosuppression when evaluated one by one, reflecting the inhibitory effect of sunitinib on KIT (stem cell factor receptor) and the role of VEGF in myelopoiesis.4 These biomarkers may also have provided more longitudinal information on drug exposure because they were monitored for a longer period than drug concentrations. A longer MTT in the myelosuppression model (248 hours) was estimated for sunitinib than that typically reported for traditional intravenously administered cytotoxic drugs in short treatment schedules.23,31 Van Kesteren et al. reported on longer MTT for prolonged schedules, which may be the result of a decreased effect of the endogenous growth factors following longer periods of low number of circulating cells.18
The elevated dBP as a result of sunitinib treatment was described by an indirect response model with a linear relationship between AUC and the increased production rate (Kin). The mechanism mediating the elevated blood pressure in antiangiogenic treatment is not clear. One hypothesis is that decreased production of nitric oxide and vascular rarefaction due to VEGF blockade induces vasoconstriction and hypertension.4 The developed model has no direct mechanistic link between exposure and appearance of hypertension, which limits extrapolation outside the range of dosing schedules studied. A contrasting result to the other investigated adverse effects was that none of the evaluated biomarkers were significantly related to the model-predicted time course of dBP.
The developed first-order mixed-effects Markov models characterized the dynamics of longitudinal fatigue and HFS data. The model provides an alternative approach to traditional analysis of toxicity data, which often only reports the highest severity during the study for a patient and thereby discards the evolution of toxicity over time. An increased sunitinib exposure or sVEGFR-3 response was related to a higher risk and severity of adverse effects. The proposed models with sVEGFR-3 as a descriptor are empirical and provide limited contribution to the understanding of the mechanism for development of HFS and fatigue but could be of prognostic value.
The relative change in sVEGFR-3 over time is predictive of OS (ref 2) and the adverse event dynamics for myelosuppression, fatigue, and HFS. Therefore, monitoring sVEGFR-3 has the potential to identify the patients at highest risk of toxicity and to enhance dose optimization. Efficient dose individualization could minimize the occurrence of severe adverse events and improve the treatment efficacy. A maintained dose intensity is of importance because higher exposures have been shown to be associated with longer OS and time to progression in a previously reported exposure–response analysis.16
The relative change in dBP, myelosuppression time course, and tumor size at start of treatment were predictive of OS. The model predicted that patients with a greater relative change in blood pressure and ANC, together with a smaller tumor size at baseline, displayed the longest OS. Cutoff values of blood pressure and neutropenia have previously been identified as predictors in sunitinib treatment using traditional statistical analysis. ANC < 1.5 × 10⁹/l or dBP > 90 mmHg at any time during treatment were associated with longer OS.5,6,7
ANC and dBP measurements from the first treatment cycle can predict OS. The developed survival model may guide intrapatient dose escalation based on dBP and neutropenia and explore the effectiveness of alternate dosing strategies. The potential impact on the augmented incidence and severity of HFS and fatigue due to the increased dose adjustments can be considered. A future simulation study will evaluate a dose individualization approach to ultimately optimize the use of sunitinib in GIST. These factors will require confirmation in larger prospective trials. In conclusion, this analysis proposed the relative change in sVEGFR-3 over time as a predictor of the occurrence and severity of myelosuppression, fatigue, and HFS following sunitinib treatment. Furthermore, sunitinib-induced hypertension and neutropenia were identified as predictors of OS in GIST. The developed framework, including adverse effects as biomarkers, has a potential to be used for early monitoring of response, thereby facilitating effective dose individualization.
Methods
Patients and study design. The analyzed data were from four clinical trials8,9,10,11 in phases I–III, which comprised patients with imatinib-resistant malignant GIST treated with sunitinib. Only patients with biomarker and survival data reported were included in the analysis, totaling 303 patients. Sunitinib was administered in one of four different treatment schedules, including the 4/2, 2/2, and 2/1 (weeks on/weeks off) schedule, and continuous treatment, with doses ranging from 0 to 75 mg orally once daily (Table 1). Patients randomized to receive placebo treatment (n = 47) in the placebo-controlled trial (study 1004) were offered sunitinib on disease progression as defined by the Response Evaluation Criteria in Solid Tumors (RECIST).19 The studies were approved by local ethics committees and were performed in accordance with the Declaration of Helsinki. Written informed consent was obtained from all patients.
Data analysis. This population PK/PD analysis was performed sequentially using the nonlinear mixed-effects modeling approach. The first-order conditional estimation method with interaction (FOCEI) and the Laplacian estimation method implemented in the software NONMEM (version 7.2, gFortran version 4.5.0, Gnu compiler collection; Supplementary Data) were used for parameter estimation. The R-based software Xpose (version 4)20 was used for model diagnostics and graphical visualization of the results, and the PsN toolkit (version 3)21,22 was used for the postprocessing of results.
Model selection was based on assessment of graphical diagnostics and comparison of the OFV, provided by NONMEM, in the log-likelihood ratio test. The difference in OFV for two nested models is proportional to minus twice the log likelihood of the data and is approximately χ2 distributed. A significance level of P < 0.01 was used in this analysis, which corresponds to a decrease in OFV of at least 6.63 for the addition of one extra parameter. Evaluation of model robustness was based on relative standard errors (RSEs, %) of the model parameter estimates determined by nonparametric bootstrapping (n = 200). Prediction-corrected VPCs23 were also assessed to judge the predictive performance of the developed models.
Pharmacokinetics. Dose or daily area under the concentration–time curve (AUC) calculated as Dose/(CL/F), with AUC = 0 during off-treatment periods, was used as the exposure measure for sunitinib (no data for the equipotent metabolite SU1266 were available). Total oral plasma clearance (CL/F) was described by the individual parameter estimates or population values [(when no PK data were available (n = 57)] obtained from a population PK model.24
Biomarker models. The time courses of the biomarkers were characterized by individual parameter estimates obtained from previously developed biomarker models.2 The models described the changes in biomarker concentrations [BM(t)] through indirect response models assuming a decreased production of the zero-order rate constant (Kin) for sVEGFR-2, sVEGFR-3, and sKIT and an inhibited degradation of VEGF (kout). A linear disease progression model characterized the increase of VEGF and sKIT over time. Data on sVEGFR-3 were not available for two of the studies (n = 69), but the high correlation between sVEGFR-2, sVEGFR-3, and VEGF to sVEGFR-3 enabled derivation of information on sVEGFR-3 in individuals with missing data.2
Myelosuppression model. The time course of sunitinib-related changes in ANC was described by a semimechanistic model for myelosuppression.12 The model is composed of a compartment representing drug-sensitive proliferating progenitor cells in the bone marrow, a compartment of systemic circulating neutrophils, and a link between them through three transit compartments reflecting cell maturation. The model also includes a feedback function mimicking the effect of endogenous growth factors, e.g., granulocyte colony stimulating factor (G-CSF), which increases the proliferation rate when neutrophil levels in the blood are low. The half-life of circulating neutrophils in blood was fixed to the literature value of 7 hours25 to enhance the physiological interpretation of the model. Estimated system-specific parameters were ANC0, MTT, and the feedback factor (γ). Furthermore, the drug effect—which is assumed to act by reducing the proliferation rate and inducing cell loss—was estimated. Herein, linear, Emax, and sigmoid Emax models were evaluated to link drug exposure (dose and AUC) and biomarkers (baseline, absolute, and relative change) to cell death.
Modeling was performed on Box–Cox-transformed neutrophil data (ANCtransformed = (ANCλ − 1)/λ), with λ = 0.2, as this previously has been shown to result in approximately normally distributed residuals.26,27 Interindividual variability was assumed to be log-normally distributed with a mean of zero and a variance of ω2 and was evaluated for ANC0, MTT, and the drug effect parameters. Residual variability was described by an additive (on Box–Cox scale) error model. The predictive performance of the myelosuppression model was evaluated by prediction-corrected VPCs (500 simulations).23
Blood pressure model. The sunitinib-induced hypertension was reported in terms of increase in dBP. The actual times of the day for blood pressure measurements were not available and were therefore assumed to occur in the morning for all observations. The increase in dBP following sunitinib treatment was described using (i) an indirect response model with stimulation of Kin or (ii) the alternative model with inhibition of kout. dBP0 and kout (reported as MRT = 1/kout) were estimated, and Kin was derived as dBP0 × kout. Linear, Emax, and sigmoid Emax drug effect relationships to sunitinib exposure (dose and AUC) and biomarkers (baseline, absolute, and relative changes over time) were evaluated. Interindividual variability was assumed to be log-normally distributed with a mean of zero and a variance of ω2. Additive, proportional, or combined additive and proportional residual error models were evaluated.
The predictive properties of the final blood pressure model was evaluated using prediction-corrected VPCs (n = 500).23
Fatigue and HFS model. Fatigue and HFS were assessed daily throughout treatment. They were reported according to the National Cancer Institute common toxicity criteria (version 3.0) as different grades, where grade 0 corresponds to no adverse event and grade 4 refers to a life-threatening event. However, grade 4 was only reported in a few patients (for fatigue: 1%; and for HFS: 0%), and these occurrences were consequently grouped with grade 3 into a single category.
Models for ordered categorical data (grades 0, 1, 2, and ≥ 3) with a first-order Markov model were applied. Transitions between all the different severity grades were considered in the analysis, totaling 16 different possible transitions. The sum of the associated probabilities for each grade (Px|0, Px|1, Px|2, and Px|≥3) is one, and therefore three probabilities for each grade were directly estimated and the fourth probability (P0|0, P1|0, P2|0, and P3|0) was expressed as one minus the sum of the associated probabilities. Linear and nonlinear models for the explanatory factors were assessed, and the addition of an effect compartment to account for a delay in the drug effect was tested.28
The fatigue and HFS models were evaluated by categorical VPCs, where 95% confidence intervals were generated from 500 simulations and overlaid with the observed time course of fatigue and HFS stratified by severity. In addition, predictive checks were created by comparing the simulated and observed numbers of transitions between different toxicity grades.
OS model. A parametric survival (time-to-event) model was developed to evaluate whether any of the studied treatment-related adverse effects were predictive of OS. The underlying distribution of the observed survival data was evaluated by exponential, Weibull, log-logistic, extreme value, and Gompertz probability density functions. The individual predicted time courses, using AUC as predictor, for neutropenia and hypertension were extrapolated based on the developed models assuming dosing and schedule according to protocol until time of censoring/death. For neutropenia and hypertension baseline levels, absolute time course and absolute and relative change from baseline over time were evaluated as predictors of OS. For fatigue and HFS, the observed severity scores (last observation carried forward) were evaluated as predictors of OS by including each observed score as a predictor. To be able to compare our model with the previously reported survival model, which included sVEGFR-3REL and tumor size at start of treatment as predictors,2 these two predictors were also included and reevaluated for significance, in addition to the presence of the adverse events.
The predictive properties of the survival model were assessed by Kaplan–Meier plots of the observed survival data compared with a 95% confidence interval generated from simulations of 200 replicates of the data sets. Censoring because of, e.g., a short follow-up period was described by a Weibull model, which was applied in the simulations.
Conflict of interest
G.M., M.A.A., and P.A.M. are employees of Pfizer Ltd. At the time the work was carried out, G.M. was supported by a research grant from Pfizer Ltd. and J.F. was an employee at Pfizer Ltd. M.O.K. and L.E.F. have acted as paid consultants to Pfizer Ltd. As Deputy Editor-in-Chief of CPT: Pharmacometrics & Systems Pharmacology, L.E.F. was not involved in the review or decision process for this article. E.K.H. declared no conflict of interest.
Author contributions
E.K.H., M.A.A., P.A.M., J.F., L.E.F., and M.O.K. wrote the manuscript. E.K.H., G.M., M.A.A., P.A.M., J.F., L.E.F., and M.O.K. designed the research. E.K.H., G.M., M.A.A., J.F., L.E.F., and M.O.K. performed the research. E.K.H. and G.M. analyzed the data.
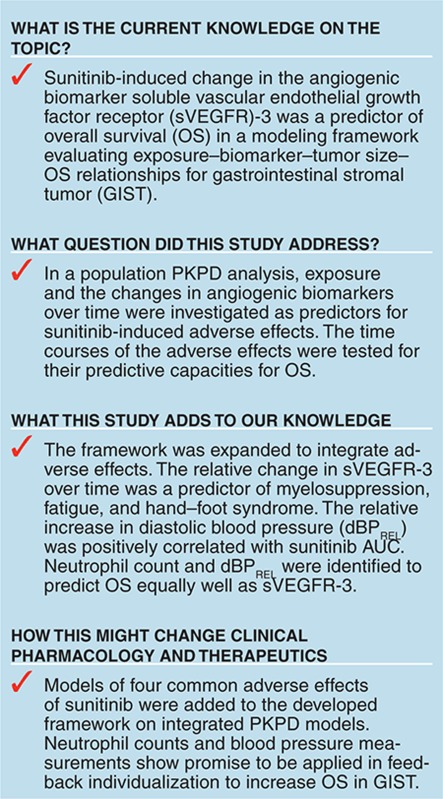
Study Highlights
Acknowledgments
E.K.H. was supported by the Swedish Cancer Society. Parts of the computations were performed on resources provided by the Swedish National Infrastructure for Computing (SNIC) at UPPMAX. Martin Agback at UPPMAX is acknowledged for assistance concerning technical aspects in making NONMEM run on the UPPMAX resources.
Supplementary Material
References
- Klümpen H.J., Samer C.F., Mathijssen R.H., Schellens J.H., Gurney H. Moving towards dose individualization of tyrosine kinase inhibitors. Cancer Treat. Rev. 2011;37:251–260. doi: 10.1016/j.ctrv.2010.08.006. [DOI] [PubMed] [Google Scholar]
- Hansson E.K., et al. PKPD modeling of VEGF, sVEGFR-2, -3 and sKIT as predictors of tumor dynamics and overall survival following sunitinib treatment in GIST. CPT Pharmacometrics Syst. Pharmacol. 2013. [DOI] [PMC free article] [PubMed]
- Claret L., et al. Model-based prediction of phase III overall survival in colorectal cancer on the basis of phase II tumor dynamics. J. Clin. Oncol. 2009;27:4103–4108. doi: 10.1200/JCO.2008.21.0807. [DOI] [PubMed] [Google Scholar]
- Eskens F.A., Verweij J. The clinical toxicity profile of vascular endothelial growth factor (VEGF) and vascular endothelial growth factor receptor (VEGFR) targeting angiogenesis inhibitors; a review. Eur. J. Cancer. 2006;42:3127–3139. doi: 10.1016/j.ejca.2006.09.015. [DOI] [PubMed] [Google Scholar]
- Rini B.I., et al. Hypertension as a biomarker of efficacy in patients with metastatic renal cell carcinoma treated with sunitinib. J. Natl. Cancer Inst. 2011;103:763–773. doi: 10.1093/jnci/djr128. [DOI] [PMC free article] [PubMed] [Google Scholar]
- Rixe O., Billemont B., Izzedine H. Hypertension as a predictive factor of Sunitinib activity. Ann. Oncol. 2007;18:1117. doi: 10.1093/annonc/mdm184. [DOI] [PubMed] [Google Scholar]
- Donskov F., et al. Neutropenia as a biomarker of sunitinib efficacy in patients (Pts) with gastrointestinal stromal tumour (GIST). Eur. J. Cancer. 2011;47:S135. [Google Scholar]
- Demetri G.D., et al. Efficacy and safety of sunitinib in patients with advanced gastrointestinal stromal tumour after failure of imatinib: a randomised controlled trial. Lancet. 2006;368:1329–1338. doi: 10.1016/S0140-6736(06)69446-4. [DOI] [PubMed] [Google Scholar]
- George S., et al. Clinical evaluation of continuous daily dosing of sunitinib malate in patients with advanced gastrointestinal stromal tumour after imatinib failure. Eur. J. Cancer. 2009;45:1959–1968. doi: 10.1016/j.ejca.2009.02.011. [DOI] [PubMed] [Google Scholar]
- Shirao K., et al. Phase I/II study of sunitinib malate in Japanese patients with gastrointestinal stromal tumor after failure of prior treatment with imatinib mesylate. Invest. New Drugs. 2010;28:866–875. doi: 10.1007/s10637-009-9306-9. [DOI] [PubMed] [Google Scholar]
- Maki R.G., et al. Results from a continuation trial of SU11248 in patients (pts) with imatinib (IM)-resistant gastrointestinal stromal tumor (GIST). 41st Annual meeting of the American Society of Clinical Oncology, Orlando, FL, 13–17 May 2005. < http://www.asco.org > ( 2005
- Friberg L.E., Henningsson A., Maas H., Nguyen L., Karlsson M.O. Model of chemotherapy-induced myelosuppression with parameter consistency across drugs. J. Clin. Oncol. 2002;20:4713–4721. doi: 10.1200/JCO.2002.02.140. [DOI] [PubMed] [Google Scholar]
- Keizer R.J., et al. A model of hypertension and proteinuria in cancer patients treated with the anti-angiogenic drug E7080. J. Pharmacokinet. Pharmacodyn. 2010;37:347–363. doi: 10.1007/s10928-010-9164-2. [DOI] [PMC free article] [PubMed] [Google Scholar]
- Hénin E., et al. A dynamic model of hand-and-foot syndrome in patients receiving capecitabine. Clin. Pharmacol. Ther. 2009;85:418–425. doi: 10.1038/clpt.2008.220. [DOI] [PubMed] [Google Scholar]
- Zingmark P.H., Kågedal M., Karlsson M.O. Modelling a spontaneously reported side effect by use of a Markov mixed-effects model. J. Pharmacokinet. Pharmacodyn. 2005;32:261–281. doi: 10.1007/s10928-005-0021-7. [DOI] [PubMed] [Google Scholar]
- Houk B.E., Bello C.L., Poland B., Rosen L.S., Demetri G.D., Motzer R.J. Relationship between exposure to sunitinib and efficacy and tolerability endpoints in patients with cancer: results of a pharmacokinetic/pharmacodynamic meta-analysis. Cancer Chemother. Pharmacol. 2010;66:357–371. doi: 10.1007/s00280-009-1170-y. [DOI] [PubMed] [Google Scholar]
- Ibrahim J.G., Chu H., Chen L.M. Basic concepts and methods for joint models of longitudinal and survival data. J. Clin. Oncol. 2010;28:2796–2801. doi: 10.1200/JCO.2009.25.0654. [DOI] [PMC free article] [PubMed] [Google Scholar]
- van Kesteren C., et al. Semi-physiological model describing the hematological toxicity of the anti-cancer agent indisulam. Invest. New Drugs. 2005;23:225–234. doi: 10.1007/s10637-005-6730-3. [DOI] [PubMed] [Google Scholar]
- Therasse P., et al. New guidelines to evaluate the response to treatment in solid tumors. European Organization for Research and Treatment of Cancer, National Cancer Institute of the United States, National Cancer Institute of Canada. J. Natl. Cancer Inst. 2000;92:205–216. doi: 10.1093/jnci/92.3.205. [DOI] [PubMed] [Google Scholar]
- Jonsson E.N., Karlsson M.O. Xpose–an S-PLUS based population pharmacokinetic/pharmacodynamic model building aid for NONMEM. Comput. Methods Programs Biomed. 1999;58:51–64. doi: 10.1016/s0169-2607(98)00067-4. [DOI] [PubMed] [Google Scholar]
- Lindbom L., Ribbing J., Jonsson E.N. Perl-speaks-NONMEM (PsN)–a Perl module for NONMEM related programming. Comput. Methods Programs Biomed. 2004;75:85–94. doi: 10.1016/j.cmpb.2003.11.003. [DOI] [PubMed] [Google Scholar]
- Lindbom L., Pihlgren P., Jonsson E.N., Jonsson N. PsN-Toolkit–a collection of computer intensive statistical methods for non-linear mixed effect modeling using NONMEM. Comput. Methods Programs Biomed. 2005;79:241–257. doi: 10.1016/j.cmpb.2005.04.005. [DOI] [PubMed] [Google Scholar]
- Bergstrand M., Hooker A.C., Wallin J.E., Karlsson M.O. Prediction-corrected visual predictive checks for diagnosing nonlinear mixed-effects models. AAPS J. 2011;13:143–151. doi: 10.1208/s12248-011-9255-z. [DOI] [PMC free article] [PubMed] [Google Scholar]
- Houk B.E., Bello C.L., Kang D., Amantea M. A population pharmacokinetic meta-analysis of sunitinib malate (SU11248) and its primary metabolite (SU12662) in healthy volunteers and oncology patients. Clin. Cancer Res. 2009;15:2497–2506. doi: 10.1158/1078-0432.CCR-08-1893. [DOI] [PubMed] [Google Scholar]
- Cartwright G.E., Athens J.W., Wintrobe M.M. The kinetics of granulopoiesis in normal man. Blood. 1964;24:780–803. [PubMed] [Google Scholar]
- Karlsson M.O., Port R.E., Ratain M.J., Sheiner L.B. A population model for the leukopenic effect of etoposide. Clin. Pharmacol. Ther. 1995;57:325–334. doi: 10.1016/0009-9236(95)90158-2. [DOI] [PubMed] [Google Scholar]
- Friberg L.E., Brindley C.J., Karlsson M.O., Devlin A.J. Models of schedule dependent haematological toxicity of 2'-deoxy-2'-methylidenecytidine (DMDC). Eur. J. Clin. Pharmacol. 2000;56:567–574. doi: 10.1007/s002280000181. [DOI] [PubMed] [Google Scholar]
- Sheiner L.B., Stanski D.R., Vozeh S., Miller R.D., Ham J. Simultaneous modeling of pharmacokinetics and pharmacodynamics: application to d-tubocurarine. Clin. Pharmacol. Ther. 1979;25:358–371. doi: 10.1002/cpt1979253358. [DOI] [PubMed] [Google Scholar]
Associated Data
This section collects any data citations, data availability statements, or supplementary materials included in this article.


