

Abstract
This study uses unique official data to document nutritional changes in the 1949–1992 period. In 1949 widespread famine, high mortality, and low life expectancy dominated. Economic progress was uneven, however, the longer-term food supply changed greatly, and hunger was conquered. Diet composition shifted greatly over this period. Cereal consumption, already high, increased from 541.2 grams per day (70.0% coarse grains) in 1952 to 645.9 grams per day (15.9% coarse grains) in 1992. Consumption of animal-source foods, half of which were pork and pork products, tripled from 30.0 grams per day to 103.0 grams per day. The proportion of energy intake from fat tripled from 7.6% to 22.5%, and that from carbohydrates decreased from 83.0% to 65.8% over the same period. Physical activity was high in all domains, but shifts were beginning to occur (e.g., the initial mechanization of work and the expansion of biking). Nutritional improvement was uneven, including increased undernutrition in the 1959–1962 period and a remarkable rebound and continued improvement thereafter. Overweight emerged only after 1982. Shifts in diet, activity, and body composition in 1949–1992 set the stage for major shifts in nutrition in the subsequent decades.
Keywords: malnutrition, food insecurity, overweight, poverty, physical activity
INTRODUCTION
China experienced tremendous social and dietary changes in the twentieth century. Before the British-China Opium War in 1840, China had great wealth concentrated in selected populations and rapid economic growth.1, 2 Experiencing an array of wars and invasions over the course of 110 years, China became one of the poorest countries in the world. China’s gross domestic product (GDP) was US$60 per capita (1990 dollars) in 1949, about half the average of Asian countries, compared with US$600 per capita (1990 dollars) in 1840. In 1949 total mortality rates, infant mortality rates, and maternal mortality rates were 30 per 1,000; 200 per 1,000; and 1,500 per 100,000, respectively. Life expectancy was only 35 years. Hundreds of thousands of people died of hunger.
Before 1949 income throughout the country was extremely low, and investment was insufficient to cover even the depreciation of the nation’s capital stock.3 The wars destroyed industrial capacity. Agriculture was interrupted by conscription, and there were massive population movements from the countryside to the more secure cities. As a result agricultural output by 1949 had fallen to about two-thirds of the highest previously recorded level.4 In 1949 population growth and food demands alongside an inadequate food supply created a crisis. In response China implemented a series of policies to improve living standards. In agriculture the government eliminated the private land ownership and undertook a major land redistribution in rural areas, followed later by agricultural collectivization. Peasants joined cooperatives, and eventually the state owned all the farmland. In industry the government worked with the existing private industrial firms to develop state-owned enterprises and eventually nationalized all firms and companies. As a result agriculture, industry, trade, and government revenue grew dramatically during the first decade of Chinese independence. However, the rapid economic growth was not sustained due to natural disasters and political uncertainty. This period of change was marked by experiments, such as the Great Leap Forward in 1958–1962 and the Cultural Revolution in 1965–1976, which precipitated economic crises. Not until the late 1970s did the current strong economic model emerge to move China rapidly forward. In 1979 China implemented major land, social, and economic reforms. The country’s economy and agricultural productivity changed greatly after this time. Shifts in diet, activity, and body composition set the stage for even greater change, documented by the China Health and Nutrition Survey (CHNS) from 1991 to 2011.5
These social and economic changes have had significant impacts on the traditional Chinese diet, which many scholars consider the most healthful diet when food supplies are adequate6. Many studies have explored the nutrition transition occurring in China.7–12 However, few researchers have had access to government data to understand the marked changes in diet and body composition in the period before these latest reforms. The purpose of this study is to document the secular Chinese dietary trends in the period 1949–1992. China has experienced all five stages of the nutrition transition proposed by Barry M. Popkin,13, 14 but unfortunately no studies have systematically analyzed the patterns and trends during this transition.
SUBJECTS AND METHODS
Dietary data
The National Bureau of Statistics (NBS) of China built the Household Survey and set up a national random sampling framework in 1952 that was clustered by urban/rural areas and economic levels. The NBS drew a national representative sample from this framework and has employed two survey teams to collect economic, occupational, population, marriage, diet, and other data each year. The diet data are based on an income and expenditures survey design and represent a measure of the quantity of food the household has purchased for consumption. The survey design is similar to a longitudinal survey, but about 20% of the households in the sample communities are changed each year. We used the data from 1952 to 1992 to analyze the secular trends in diet and nutrition in China.15
Anthropometric data
China has conducted four rounds of the China National Nutrition Survey (CNNS), in 1959, 1982, 1992, and 2002. Unfortunately no computer files of the 1959 data are available. For this paper we used the 1982 and 1992 data. The CNNS used a multistage, cluster sampling method. In 1982, 178 communities and about 1,500 persons in each community were surveyed. The sample size was 238,134. In 1992, 960 communities and 30 households in each community were surveyed, and the sample size was 100,201. Both surveys measured height and weight in an elaborate way. Details of the measurement methods are described elsewhere.16
Because no national representative anthropometric data were available before 1982, we used data from surveys in some large cities to indirectly measure nutritional status before 1982.17–21 We used the World Health Organization (WHO) cutoff points for body mass index (BMI) to define underweight (BMI < 18.5), overweight (BMI ≥ 25), and obesity (BMI ≥ 30) for adults and International Obesity Task Force (IOTF) references and US Centers for Disease Control and Prevention (CDC) 2000 growth charts for children.
Physical activity data
There are no direct measures of physical activity for this period. We analyzed the proportion of the population who owned televisions, bicycles, and buses reported by the NBS to indirectly measure the shifts in physical activity.15 We assumed that the higher the television, bicycle, and bus ownerships were, the lower physical activity would be.
RESULTS
There are no long-term data before 1952 available for epidemiological studies, as China did not set up its statistical reporting system until 1952. But we can expect that the dietary intake was much lower in 1949 than in 1952, because the Chinese agricultural output was historically low in 1949 and reached a higher level of output by 1952. All analyses below are based on data available between 1952 and 1992.15
Food consumption pattern
The shift in the Chinese diet during 1949–1992 is different from a classic Westernization pattern. It had five clear stages: collecting food, famine, receding famine, emerging noncommunicable diseases, and behavior change. The economic progress in the planned economy before 1978 and in the subsequent liberalization of food production controls and the introduction of a free market for food and food products are linked to these important shifts in diet. We focused on the shifts in key components of the Chinese diet.
Cereal consumption
Cereals are the major staple foods in China, traditionally coarse grains and rice in the South and wheat and wheat products in the North. Due to improvements in transportation and plant technology, both rice and wheat are available everywhere today.
Cereal consumption increased from 1949 through 1957. It dropped to its lowest level in 1962, following a period of economic experimentation that did not meet its agricultural target and actually led to major declines in food production and nutritional status, and then slowly recovered and reached its highest level in 1982. Thereafter cereal intake has been decreasing. Large cultural, economic, and communication differences between urban and rural areas are linked with different cereal intake patterns. Cereal intake in urban areas increased slowly from 1962 through 1982 and then decreased constantly. In rural areas it recovered strongly and since 1970 has exceeded the 1952 level (Table 1).
Table 1.
Intake of major food groups in China (grams/day), 1952–19921
| 1952 | 1957 | 1962 | 1970 | 1982 | 1992 | ||
|---|---|---|---|---|---|---|---|
| Grains | |||||||
| Urban | 445.5 | 457.7 | 371.0 | 380.9 | 395.8 | 305.3 | |
| Rural | 554.0 | 580.1 | 470.3 | 540.3 | 711.9 | 685.9 | |
| Average | 541.2 | 556.0 | 450.7 | 512.6 | 617.3 | 645.9 | |
| Vegetables | |||||||
| Urban | 258.7 | 298.8 | 356.8 | 388.3 | 435.5 | 342.0 | |
| Rural | 218.6 | 247.9 | 296.1 | 322.2 | 361.4 | 353.5 | |
| Average | 223.3 | 258.0 | 308.1 | 333.7 | 377.1 | 350.4 | |
| Oil | |||||||
| Urban | 10.0 | 11.5 | 4.9 | 7.2 | 15.8 | 18.2 | |
| Rural | 5.2 | 5.4 | 2.5 | 3.8 | 9.4 | 16.0 | |
| Average | 5.7 | 6.6 | 3.0 | 4.4 | 9.7 | 17.2 | |
| Pork | |||||||
| Urban | 21.4 | 18.4 | 8.0 | 21.8 | 46.1 | 48.5 | |
| Rural | 15.5 | 12.8 | 5.6 | 15.3 | 24.8 | 32.4 | |
| Average | 16.2 | 13.9 | 6.1 | 16.5 | 32.2 | 36.8 | |
| Red meat | |||||||
| Urban | 2.7 | 3.3 | 2.3 | 2.4 | 5.0 | 10.2 | |
| Rural | 2.5 | 3.0 | 1.6 | 2.2 | 2.2 | 3.9 | |
| Average | 2.5 | 3.0 | 2.2 | 2.2 | 2.8 | 5.6 | |
| Poultry | |||||||
| Urban | 2.9 | 3.3 | 1.3 | 1.1 | 6.2 | 13.9 | |
| Rural | 1.0 | 0.9 | 1.0 | 0.8 | 2.1 | 4.1 | |
| Average | 1.2 | 1.4 | 1.0 | 0.9 | 2.8 | 6.3 | |
| Eggs | |||||||
| Urban | 7.3 | 9.0 | 5.6 | 8.4 | 16.1 | 25.9 | |
| Rural | 2.2 | 2.1 | 1.2 | 2.6 | 3.9 | 7.8 | |
| Average | 2.8 | 3.4 | 2.1 | 3.6 | 6.9 | 21.2 | |
| Fish | |||||||
| Urban | 12.8 | 20.9 | 12.8 | 12.7 | 21.0 | 19.7 | |
| Rural | 6.6 | 9.7 | 6.9 | 7.0 | 3.6 | 6.2 | |
| Average | 7.3 | 11.9 | 8.1 | 8.0 | 10.5 | 20.0 | |
| Total animal | |||||||
| Urban | 47.2 | 54.8 | 30.1 | 46.5 | 94.3 | 118.1 | |
| Rural | 27.7 | 28.3 | 16.3 | 28.0 | 36.7 | 54.3 | |
| Average | 30.0 | 33.6 | 19.5 | 31.2 | 55.2 | 89.9 |
Data source: China Statistical Yearbook 1981–1992.
In another change in cereal consumption, refined rice and wheat consumption has increased even though the total grain consumption has decreased since 1982. For example, intake of refined rice and wheat products was 576.7 grams per day in rural areas in 1992, an increase from 336.8 grams per day in 1978. Of the grains consumed in 1992, 15.9% were coarse grains (e.g., corn, millet, oatmeal), down from 50.4% in 1978 and 70.0% in 1952.
Vegetable and fruit consumption
Consumption of vegetables and fruits showed the same increase patterns in urban and rural areas before 1982. Like the decrease in cereal intake, intake of vegetables and fruits decreased steadily in urban areas by about 100 grams per day between 1982 and 1992. Intake of vegetables and fruits in rural areas reached its highest level in 1982 and has maintained at the same level since then (table 1).
Animal-source food consumption
Consumption of animal-source foods tripled between 1952 and 1992. The lowest intake level occurred in 1962. It increased slowly from 1962 to 1979 and has increased more rapidly since then. Intake of animal-source foods was higher and increased faster in urban areas than in rural areas. It nearly doubled in rural areas and tripled in urban areas over this study period (table 1 and Figure 1).
Figure 1.
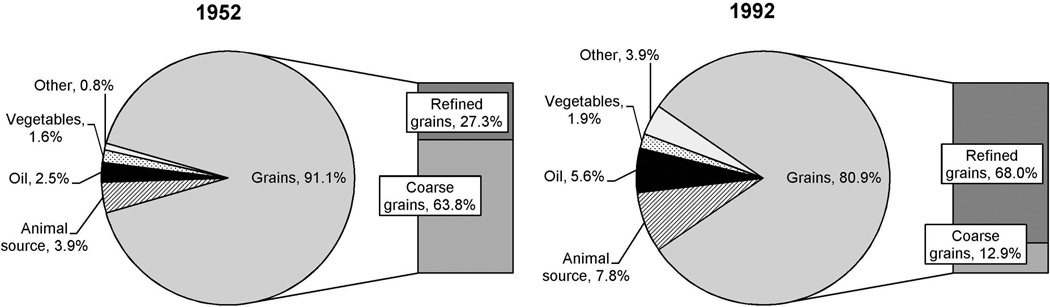
Sources of total energy intake in China, 1952–19921
1Data source: NBS Household Survey
Pork and pork products were the main animal-source foods. Overall about half of the total animal-source foods consumed was pork, but the proportion decreased from 51.3% to 41.0% in urban areas and from 74.9% to 64.2% in rural areas. The proportions of other animal-source foods remained at low levels but were increasing rapidly. Intakes of poultry and eggs showed the fastest increases, particularly in urban areas. Intake of red meat (beef, mutton) increased quickly in urban areas but not in rural areas.
Edible oil consumption
Edible oil consumption nearly tripled during our study period. Much of this increase actually began after 1989, as we have shown elsewhere.11, 22 It increased faster and more constantly in rural areas over the four decades. In urban areas it increased faster before 1985 and increased at a lower rate subsequently. Edible oil consumption in rural areas was about half of that in urban areas in 1952, but it reached the same level in 1992 (table 1).
Macronutrient intake
Trends in total energy intake were similar to those in cereal intake. Total energy intake increased from 1952 to 1957, dropped to its lowest level in 1962, and rebounded through 1982, when it began to decrease. Intake of carbohydrates, fat, and protein showed the same trends as total energy intake. Both the amount of protein intake and the quality of protein significantly increased. Only 3.1% of protein came from animal-source foods in 1952, but that proportion rose to 18.9% in 1992. Intake of fat tripled during this period. Sources of energy changed remarkably. Whereas energy intake from fat tripled, that from carbohydrates significantly decreased from 83.0% to 65.8% (Table 2).
Table 2.
Macronutrient intake in China, 1952–1992
| 19521 | 19571 | 19621 | 19701 | 19821 | 19922 | |
|---|---|---|---|---|---|---|
| Energy (kilocalories/day) | 2,055.6 | 2,125.4 | 1,697.1 | 1,978.2 | 2,517.9 | 2,328.3 |
| Protein (grams/day) | 47.9 | 50.3 | 41.1 | 47.6 | 67.0 | 68.0 |
| Fat (grams/day) | 17.4 | 18.0 | 10.4 | 16.4 | 49.0 | 58.3 |
| Carbohydrates (grams/day) | 426.7 | 440.7 | 359.7 | 410.1 | 452.2 | 382.9 |
| Energy from protein (%) | 9.3 | 9.5 | 9.7 | 9.6 | 10.6 | 11.7 |
| Energy from fat (%) | 7.6 | 7.6 | 5.5 | 7.4 | 17.5 | 22.5 |
| Energy from carbohydrates (%) | 83.0 | 82.9 | 84.8 | 82.9 | 71.8 | 65.8 |
Data source: China Statistical Yearbook 1981–1982.
Data source: CNNS 1992.
Grains remained the major source of energy during this period, but animal-source foods and edible oils grew considerably as energy sources. Energy from animal-source foods and edible oils doubled. Energy from alcoholic beverages and pure sugar was still low but was increasing quickly. Energy from coarse grains declined significantly. Coarse grains contributed more than half of the total energy intake in 1952, but the proportion decreased to below 13% during the study period (figure 1).
Physical activity
There were no direct measures of physical activity during this period. We used the proportions of the population who owned bicycles, buses, and televisions to indirectly measure changes in daily physical activity. In 1952, 88.2% of the Chinese population farmed. Without advanced technology and fertilizers, farming required tremendous amounts of time and labor. The major transportation mode was walking. There was no electricity, and there were no televisions, no private cars, few public buses, and few bicycles. Most people’s daily physical activities were vigorous. By 1992, because of the transformation of industry, more workers had changed jobs from heavy industry to services. The proportion engaged in vigorous labor decreased, and that in light labor increased. The public transportation system was improved with more buses running. More people rode bicycles as their major transportation mode. Televisions became available in 1978. The proportion of the population who owned televisions was still low, but it began to increase dramatically, as did screen time (table 3).
Table 3.
Ownership of buses, bicycles, televisions, and refrigerators in China, 1952–19921
| 1952 | 1957 | 1962 | 1978 | 1982 | 1992 | |
|---|---|---|---|---|---|---|
| Bicycles (per 100 persons) | 0.1 | 0.1 | 0.1 | 0.9 | 13.1 | 38.5 |
| Buses (per 100,000 persons) | 0.8 | 1.0 | 1.0 | 3.3 | 3.7 | 5.9 |
| Televisions (per 100 persons) | 0.0 | 0.0 | 0.0 | 0.3 | 2.7 | 19.5 |
| Refrigerators (per 100 persons) | 0.0 | 0.0 | 0.0 | 0.1 | 0.2 | 3.4 |
Data source: China Statistical Yearbook 1981–1992.
Body composition
The average BMI and the proportion of the population with higher BMIs increased among all age groups during this study period (table 4). No national representative anthropometric data before 1982 are available. A few large studies among students in large cities, such as Shanghai, Taiyuan, and Jinan, show that underweight, stunting, and wasting were prevalent before 1982, especially in the 1959–1962 period. For example, the average Z scores of BMI, height for age, and weight for age of 18-year-old schoolboys in Jinan were −0.18 (percentile 42.9), −1.14 (percentile 12.8), and −0.71 (percentile 23.8), respectively, in 1956; −0.75 (percentile 22.7), −1.36 (percentile 8.6), and −1.35 (percentile 8.9), respectively, in 1962; and −0.84 (percentile 20.1), −1.24 (percentile 10.7), and −1.34 (percentile 9.0), respectively, in 1972 (Figure 2). On average, the proportion of underweight was 13.9% in 1982 and 9.6% in 1992 among men, 10.6% in 1982 and 13.1% in 1992 among children aged 12 to 18 years, and 12.4% in 1982 and 11.9% in 1992 among children aged 6 to 11 years. Overweight and obesity were rare among all age groups in 1982, but they increased quickly by 1992, particularly among men in urban areas (Table 5).
Table 4.
Average BMIs in China, 1982–19921
| Children < 6 years |
Children 6–11 years |
Children 12–18 years |
Adults |
|||||
|---|---|---|---|---|---|---|---|---|
| 1992 | 1982 | 1992 | 1982 | 1992 | 1982 | 1992 | ||
| Rural | ||||||||
| Male | 16.6 | 15.8 | 15.8 | 17.6 | 18.2 | 20.5 | 21.3 | |
| Female | 16.3 | 15.6 | 15.6 | 18.0 | 18.9 | 21.2 | 21.7 | |
| Average | 16.5 | 15.7 | 15.7 | 17.8 | 18.6 | 20.8 | 21.5 | |
| Urban | ||||||||
| Male | 17.0 | 15.7 | 16.5 | 18.7 | 19.0 | 20.8 | 22.5 | |
| Female | 16.6 | 15.3 | 16.2 | 19.4 | 19.3 | 21.1 | 22.9 | |
| Average | 16.8 | 15.5 | 16.4 | 19.0 | 19.2 | 21.0 | 22.7 | |
| Average | ||||||||
| Male | 16.6 | 15.8 | 16.0 | 18.4 | 18.4 | 20.6 | 21.7 | |
| Female | 16.4 | 15.5 | 15.7 | 18.9 | 19.0 | 21.1 | 22.1 | |
| Average | 16.5 | 15.6 | 15.9 | 18.6 | 18.7 | 20.9 | 21.9 | |
Data source: CNNS 1982, 1992.
Figure 2.

Changes in Z scores of BMI, height for age, and weight for age of 18-year-old boys in Jinan, China, 1956–19921
1Sources: Data for 1956–1972 from Xu and Zhang 1982; data for 1982 from the CNNS 1982; data for 1992 from the CNNS 1992.
Table 5.
Prevalence of underweight, overweight, and obesity in China, 1982–19921
| Children < 6 years |
Children 6–11 years |
Children 12–18 years |
Adults |
|||||
|---|---|---|---|---|---|---|---|---|
| 1992 | 1982 | 1992 | 1982 | 1992 | 1982 | 1992 | ||
| Underweight2 | ||||||||
| Rural | ||||||||
| Male | 6.9 | 12.5 | 11.8 | 11.0 | 16.7 | 13.6 | 9.5 | |
| Female | 6.9 | 17.9 | 13.2 | 5.3 | 11.0 | 13.9 | 10.7 | |
| Average | 6.9 | 15.2 | 12.5 | 8.4 | 13.9 | 13.7 | 10.2 | |
| Urban | ||||||||
| Male | 7.2 | 11.0 | 9.5 | 17.1 | 14.7 | 12.2 | 8.1 | |
| Female | 6.1 | 11.2 | 11.1 | 12.7 | 7.2 | 15.6 | 8.0 | |
| Average | 6.7 | 11.1 | 10.3 | 15.0 | 10.9 | 14.1 | 8.1 | |
| Average | ||||||||
| Male | 7.0 | 11.5 | 11.3 | 12.9 | 16.1 | 13.0 | 9.1 | |
| Female | 6.8 | 13.3 | 12.7 | 7.8 | 9.9 | 14.8 | 9.8 | |
| Average | 6.9 | 12.4 | 11.9 | 10.6 | 13.1 | 13.9 | 9.6 | |
| Overweight3 | ||||||||
| Rural | ||||||||
| Male | 9.5 | 1.7 | 3.3 | 0.5 | 2.2 | 2.8 | 7.3 | |
| Female | 10.5 | 1.2 | 3.1 | 1.7 | 2.3 | 8.5 | 12.7 | |
| Average | 9.9 | 1.4 | 3.2 | 1.0 | 2.3 | 5.2 | 10.2 | |
| Urban | ||||||||
| Male | 11.3 | 2.9 | 7.6 | 1.1 | 6.8 | 3.4 | 20.8 | |
| Female | 9.2 | 2.3 | 6.2 | 0.7 | 4.6 | 7.1 | 25.4 | |
| Average | 10.3 | 2.6 | 6.9 | 0.9 | 5.7 | 5.5 | 23.2 | |
| Average | ||||||||
| Male | 9.8 | 2.5 | 4.3 | 0.6 | 3.5 | 3.0 | 11.8 | |
| Female | 10.2 | 1.9 | 3.9 | 1.4 | 3.0 | 7.7 | 17.0 | |
| Average | 10.0 | 2.2 | 4.1 | 1.0 | 3.2 | 5.4 | 14.4 | |
| Obese4 | ||||||||
| Rural | ||||||||
| Male | 6.4 | 0.4 | 1.9 | 0.0 | 0.7 | 0.0 | 0.5 | |
| Female | 7.1 | 0.2 | 2.2 | 0.1 | 0.4 | 0.3 | 1.1 | |
| Average | 6.7 | 0.3 | 2.1 | 0.1 | 0.5 | 0.1 | 0.8 | |
| Urban | ||||||||
| Male | 9.2 | 0.7 | 4.1 | 0.7 | 1.4 | 0.1 | 1.8 | |
| Female | 9.8 | 0.8 | 4.1 | 0.4 | 0.8 | 0.1 | 3.7 | |
| Average | 9.5 | 0.8 | 4.1 | 0.5 | 1.1 | 0.1 | 2.8 | |
| Average | ||||||||
| Male | 6.9 | 0.6 | 2.5 | 0.2 | 0.9 | 0.1 | 0.9 | |
| Female | 7.6 | 0.6 | 2.7 | 0.2 | 0.5 | 18.0 | 2.0 | |
| Average | 7.2 | 0.6 | 2.6 | 0.2 | 0.7 | 0.1 | 1.4 | |
Data source: CNNS 1982, 1992.
Underweight is defined as BMI < 18.5 for adults and BMI < fifth percentile of the US CDC 2000 reference for children and adolescents. STATA zanthro and zbmicat were used to calculate Z scores and percentiles.
Overweight is defined as BMI ≥ 25 to < 30 for adults and the IOTF BMI reference for children and adolescents. STATA zanthro and zbmicat were used to calculate Z scores and percentiles.
Obesity is defined as BMI ≥ 30 for adults and the IOTF BMI reference for children and adolescents. STATA zanthro and zbmicat were used to calculate Z scores and percentiles.
DISCUSSION
China experienced an unprecedentedly dramatic dietary and body composition transition between 1949 and 1992. Remarkable economic progress increased the food supply and the available food products and has been linked with major shifts in the structure of the diet. During this period China transformed from a country with food shortages and protein and energy deficiencies to one with a food surplus. While malnutrition and overnutrition coexisted in 1992, the future pathway was set for continued remarkable nutritional change.
The changes in China’s dietary patterns mirror the five stages of the nutrition transition proposed by Popkin.11, 23–25 First, famine receded from China’s independence in 1949 to 1957. China in 1949 was like a wasteland, with a seriously damaged agricultural sector and minimal industrial activity. At that time famine was prevalent, mortality was very high, and life expectancy was very low. After 1949 the economy began to recover, and the food supply began to increase. Limited by inferior agricultural technology and poor land resources, food production still was not adequate to feed the quickly growing population. Cereals, mainly coarse grains, predominated in a diet with minimal variety. Little animal protein was available.
In the second stage, from 1958 to 1962, the most serious natural disaster in the country’s history, international isolation, and mistaken economic policies, especially the Great Leap Forward, caused a sharp decrease in the food supply and food consumption. During this period cereal intake decreased by 18.9%, animal-source food intake by 42.1%, and edible oil intake by 55.2%. Because of food shortages, many people had to eat bark, plant roots, and kaolin to stop feeling hungry. We may never know how many people died of hunger, but the few available data shed insights into the connection between the great depression and famine. The population growth rate was 23.2 per 1,000 in 1957, up from 16.0 per 1,000 in 1949. It decreased to 17.2 per 1,000 in 1958, 10.2 in 1959, −4.6 in 1960, and 3.8 in 1961. It increased again to 27.0 per 1,000 in 196226. Meanwhile food shortage and inadequate food intake slowed or delayed children’s growth and development. In Jinan on average 14-year-old schoolboys were 5.8 centimeters (cm) shorter and 4.8 kilograms (kg) lighter in 1962 than in 1956, and 15-year-old schoolboys were 7.6 cm shorter and 4.7 kg lighter in 1962 than in 1956. Other data show the same trends during this period (Table S1). The data in figure 1 highlight this marked decline in all measures of body composition. The actual prevalence of stunting, wasting, and underweight are severely underestimated, as only people of a higher economic status could attend school, and Jinan was among the richest cities in China.
The third stage was a strong recovery between 1962 and 1978. Even though the Cultural Revolution had caused political uncertainty and economic instability, China adjusted its economic policy, and the economy improved slowly. Agricultural output steadily increased, and famine again receded. The standard of living began to rebound and finally exceeded the highest level in the country’s history. During this period intake of cereals increased by 25.8%, and intake of animal-source foods and edible oil doubled.
The fourth stage, 1979 to 1985, came after the liberalization of food production and the food supply, when the annual economic growth rate was over 10%. During this period the food products available increased quickly. Foreign fast foods, packaged foods, soft drinks, and edible oils were imported and were available in many large cities. As a result fat intake and energy intake from fat increased quickly, and diets diversified. Obesity and other noncommunicable diseases emerged (Tables S2–S4).
Following this rapid growth, further economic improvement after 1985 led to a shift in physical activities, energy requirements, and dietary behaviors First, physical activities were reduced due to advances in technology and transportation.27 The public transportation system was improved with more buses, bus routes, and highways. Instead of walking, people biked or took buses. A large portion of people lived a sedentary life, and the equally large reduction in physical activity at work was also important. In 1952 China was a self-sufficient agricultural country in which 88.2% of the population lived in rural areas. Due to the restrictive residency registration system (hukou), people who lived or were born in rural areas were not allowed to live or work in urban areas. They had to work on a farm, and their work-related physical activities were vigorous. This status has been changing slowly. In 1992 people started to move to urban areas to work in the service sector. Meanwhile televisions and computers became available. People started to spend more time watching television and playing or working with the computer. Second, decreased physical activities resulted in lower energy requirements. The data we present in this study also show a trend of decreased total energy intake. Third, the structure of the Chinese diet and dietary behaviors started to change. The traditional Chinese diet includes large amounts of cereals and vegetables and small amounts of animal-source foods. Such a diet is low in fat, low in energy density, high in carbohydrates, and high in dietary fiber.28, 29 However, since 1985 diets have shifted to high fat and high energy density. Edible oil intake has increased unabated, as has the intake of animal-source foods. Unlike other East Asian countries, such as South Korea, which has used mass media and government programs to encourage retention of its high-vegetable, low-fat traditional cuisine,30 China seems to be rapidly relinquishing its traditional diet, which is the fifth stage of behavior change.
There are some limitations in our results. Foremost is the loss of the 1959 national survey and the use of surveys from urban areas for some of our measures. We used surveys from Jinan in Shandong, an eastern province in China, to provide a continuous series of 18-year-old body composition trends in China. This is most likely a severe underestimation of the nutritional declines that occurred in rural China during this period.
In conclusion, China experienced dramatic changes in dietary and body composition patterns between 1949 and 1992. The country has transformed quickly from a stage of scarcity, a very traditional lifestyle, and extensive undernutrition to a stage of overnutrition and emerging nutrition-related noncommunicable diseases.
Supplementary Material
Acknowledgements
This research uses data from the China Health and Nutrition Survey (CHNS). We thank the National Institute of Nutrition and Food Safety, Chinese Center for Disease Control and Prevention; the Carolina Population Center (5 R24 HD050924), University of North Carolina at Chapel Hill; the National Institutes of Health (R01-HD30880, DK056350, R24 HD050924, and R01-HD38700); and the Fogarty International Center, National Institutes of Health (5D43TW007709 and 5D43TW009077) for financial support for the CHNS data collection and analysis files from 1989 to 2011. We also wish to thank Jim Terry, Phil Bardsley, and Guifeng Jin for their programming support; Frances L. Dancy for administrative assistance; Tom Swasey for graphics support; and Jean Kaplan for editing support.
Abbreviations
- GDP
gross domestic product
- CHNS
China Health and Nutrition Survey
- NBS
National Bureau of Statistics
- CNNS
China National Nutrition Survey
- WHO
World Health Organization
- BMI
body mass index
- IOTF
International Obesity Task Force
- CDC
Centers for Disease Control and Prevention
- cm
centimeters
- kg
kilograms
Footnotes
Conflict of Interest: None of the authors have financial disclosures or conflicts of interest.
References
- 1.Maddison A. Chinese Economic Performance in the Long Run. Paris: ORGANISATION FOR ECONOMIC CO-OPERATION AND DEVELOPMENT; 1998. [Google Scholar]
- 2.Maddison A. The World Economy: A Millennial Perspective. Paris: ORGANISATION FOR ECONOMIC CO-OPERATION AND DEVELOPMENT; 1998 2001. [Google Scholar]
- 3.Howe C. China's Economy, A Basic Guide. New York: Basic Books, Inc.; 1978. [Google Scholar]
- 4.National Bureau of Statistics of China. China Statistical Yearbook 1981. Beijing: China Statistics Press; 1982. [Google Scholar]
- 5.Zhai F, Du S, Wang Z, Zhang J, Du W, Popkin BM. Dynamics of the Chinese diet and the role of urbanization, 1991–2011. Obes Rev. 2013 doi: 10.1111/obr.12124. [DOI] [PMC free article] [PubMed] [Google Scholar]
- 6.Newman JM. Chinese food: Diet of the past may be diet of the future. Nutr Forum. 1985;2:52–53. [Google Scholar]
- 7.Popkin BM. Recent dynamics suggest selected countries catching up to US obesity. Am J Clin Nutr. 2010;91:284S–288S. doi: 10.3945/ajcn.2009.28473C. [DOI] [PMC free article] [PubMed] [Google Scholar]
- 8.Du S, Mroz TA, Zhai F, Popkin BM. Rapid income growth adversely affects diet quality in China--particularly for the poor! Soc Sci Med. 2004;59:1505–1515. doi: 10.1016/j.socscimed.2004.01.021. [DOI] [PubMed] [Google Scholar]
- 9.Popkin BM, Du S. Dynamics of the nutrition transition toward the animal foods sector in China and its implications: a worried perspective. J Nutr. 2003;133:3898S–3906S. doi: 10.1093/jn/133.11.3898S. [DOI] [PubMed] [Google Scholar]
- 10.Popkin BM. The nutrition transition and obesity in the developing world. J Nutr. 2001;131:871S–873S. doi: 10.1093/jn/131.3.871S. [DOI] [PubMed] [Google Scholar]
- 11.Popkin BM, Keyou G, Zhai F, Guo X, Ma H, Zohoori N. The nutrition transition in China: a cross-sectional analysis. Eur J Clin Nutr. 1993;47:333–346. [PubMed] [Google Scholar]
- 12.Du S, Lu B, Zhai F, Popkin BM. A new stage of the nutrition transition in China. Public Health Nutr. 2002;5:169–174. doi: 10.1079/PHN2001290. [DOI] [PubMed] [Google Scholar]
- 13.Popkin BM. The nutrition transition in low income countries: An emerging crises. Nutr Rev. 1994;52:85–98. doi: 10.1111/j.1753-4887.1994.tb01460.x. [DOI] [PubMed] [Google Scholar]
- 14.Popkin B. The nutrition transition and its health implications in lower income countries. Public Health Nutr. 1998;1:5–21. doi: 10.1079/phn19980004. [DOI] [PubMed] [Google Scholar]
- 15.National Bureau of Statistics of China. China Statistical Yearbook 1993. Beijing: China Statistics Press; 1994. [Google Scholar]
- 16.Ge K, Zhai F. Chinese Redident's Nutritional and Physical Status. Beijing: People's Medical Publishing House; 1995. [Google Scholar]
- 17.Xu M, Zhang R. Growth and development of elementary and middle school students in Jinan City over a period of 33 years. J Sch Health. 1982;2:15–19. [Google Scholar]
- 18.Xu S. Half a century of child growth studies in China. Acta Academiae Medicinae Primae Shanghai. 1982;9:387–394. [Google Scholar]
- 19.Kung L-C, Hsu P-C, Lu C-S, et al. A nutritional survey of some workers in a mine in Kwangtung province (II): Physical measurements and clinical findings. Acta Nutrimenta Sinica. 1958;3:85–94. [Google Scholar]
- 20.Kung L-C, Kuan H-L, Lu C-S, Wu Y-H, Hsu P-C. A nutrition survey of some educational and other children's institutions of Canton (II): Physical measurements of children of middle school age. Acta Nutrimenta Sinica. 1956;1:231–240. [Google Scholar]
- 21.Qin W, Qiao X, Li H. Evaluation of children's growth and development among 3257 children under 7 years old in Tianjian in 1959–1960. J Tianjin Med. 1965;7:567–572. [Google Scholar]
- 22.Drewnowski A, Popkin BM. The nutrition transition: new trends in the global diet. Nutr Rev. 1997;55:31–43. doi: 10.1111/j.1753-4887.1997.tb01593.x. [DOI] [PubMed] [Google Scholar]
- 23.Popkin B. Nutritional patterns and transitions. Pop Devel Rev. 1993;19:138–157. [Google Scholar]
- 24.Popkin BM. The nutrition transition in low-income countries: an emerging crisis. Nutr Rev. 1994;52:285–298. doi: 10.1111/j.1753-4887.1994.tb01460.x. [DOI] [PubMed] [Google Scholar]
- 25.Popkin BM. The nutrition transition and its health implications in lower-income countries. Public Health Nutr. 1998;1:5–21. doi: 10.1079/phn19980004. [DOI] [PubMed] [Google Scholar]
- 26.National Bureau of Statistics of China. China Statistical Yearbook 1987. Beijing: China Statistics Press; 1988. [Google Scholar]
- 27.Bell AC, Ge K, Popkin BM. Weight gain and its predictors in Chinese adults. Int J Obes Relat Metab Disord. 2001;25:1079–1086. doi: 10.1038/sj.ijo.0801651. [DOI] [PubMed] [Google Scholar]
- 28.Campbell TC, Junshi C. Diet and chronic degenerative diseases: perspectives from China. Am J Clin Nutr. 1994;59:1153S–1161S. doi: 10.1093/ajcn/59.5.1153S. [DOI] [PubMed] [Google Scholar]
- 29.Campbell TC, Parpia B, Chen J. Diet, lifestyle, and the etiology of coronary artery disease: the Cornell China study. Am J Cardiol. 1998;82:18T–21T. doi: 10.1016/s0002-9149(98)00718-8. [DOI] [PubMed] [Google Scholar]
- 30.Kim S, Moon S, Popkin BM. The nutrition transition in South Korea. Am J Clin Nutr. 2000;71:44–53. doi: 10.1093/ajcn/71.1.44. [DOI] [PubMed] [Google Scholar]
Associated Data
This section collects any data citations, data availability statements, or supplementary materials included in this article.