

Abstract
Background
Most closed-loop insulin delivery systems rely on model-based controllers to control the blood glucose (BG) level. Simple models of glucose metabolism, which allow easy design of the control law, are limited in their parametric identification from raw data. New control models and controllers issued from them are needed.
Methods
A proportional integral derivative with double phase lead controller was proposed. Its design was based on a linearization of a new nonlinear control model of the glucose–insulin system in type 1 diabetes mellitus (T1DM) patients validated with the University of Virginia/Padova T1DM metabolic simulator. A 36 h scenario, including six unannounced meals, was tested in nine virtual adults. A previous trial database has been used to compare the performance of our controller with their previous results. The scenario was repeated 25 times for each adult in order to take continuous glucose monitoring noise into account. The primary outcome was the time BG levels were in target (70–180 mg/dl).
Results
Blood glucose values were in the target range for 77% of the time and below 50 mg/dl and above 250 mg/dl for 0.8% and 0.3% of the time, respectively. The low blood glucose index and high blood glucose index were 1.65 and 3.33, respectively.
Conclusion
The linear controller presented, based on the linearization of a new easily identifiable nonlinear model, achieves good glucose control with low exposure to hypoglycemia and hyperglycemia.
Keywords: closed-loop control, diabetes, nonlinear control model, proportional integral derivative
Introduction
In the literature, many closed-loop control design techniques were tested in the case of blood glucose (BG) control [proportional integral derivative (PID), model predictive control (MPC), nonlinear MPC, H∞ control, fuzzy logic control].1–14 Most of the controllers are model based, thus needing a control model of the BG regulation system.15–17 In this regard, simple linear models have been initially proposed,18–20 but they have shown insufficiencies to fairly represent its behavior.14 Taking into account nonlinear features, the more refined model of Bergman and coauthors14 has evolved as a dominant model in the literature. This model can be quite appealing for control algorithms because of its simple form. Moreover, its identification can be achieved from data stemming from the glucose monitoring system and the insulin pump. However, some limitations in the parametric identification of this model have been underlined, leading to difficulties in its practical use.22,23 For instance, this model needs to fix basal values of insulin and glucose to be structurally identifiable, but these are not precisely known for type 1 diabetes patients (T1DM). Furthermore, it has been shown that this model does not capture long-term effects of insulin delivery.24 In this article, a short description of a new nonlinear control model easily identifiable from real patients’ data is proposed. Then a specific PID controller from a linearized version of the new proposed model has been developed, as PID controllers have been used to regulate BG level,13 and displayed an acceptable regulation of BG. This approach is classic in control theory, because local properties of a nonlinear model can be deduced from the properties of the associated linearized model.25
The organization of this article is as follows. We begin by a brief description of the nonlinear model and the synthesis of the controller. We then detail the experiment and the results of simulations from the publicly available version of the University of Virginia/Padova T1DM metabolic simulator using a scenario proposed by Cameron and coauthors.26 Finally, the performances of our controller are compared with the controllers tested by Cameron and coauthors.26
Methods
Simulation Model of Type 1 Diabetes Mellitus Patients
The UVa/Padova T1DM metabolic simulator (UVa/Padova metabolic simulator)27,28 is approved by the Food and Drug Administration as an in silico model of diabetes29 for closed-loop algorithm preclinical tests. Yet only 10 adult subjects are included in the publicly available version of this software. They were the virtual subjects used to generate our experimental data for the identification process and to validate our controller.
Presentation of the New Nonlinear Control Model of the Glucose Metabolism
The minimal model of Bergman and coauthors21 imposes the knowledge of two parameters Gb (glucose basal value) and Ib (insulin basal value), corresponding to a particular steady state, to be structurally identifiable.30 For a nondiabetic subject, Ib represents the value of the insulin produced by the pancreas in steady state, and Gb is the measured glucose value associated. Therefore, they can be measured. In case of T1DM patients, they are unknown. Thus, in the design of this new model, we did not consider a model in variation around basal values, but we set instead a generic condition about equilibrium states.
This condition was built by studying a mathematical relation at equilibrium between the injected insulin and the measured glucose. The data necessary to determine this mathematical relationship were obtained from the 10 virtual adults of the UVa/Padova metabolic simulator. The form of this equilibrium curve is supposed to be continuous and decreasing from a glycemia maximum at 0 U insulin to a glycemia that converges to zero as the associated insulin value is getting higher. Equation (1) details the mathematical equation at equilibrium validated on 10 virtual adults:
| 1 |
This leads to the nonlinear form of our model.
The model itself consists of three differential equations. The input is the insulin delivery rate and the output is the measured glycemia. The glucose coming from meals is considered as a disturbance. The form of Equation (2.1) is deduced from Equation (1) and is nonlinear. It represents the glucose compartment. Equations (2.2) and (2.3) model the diffusion of insulin by two first-order equations. More details about the synthesis of the model can be found elsewhere.31,32 The equations of the proposed new nonlinear model of the glucose metabolism are
| 2.1 |
| 2.2 |
| 2.3 |
where Ui (pmol/min) is the injected insulin and D (mg/min) is the glucose issued from meals and considered as an unknown disturbance in this work. The variable G (mg/dl) denotes the glycemia. X2 and X1 (pmol/min) represent the insulin in distant compartments. The parameter ωi (min −1) represents the reverse time constant associated with the diffusion of insulin in the organism. The parameter P1 (min−1) represents a gain on the joint action of the pair insulinglucose on glucose. The parameter SI (pmol/min) represents a gain on the action of insulin on glucose. The parameter (mg/(dl/min)) corresponds to the endogenous glucose production. The physiological meaning of these parameters implies that they are strictly positive. The only measured output of the system is G which corresponds to the BG values.
Design of the Proportional Integral Derivative with Double Phase Lead Controller
The objective of the controller is to maintain glycemia in the range 70–180 mg/dl to avoid both low (<50 mg/dl) and high (>250 mg/dl) levels, despite meal disturbances and measurement noises. A PID-type controller is considered to be robust to disturbances and is easy to implement from a linear or linearized model. The design of such a controller requires a particular set point, and an efficient regulation will imply to respect the defined control range. The control variable is the injected insulin. The controller will produce an output that varies proportionally to the error between the measured glycemia and its set point desired value (proportional action). It will react to the rate of change of this error occurring during a meal (derivative action). Eventually, a cancellation of the static error is expected so that glycemia stays in the normal range (integral action). The linearization of the new model around a set point and the design of the controller are described here.
Model Linearization
In the present approach, meals are considered as disturbances and then the input D is neglected in the control design process. The equilibrium state (G0, X20, X10) for a constant insulin input is given by
| 3.1 |
| 3.2 |
Let , and , then the linearized model around this equilibrium point is given by
| 4 |
Since the state matrix is upper triangular, its eigenvalues are displayed on its diagonal. They are strictly negative, because the parameters of the model are strictly positive. The equilibrium state is thus exponentially stable. In the frequency domain, the following transfer function between u and g is obtained:
| 5 |
where p denotes the symbolic Laplace variable.
The gain is defined by Km, and its value is given by (–SIG0). The time constants are defined by T1 and T2. T2 is equal to (1/ωi), and T1 is equal to (). The values of T1 and Km depend on the linearization point.
Choice of the Type and Form of the Proportional Integral Derivative Controller
The system presents an instability risk in closed loop, because it is a third-order system. Thus we may expect from a proposed controller to increase the bandwidth while keeping the stability of the system. Several solutions can be proposed to answer this point. From an analysis of the form of transfer function of the system [Equation (5)], the simplest solution to decrease the instability risk in closed loop is to compensate the double-order pole linked to the time constant T2. As a consequence, a proportional integral derivative with double phase lead (PIDD) controller is proposed to ensure the feasibility of the controller. The transfer function of this controller, corresponding to an implementation in a series form, is given by
| 6 |
Its factors correspond respectively to the proportional, integral, and derivative actions, the latter being filtered to reduce the noise sensitivity and to be physically implementable. The value of α was chosen equal to 0.1, which corresponds to a classical tuning value of this parameter.
Its structure, as detailed earlier, allows some poles of the system to be cancelled in the calculation of the controlled system open-loop transfer function by setting the time constants Ti = T1 and Td = T2. The resulting transfer function in open loop, denoted OL(p), is then given by
| 7 |
Tuning of the Controller
Tuning of the proposed controller is constrained by intrinsic characteristics of the system and desired specifications. Indeed, the physical control variable has to be positive because it is the delivery rate of insulin. Such a constraint cannot be taken into account in the computation of the control, as it would be done in an optimization process since a PID provides an explicit expression of its output. As a result, a smooth control is required in order to maintain the system in the linearity zone. This can be ensured by specifying a sufficiently large phase margin for the controlled system. Let Δφ be the desired phase margin, and the corresponding cutoff frequency should be
| 8 |
By setting , this provides the value of the controller gain:
| 9 |
Another constraint is that the measured glycemia is noisy. In the case of the UVa/Padova metabolic simulator, this noise signal is a low-frequency signal with a bandwidth equivalent to that of the noise-free measured glucose. To filter the noise, a very high value of the phase margin is chosen (Δφ is 85° or 87.5°, depending on the insulin sensitivity of the patient).
Implementation of the Controller
The controller has been designed for a model in variation around the equilibrium point. So the actual insulin delivery corresponds to the sum of the controller output and the equilibrium control value (). In the implementation, the integral action was initialized at the insulin value corresponding to the linearization set point so that the output of the implemented controller is the total insulin delivery.
Tuning of the controller has been performed to minimize the risk of computing negative values of insulin delivery. Yet a saturation of this variable is mandatory to ensure its positivity in any case. Furthermore, a specific implementation of the integral action, as displayed in Figure 1, is performed to avoid the phenomenon of integral windup. The implementation of the controller is represented in Figure 1.
Figure 1.
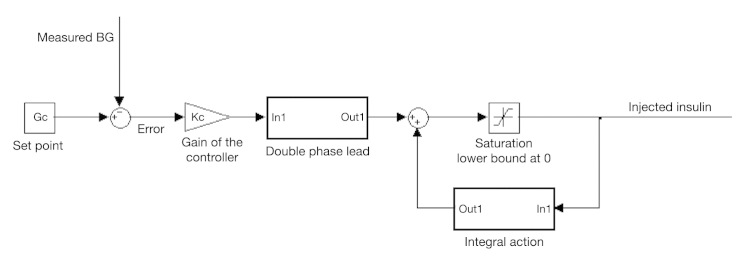
Implementation of the controller in the simulator.
Results
Identification of the Parameters of the Model
The input was the injected insulin and the output was the noise-free BG values; no meal disturbance was considered in the scenario. The identification protocol used to obtain data was as follows:
An open-loop scenario was applied, consisting of a basal insulin step (increase of its basal value), with a patient-specific magnitude depending on the insulin sensitivity.
The step magnitude was chosen by using available information from each subject (the maximum drop in mg/dl/U insulin and the basal insulin value) so that the BG values of the patient stay in their normal range (BG > 70 mg/ dl).
Twelve hours of data were considered, as the duration of the insulin action is lower than 6 h.
The sampling time wa s that of the simulator (i.e., 1 min).
At the beginning of the experiment, the previous basal insulin values were supposed to be constant so that the model initial states could be supposed at steady states. The states of X1 and X2 were therefore considered equal to initial basal value (Ub), and the initial glucose value was fixed to the glucose value measured (Gb). From the data provided by this protocol, the identification toolbox of Matlab33 was used to obtain the four parameters of the new nonlinear model. The optimization algorithm “nonlinear least squares” was selected. An indicator of the goodness of the identified model is given by the fit function:
where y is the vector of measured glucose values, ŷ is the vector of glucose values estimated by the model, and is the mean of the measured glucose values. The closer its value to 100%, the better the estimated model.
The mean fit obtained by our model on the 10 virtual patients is 99.5%, with a standard deviation of 0.5%. A cross validation using another noise-free scenario without meal disturbance was performed. The new scenario consists of variations of basal values during one day. The mean fit obtained on the 10 virtual patients is 71.8%. Figure 2 represents a cross validation result for the virtual adult 3. This indicates that the new control model can provide a good approximation of the simulator model when considering BG values.
Figure 2.
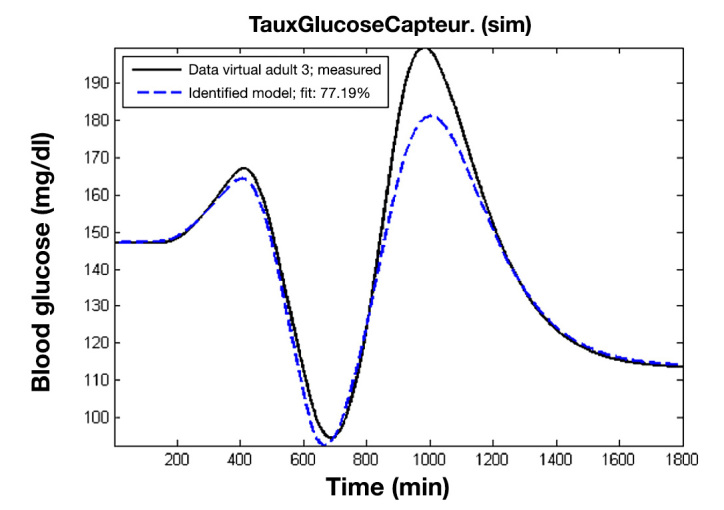
Cross-validation results of the identified model of a virtual patient on another data set.
Testing the Proportional Integral Derivative with Double Phase Lead Controller
To compare the performances of the new PIDD controller with existing controllers, the Cameron and coauthors26 scenario was used for the closed loop. According to this scenario, the 10 adult patients of the UVa/Padova metabolic simulator were simulated during 36 h. Six unannounced meals were planned, lasting 15 min each and respectively measuring 50 g carbohydrate (CHO) at 9:00 am, 70 g at 1:00 pm, 90 g at 5:30 pm, 25 g at 8:00 pm, 50 g at 9:00 am, and 70 g at 1:00 pm. The glycemia was measured through the continuous glucose monitoring system. The controller used a sample time of 5 min. The glycemia set point value was 140 mg/dl. To take into account the effect of noise, the scenario was repeated 25 times for each patient. Just as Cameron and coauthors,26 we have excluded adult 9 from the average results. Indeed, they studied this adult and showed that the suppression of the endogenous glucose production of this virtual patient following a meal was still active after 6 h, which led to hypoglycemia after meals. They then concluded that it was not representative of a normal diabetes patient and should be considered as an outlier. Furthermore, even with an optimal bolus correction associated with meals, this virtual patient is subject to hypoglycemia while other adults are not.
Table 1 provides the performance measures for the 10 adults and the average values for the 9 valid adults. The mean time within the target range (70–180 mg/dl) was 77%. Percentages of time in hypoglycemia (BG < 50 mg/dl) and hyperglycemia (BG > 250 mg/dl) were 0.8% and 0.3%, respectively. There was nearly no reading above 250 mg/dl (adult 4 and adult 6). As a result, both the means of low blood glucose index (LBGI) and high blood glucose index (HBGI)34 were low (Table 2), indicating that the controller minimized the risk of low and high glucose excursion.
Table 1.
Main Objectives Performance Measuresa
| ID | Mean BG (± SEM) | %BG 70–180 | %BG < 50 (n)b | %BG > 250 | %BG 50–70 |
|---|---|---|---|---|---|
| Adult 1 | 131 (±6) | 72% | 0.8% (4) | 0% | 11.8% |
| Adult 2 | 131 (±4) | 89% | 0% (1) | 0% | 3.5% |
| Adult 3 | 148 (±4) | 70% | 0.3% (1) | 0% | 3.1% |
| Adult 4 | 133 (±5) | 78% | 0.3% (1) | 2.4% | 3% |
| Adult 5 | 125 (±5) | 77% | 1.8% (5) | 0% | 10.7% |
| Adult 6 | 135 (±6) | 73% | 0.8% (2) | 0.1% | 6.5% |
| Adult 7 | 141 (±4) | 82% | 0% (0) | 0% | 0.6% |
| Adult 8 | 120 (±6) | 95% | 1.3% (3) | 0% | 2.7% |
| Adult 9 | 128 (±16) | 55% | 21.3% (25) | 0% | 3% |
| Adult 10 | 147 (±4) | 57% | 0.6% (3) | 0% | 12.2% |
| Average values | 135 (±5) | 77% | 0.8% | 0.3% | 6% |
BG in mg/dl. SEM, standard error of the mean.
n refers to the number of the tests (among the 25 tests) with BG < 50 mg/dl.
Table 2.
Performance Measures (Quality Indicators)
| ID | Interquartile range (mg/dl) | LBGI | HBGI | Premeal BG (mg/dl) | Postmeal BG (mg/dl) |
|---|---|---|---|---|---|
| Adult 1 | 65 | 2.64 | 3.09 | 138 | 172 |
| Adult 2 | 67 | 1.28 | 2.50 | 139 | 165 |
| Adult 3 | 58 | 1.08 | 4.68 | 151 | 188 |
| Adult 4 | 65 | 1.25 | 3.52 | 128 | 200 |
| Adult 5 | 63 | 2.71 | 2.35 | 130 | 172 |
| Adult 6 | 81 | 1.80 | 3.67 | 142 | 185 |
| Adult 7 | 60 | 0.44 | 3.47 | 145 | 183 |
| Adult 8 | 46 | 1.45 | 1.21 | 122 | 148 |
| Adult 10 | 92 | 2.17 | 5.48 | 154 | 202 |
| Average values | 66 | 1.65 | 3.33 | 139 | 179 |
Figure 3 shows the average values and the 95% and 70% confidence intervals of the BG values for the nine virtual patients. The analysis of this figure shows that the meal disturbances are rejected. We recall that the proposed controller receives no information concerning the time and quantity of CHO in meals. Yet some patients suffer from hypoglycemia events during nighttime. It mostly concerns the patients for whom the duration of the meal action is higher than 4 h, which is the time between two meals. Furthermore, no upper limit on the maximum quantity of injected insulin was considered in this case. Thus adding a safety system limiting the daily insulin dose to the controller would improve the presented results.
Figure 3.
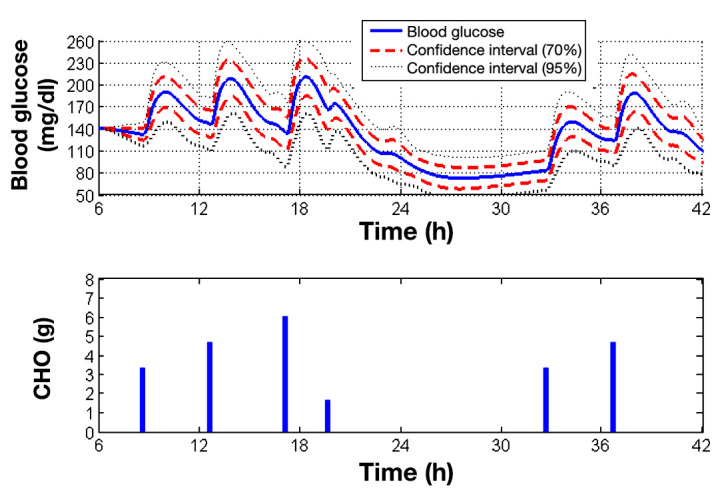
Average control performance and confidence intervals for the nine virtual patients. The first confidence interval is at ±σ (70%) and the second one at ±1.96σ (95%). The lower graph indicates the time of the meals and quantities of CHO ingested each minute (the duration of the meals is 15 min).
Discussion
The PIDD controller, based on a linearization of our new nonlinear model, achieves satisfactory glycemic regulation in a group of virtual adult T1DM patients from the UVa/Padova metabolic simulator. To compare the performances with those of other controllers, we chose to use the same scenario and experimental conditions as Cameron and coauthors.26 They developed a novel “extended model predictive controller” (EMPC) with a modified cost function to take into account the uncertainty of the prediction in the future BG values and to minimize the combined risk of hypoglycemia and hyperglycemia. They demonstrated the improved performance of EMPC against a PID controller and a basic MPC controller. The PID controller was actually a proportional derivative controller. The weights for proportional and derivative terms were optimized to minimize the average BG risk index (LBGI + HBGI). The MPC controller used a prediction horizon of 300 min and a specific prediction algorithm to detect and to estimate the meals. The performance comparisons (adult 9 excluded) of the controllers are summarized Table 3. The time spent with glucose levels in target range (70–180 mg/dl) and the hyperglycemic range are not different between MPC (79.6% and 19.9%, respectively) and PIDD (77% and 16%, respectively). Severe hypoglycemic events are similar, whereas minor hypoglycemic readings are more frequent with the PIDD controller (6% versus 0.2%). In our simulation, the sensor noise was taken into account by repeating the scenario 25 times. Such a process allows the robustness to noise to be evaluated.
Table 3.
Performance Indicators of the Different Controllers (Blood Glucose in mg/dl)
| Algorithm | Mean BG | Interquartile range | %BG 70–180 | %BG < 50 | %BG 50–70 | %BG > 250 | %BG 180–250 |
|---|---|---|---|---|---|---|---|
| PIDD | 135 (standard deviation ± 10) | 66 | 77% (±13%) | 0.8% (±3%) | 6% (±5.8%) | 0.3% (±0.9%) | 16% (±9%) |
| PID | 156 | 54.9 | 72.6% | 0% | 0% | 0.6% | 26.8% |
| MPC | 151 | 54.8 | 79.6% | 0% | 0.2% | 0.3% | 19.9% |
| EMPC | 147 | 45.0 | 84.3% | 0% | 0.7% | 0% | 15% |
In a noise-free case, there are no events of hypoglycemia, as the minimum glycemia measured is 69.55 mg/dl. Furthermore, in the simulator, the implemented noise has a positive mean, which explains the incidence of hypoglycemia.
The results of the controllers from Cameron and coauthors26 are better than ours in terms of hypoglycemic events. However, they ran their scenario only one time, which questions the use of noisy sensor measurements. In Table 1, we indicate the number of tests (among the 25 scenarios) with severe hypoglycemia events. The maximum number of this instance is five for adult 5. Furthermore, in the implementation of our controller, no upper limit on the injected insulin was considered, but Cameron and coauthors26 had used a fixed limit. Thus, our presented results are more robust.
Finally, as compared with MPC, our PIDD controller is more easily implementable. The design of the controller is straightforward once the parameters of the model are identified. Furthermore, such controllers are particularly robust without meal announcement.
Conclusion
In this article, a PIDD controller based on a linearization of a new nonlinear control model was proposed. In comparison to previously published results of PID and MPC controllers,21 our PIDD controller achieves good regulation performance. Its performance indicators are quite similar to those of the MPC controller, with the benefit of a simpler implementation. The results obtained are better than previously proposed PID controllers, even though we considered a less constrained case (noise effect and no upper limit on injected insulin). Then, even if the controller exhibits some severe hypoglycemia events, considering a safety limit on the total injected insulin dose would improve the results as well as working on a better adjustment of the controller gain. The identification process is subject to further research to consider data obtained from a continuous glucose monitoring sensor. The range of data used in the identification process should be larger to take into account the noise and should include meal data. Consequently, we are currently working to add a model of diffusion of the ingested glucose in the new nonlinear model to address this issue.
Glossary
- (BG)
blood glucose
- (CHO)
carbohydrate
- (EMPC)
extended model predictive controller
- (HBGI)
high blood glucose index
- (LBGI)
low blood glucose index
- (MPC)
model predictive control
- (PID)
proportional integral derivative
- (PIDD)
proportional integral derivative with double phase lead
- (T1DM)
type 1 diabetes mellitus
- (UVa/Padova metabolic simulator)
University of Virginia/Padova T1DM metabolic simulator
Funding
This work was supported by Supelec, Cesson-Sévigné, France, and University of Rennes 1, France.
References
- 1.Parker RS, Doyle FJ, 3rd, Ward JH, Peppas NA. Robust H∞ glucose control in diabetes using a physiological model. AIChE J. 2000;46(12):2537–2549. [Google Scholar]
- 2.Magni L, Raimondo DM, Bossi L, Man CD, De Nicolao G, Kovatchev B, Cobelli C. Model predictive control of type 1 diabetes: an in silico trial. J Diabetes Sci Technol. 2007;1(6):804–812. doi: 10.1177/193229680700100603. [DOI] [PMC free article] [PubMed] [Google Scholar]
- 3.Soru P, De Nicolao G, Toffanin C, Dalla Man C, Cobelli C, Magni L. AP@home Consortium. MPC based Artificial Pancreas: Strategies for individualization and meal compensation. Annu Rev Contr. 2012;36(1):118–128. [Google Scholar]
- 4.Clarke WL, Anderson S, Breton M, Patek S, Kashmer L, Kovatchev B. Closed-loop artificial pancreas using subcutaneous glucose sensing and insulin delivery and a model predictive control algorithmml: the Virginia experience. J Diabetes Sci Technol. 2009;3(5):1031–1038. doi: 10.1177/193229680900300506. [DOI] [PMC free article] [PubMed] [Google Scholar]
- 5.Kovatchev B, Cobelli C, Renard E, Anderson S, Breton M, Patek S, Clarke W, Bruttomesso D, Maran A, Costa S, Avogaro A, Dalla Man C, Facchinetti A, Magni L, De Nicolao G, Place J, Farret A. Multinational study of subcutaneous model-predictive closed-loop control in type 1 diabetes mellitus: summary of the results. J Diabetes Sci Technol. 2010;4(6):1374–1381. doi: 10.1177/193229681000400611. [DOI] [PMC free article] [PubMed] [Google Scholar]
- 6.Breton M, Farret A, Bruttomesso D, Anderson S, Magni L, Patek S, Dalla Man C, Place J, Demartini S, Del Favero S, Toffanin C, Hughes-Karvetski C, Dassau E, Zisser H, Doyle FJ, 3rd, De Nicolao G, Avogaro A, Cobelli C, Renard E, Kovatchev B. International Artificial Pancreas Study Group. Fully integrated artificial pancreas in type 1 diabetes: modular closed-loop glucose control maintains near normoglycemia. Diabetes. 2012;61(9):2230–2237. doi: 10.2337/db11-1445. [DOI] [PMC free article] [PubMed] [Google Scholar]
- 7.Phillip M, Battelino T, Atlas E, Kordonouri O, Bratina N, Miller S, Biester T, Stefanija MA, Muller I, Nimri R, Danne T. Nocturnal glucose control with an artificial pancreas at a diabetes camp. N Engl J Med. 2013;368(9):824–833. doi: 10.1056/NEJMoa1206881. [DOI] [PubMed] [Google Scholar]
- 8.Hovorka R, Canonico V, Chassin LJ, Haueter U, Massi-Benedetti M, Orsini Federici M, Pieber TR, Schaller HC, Schaupp L, Vering T, Wilinska ME. Nonlinear model predictive control of glucose concentration in subjects with type 1 diabetes. Physiol Meas. 2004;25(4):905–920. doi: 10.1088/0967-3334/25/4/010. [DOI] [PubMed] [Google Scholar]
- 9.Hovorka R. Closed-loop insulin delivery: from bench to clinical practice. Nat Rev Endocrinol. 2011;7(7):385–395. doi: 10.1038/nrendo.2011.32. [DOI] [PubMed] [Google Scholar]
- 10.Hovorka R, Kumareswaran K, Harris J, Allen JM, Elleri D, Xing D, Kollman C, Nodale M, Murphy HR, Dunger DB, Amiel SA, Heller SR, Wilinska ME, Evans ML. Overnight closed loop insulin delivery (artificial pancreas) in adults with type 1 diabetes: crossover randomised controlled studies. BMJ. 2011;342:d1855. doi: 10.1136/bmj.d1855. [DOI] [PMC free article] [PubMed] [Google Scholar]
- 11.Elleri D, Allen JM, Kumareswaran K, Leelarathna L, Nodale M, Caldwell K, Cheng P, Kollman C, Haidar A, Murphy HR, Wilinska ME, Acerini CL, Dunger DB, Hovorka R. Closed-loop basal insulin delivery over 36 hours in adolescents with type 1 diabetes: randomized clinical trial. Diabetes Care. 2013;36(4):838–844. doi: 10.2337/dc12-0816. [DOI] [PMC free article] [PubMed] [Google Scholar]
- 12.Abu-Rmileh A, Garcia-Gabin W, Zambrano D. Internal model sliding mode control approach for glucose regulation in type 1 diabetes. Biomed Signal Process Control. 2010;5(2):94–102. [Google Scholar]
- 13.Palerm CC. Physiologic insulin delivery with insulin feedback: A control systems perspective. Comput Methods Programs Biomed. 2011;102(2):130–137. doi: 10.1016/j.cmpb.2010.06.007. [DOI] [PubMed] [Google Scholar]
- 14.Kovács L, Benyó B, Bokor J, Benyó Z. Induced L2-norm minimization of glucose-insulin system for type I diabetic patients. Comput Methods Programs Biomed. 2011;102(2):105–118. doi: 10.1016/j.cmpb.2010.06.019. [DOI] [PubMed] [Google Scholar]
- 15.Cobelli C, Man CD, Sparacino G, Magni L, De Nicolao G, Kovatchev BP. Diabetes: models, signals, and control. IEEE Rev Biomed Eng. 2009;2:54–96. doi: 10.1109/RBME.2009.2036073. [DOI] [PMC free article] [PubMed] [Google Scholar]
- 16.Makroglou A, Li J, Kuang Y. Mathematical models and software tools for the glucose-insulin regulatory system and diabetes: an overview. Appl Num Math. 2006;56(3–4):559–573. [Google Scholar]
- 17.Balakrishnan NP, Rangaiah GP, Samavedham L. Review and analysis of blood glucose (BG) models for type 1 diabetic patients. Ind Eng Chem Res. 2011;50(21):12041–12066. [Google Scholar]
- 18.Bolie VW. Coefficients of normal blood glucose regulation. J Appl Physiol. 1961;16(5):783–788. doi: 10.1152/jappl.1961.16.5.783. [DOI] [PubMed] [Google Scholar]
- 19.Ackerman E, Rosevear JW, McGuckin WF. A mathematical model of the glucose tolerance test. Phys Med Biol. 1964;9(2):203–213. [Google Scholar]
- 20.Chee F, Fernando T. Lecture notes in control and information sciences. Berlin: Springer; 2007. Closed-loop control of blood glucose. [Google Scholar]
- 21.Bergman RN, Ider YZ, Bowden CR, Cobelli C. Quantitative estimation of insulin sensitivity. Am J Physiol. 1979;236(6):E667–E677. doi: 10.1152/ajpendo.1979.236.6.E667. [DOI] [PubMed] [Google Scholar]
- 22.Pillonetto G, Sparacino G, Cobelli C. Numerical non-identifiability regions of the minimal model of glucose kinetics: superiority of Bayesian estimation. Math Biosci. 2003;184(1):53–67. doi: 10.1016/s0025-5564(03)00044-0. [DOI] [PubMed] [Google Scholar]
- 23.Quon MJ, Cochran C, Taylor SI, Eastman RC. Non-insulin-mediated glucose disappearance in subjects with IDDM. Discordance between experimental results and minimal model analysis. Diabetes. 1994;43(7):890–896. doi: 10.2337/diab.43.7.890. [DOI] [PubMed] [Google Scholar]
- 24.Chase JG, Shaw GM, Lin J, Doran CV, Hann C, Robertson MB, Browne PM, Lotz T, Wake GC, Broughton B. Adaptive bolus-based targeted glucose regulation of hyperglycaemia in critical care. Med Eng Phys. 2005;27(1):1–11. doi: 10.1016/j.medengphy.2004.08.006. [DOI] [PubMed] [Google Scholar]
- 25.Coron JM. Control and nonlinearity. Mathematical surveys and monographs. American Mathematical Society; 2007. [Google Scholar]
- 26.Cameron F, Bequette BW, Wilson DM, Buckingham BA, Lee H, Niemeyer G. A closed-loop artificial pancreas based on risk management. J Diabetes Sci Technol. 2011;5(2):368–379. doi: 10.1177/193229681100500226. [DOI] [PMC free article] [PubMed] [Google Scholar]
- 27.Dalla Man C, Rizza RA, Cobelli C. Meal simulation model of the glucose-insulin system. IEEE Trans Biomed Eng. 2007;54(10):1740–1749. doi: 10.1109/TBME.2007.893506. [DOI] [PubMed] [Google Scholar]
- 28.Kovatchev BP, Breton M, Man CD, Cobelli C. In silico preclinical trials: a proof of concept in closed-loop control of type 1 diabetes. J Diabetes Sci Technol. 2009;3(1):44–55. doi: 10.1177/193229680900300106. [DOI] [PMC free article] [PubMed] [Google Scholar]
- 29.Wilinska ME, Hovorka R. Simulation models for in silico testing of closed-loop glucose controllers in type 1 diabetes. Drug Discov Today Dis Models. 2009;5(4):289–298. [Google Scholar]
- 30.Chin SV, Chappell MJ. Structural identifiability and indistinguishability analyses of the minimal model and a euglycemic hyperinsulinemic clamp model for glucose-insulin dynamics. Comput Methods Programs Biomed. 2011;104(2):120–134. doi: 10.1016/j.cmpb.2010.08.012. [DOI] [PubMed] [Google Scholar]
- 31.Ben Abbes I, Lefebvre MA, Cormerais H, Richard PY. A new model for closed-loop control in type 1 diabetes. Milano, Italy: Proceedings of the 18th IFAC World Congress; 2011. Aug 28–Sep 2. [Google Scholar]
- 32.Ben Abbes I, Lefebvre MA, Buisson J. Régulation de la glycémie par un correcteur de type PID réglé sur un nouveau modèle du système insuline-glucose. Grenoble, France: Proceedings of the 2012 Conférence Internationale Francophone d’Automatique (CIFA); 2012. July 4–6. [Google Scholar]
- 33. MATLAB and system identification toolbox release 2010b. The MathWorks Inc., Natick, Massachusetts.
- 34.Kovatchev BP, Straume M, Cox DJ, Farhy LS. Risk analysis of blood glucose data: a quantitative approach to optimizing the control of insulin dependent diabetes. J Theor Med. 2000;3:1–10. [Google Scholar]