Abstract
Brain tissue modelling has been an active area of research for years. Brain matter does not follow the constitutive relations for common materials and loads applied to the brain turn into stresses and strains depending on tissue local morphology. In this work, a hyperviscoelastic fibre-reinforced anisotropic law is used for computational brain injury prediction. Thanks to a fibre-reinforcement dispersion parameter, this formulation accounts for anisotropic features and heterogeneities of the tissue owing to different axon alignment. The novelty of the work is the correlation of the material mechanical anisotropy with fractional anisotropy (FA) from diffusion tensor images. Finite-element (FE) models are used to investigate the influence of the fibre distribution for different loading conditions. In the case of tensile–compressive loads, the comparison between experiments and simulations highlights the validity of the proposed FA–k correlation. Axon alignment affects the deformation predicted by FE models and, when the strain in the axonal direction is large with respect to the maximum principal strain, decreased maximum deformations are detected. It is concluded that the introduction of fibre dispersion information into the constitutive law of brain tissue affects the biofidelity of the simulations.
Keywords: brain tissue, constitutive modelling, fibre dispersion, anisotropy
1. Introduction
The investigation of the mechanical behaviour of brain tissue has been an active area of research for several years [1–8]. As brain matter does not follow the constitutive relations for common engineering materials, identifying a constitutive law able to accurately describe its behaviour is indeed difficult. Many researchers have focused their studies on characterizing the response of the tissue to externally applied mechanical loads. In a study by Brands et al. [3], linear and angular accelerations were applied to the skull and the brain was modelled with a nonlinear viscoelastic constitutive equation such that the nearly incompressible behaviour was represented with numerical accuracy; Prange & Margulies [9] studied the corpus callosum and the corona radiata, finding that the shear modulus varied depending on the shearing direction. Again, Velardi et al. [10] tested the tensile behaviour of brain tissue and proposed an anisotropic constitutive equation. Kleiven [5] suggested modelling the brain material using a second-order Ogden hyperelastic law to account for differences in compression and tension.
The challenge of brain tissue modelling lies in the complexity of the brain, which is made of multiple substructures marked by different mechanical properties. Understanding the correlation between the internal structure of the tissue and the macroscopic mechanical properties is therefore important, especially because loads applied to the brain turn into stresses and strains depending on the local morphology and composition. In addition, experimental results from different studies reveal a large discrepancy in the existing data [11]: this lack of consistency is probably due to both the great intra- and intersubject variability and the different experimental protocols. It seems, at present, not feasible to propose a constitutive model of brain tissue suitable for all loading conditions [12]. Nonetheless, when it comes to considering the tissue response to large strains, which are distinctive of traumatic brain injury (TBI), experimental results reveal inhomogeneous [13], nonlinear [14,15], viscoelastic [16–19] and anisotropic mechanical behaviour [9,10,20–22].
In particular, the integration of anisotropy into a constitutive framework is crucial to ensure the reliability of calculations in a computational head model aimed at TBI prediction: in vitro analysis of brain injury mechanisms [23–26] suggests stretching of white matter and the consequent local physiological impairment of neuronal cells as a potential mechanism of microstructural injury. The susceptibility of the tissue appears to be the result of both viscoelastic properties and highly organized structure in white matter tracts [24].
Consequently, classical tissue-based metrics may not be adequate to describe the injury mechanism, especially when shear strains or invariants of the strain tensor are used. For TBI prediction, an accurate representation of the anisotropic behaviour is needed. Unfortunately, this goal has not been achieved yet, because current finite-element (FE) models incorporate only isotropic homogeneous features into injury analysis [5,16,18,27].
This study aims at being the first step towards enhancing brain injury predictions of FE head models. It is proposed to assign a hyperviscoelastic fibre-reinforced anisotropic material to the brain to account for time–rate and local morphological dependence on the mechanical response. The alignment of the axons plays an important role and is incorporated in the model through the use of the mechanical parameter k [28,29] that measures the level of dispersion of the fibres. To choose the numerical value of this variable, a new correlation between k and fractional anisotropy (FA) of diffusion tensor images (DTIs) is proposed. Finally, this relationship is tested against experimental data for tension and compression of brain tissue and is used to assign values of k into a previously developed head model.
2. A constitutive model for brain tissue
2.1. Anisotropic hyperviscoelastic formulation
As the experimental data show that the brain has inhomogeneous [13], nonlinear [14,15], viscoelastic [16–19] and anisotropic mechanical behaviour [9,10,20–22], it is reasonable to assign the brain tissue a hyperviscoelastic fibre-reinforced anisotropic constitutive law. In this study, the model proposed by Cloots et al. [28] is used to account for the anisotropy of the brainstem and the corpus callosum. This material model is capable of integrating information on tissue composition and to describe time–rate dependence in the mechanical response. The hyperelastic strain energy potential is given by
| 2.1 |
where the last term on the right-hand side is taken from the Gasser–Ogden–Holzapfel (GOH) form [29] calculated for only one fibre family
 |
2.2 |
In this form, W defines the strain energy per unit of reference volume, G represents the shear modulus,  is the first invariant of the isochoric Cauchy–Green strain tensor, K stands for the bulk modulus, J is equal to the determinant of the deformation gradient and k1 and k2 describe the fibre stiffness. The deformation of the fibres is described by the strain-like quantity
  that is the function of the isochoric Cauchy–Green strain tensor (
 ), the fibre unit vector in the undeformed configuration (
 ) and the dispersion parameter (k). Again, in this model fibres contribute their mechanical strength only in tension and not in compression [29]; by means of the Macaulay brackets
  ,
,  becomes zero if
  is negative.
The Cauchy stress tensor is then expressed as
| 2.3 |
where the hydrostatic part is defined as
| 2.4 |
while the deviatoric part is
 |
2.5 |
in which I represents the unit tensor and  is the deviatoric isochoric Finger tensor
  . The viscoelastic behaviour is taken into account by adding time dependency on the second Piola–Kirchhoff stress tensor (S) that is expressed as follows:
 |
2.6 |
where  is the deviatoric elastic second Piola–Kirchhoff stress tensor as the volumetric behaviour is assumed to be independent of time. τ represents the time variable, g∞ is the long-term parameter recovering the role of G and k1 in the limit,
  define the relaxation parameters of the viscoelastic models and τi are the time constants. A summary of the viscoelastic properties of the brain tissue can be found in table 1. Numerical values for viscoelasticity are chosen in agreement with Cloots et al. [28]; in turn, those parameters were based on a study by Kleiven [5].
Table 1.
Viscoelastic parameters for the brain tissue used in the head model.
| parameter | value |
|---|---|
| g1 for τ1 = 10−6 s | 0.7685 |
| g2 for τ2 = 10−5 s | 0.1856 |
| g3 for τ3 = 10−4 s | 0.0148 |
| g4 for τ4 = 10−3 s | 0.0190 |
| g5 for τ5 = 10−2 s | 0.0026 |
| g6 for τ6 = 10−1 s | 0.0070 |
| g∞ | 0.0025 |
The constitutive variables G, k1, k2, K are assigned the same values that Cloots et al. [28] proposed. A summary of the material properties can be found in table 2. A value of 1214 Pa is assigned to the shear modulus G while 11 590 Pa is assigned to the mechanical parameter k1 in respect of the ratio of 0.105 experimentally identified by Ning et al. [20]. A value of 0 is chosen for k2 as the fibre contribution to the stiffness is assumed to be linear [30]. The bulk modulus K, even though experimental observations show that its magnitude is around 2.1 GPa, is instead assigned a value of 50 MPa to prevent volumetric locking of the elements during the FE simulation. As K is still much greater than the shear modulus, the same pressure and strain response are found when the bulk modulus is reduced by a couple of orders of magnitude. As can be seen from table 2, to quantify the dispersion parameter k a novel approach is proposed in this study (2.2). Particular attention is paid to the level of fibre alignment in the material in order to account for the internal load-carrying mechanism of the individual constituents. To choose the numerical value of this mechanical variable, a correlation with DTI FA is established [31].
Table 2.
Properties of brain tissue: parameters refer to the hyperviscoelastic fibre-reinforced anisotropic formulation of equation (2.1).
| parameter | value |
|---|---|
| G (Pa) | 1214 |
| K (MPa) | 50 |
| k depending on FA | |
| k1 (Pa) | 11 590 |
| k2 | 0 |
2.2. Connecting the fibre-reinforcement dispersion parameter with fractional anisotropy
In this work, brain tissue is assumed to be a fibre-reinforced material. According to the anatomy of the tissue [32], bundles of axons connecting different parts of the nervous system represent the fibres while neuron bodies, blood vessels, glial cells and supportive cells constitute the matrix of the material [33]. To quantify the value of k, a new relationship with FA from DTIs is proposed and discussed. The idea behind this formulation is that mechanical anisotropy and diffusion anisotropy can be linked, being two distinct expressions of the same property [34–36].
Consider first the mechanical dispersion parameter k. In the hyperviscoelastic fibre-reinforced anisotropic constitutive law, distributed fibres are represented in a continuum sense by means of a generalized structure tensor H [29] that is defined as
| 2.7 |
The existence of a density function ρ(M) is postulated and is referred to as an orientation density function that describes the distribution of fibres in the initial configuration Ω 0 [29]; M is therefore an arbitrary unit vector which can be characterized in terms of two Eulerian angles  and
and 
| 2.8 |
in which {e1,e2,e3} are the axes of a system of rectangular Cartesian coordinates. The symmetry of the function (ρ(M) = ρ(−M)) is required, because each fibre is double counted by the chosen range of values of the Eulerian angles; moreover, the density function is normalized such that the total number of fibres in the unit sphere is equal to 1,
| 2.9 |
where  and w is the unit sphere. With these assumptions, the generalized structure tensor can be compacted by
| 2.10 |
considering the summation over i and j from 1 to 3 and the coefficients defined as
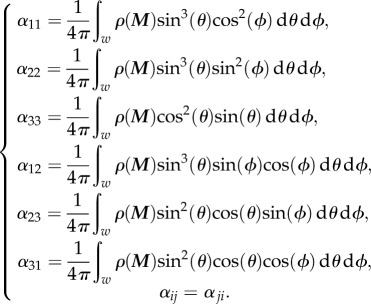 |
2.11 |
For the general continuum representation of distributed fibres, it is assumed that only one family of fibres exists for each bundle of axons and rotational symmetry about one principal direction is considered. As a matter of fact, in the brain a bundle of axons develop preferentially in one direction; therefore, transversely isotropic behaviour can be assigned to the material. In this way, the general orientation density function ρ(M(θ,ϕ)) depends only on θ as ρ(θ), the normalization condition becomes
| 2.12 |
and the off-diagonal coefficients of H vanish. Without loss of generality, the principal direction can be taken as a0 and superimposed on the basis vector e1. Calculations for the diagonal terms of the tensor consequently provide the following results:
 |
2.13 |
The new compact form of the structure tensor H is
| 2.14 |
and being a0 = [1 0 0] the structure tensor can be rewritten as
 |
2.15 |
It therefore becomes a second-order tensor depending only on k. This tensor is visualized in the three-dimensional space as an ellipsoid where the lengths of the main axes correspond to the eigenvalues and their direction to the respective eigenvectors. For H, the eigenvalues are the diagonal terms λ1 = 1–2k, λ2 = k and λ3 = k, while the respective eigenvectors are v1 = [1 0 0], v2 = [0 1 0] and v3 = [0 0 1]. In general, the eccentricity of the ellipsoid is related to the ratio
| 2.16 |
Moreover, when k = 1/3 the structural tensor corresponds to a sphere (figure 1a); instead, a k-value of 0 makes the ellipsoid collapse into a line (figure 1c). Figure 1 illustrates the variation in the shape of the generalized structure ellipsoid depending on the k-value, passing from a perfectly isotropic condition to a perfectly transversely anisotropic condition.
Figure 1.
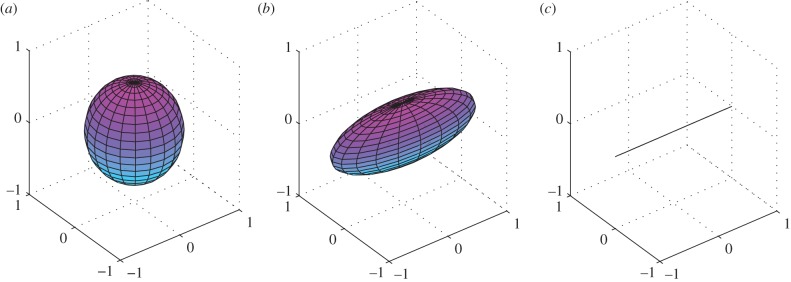
Structure tensor H represented for different values of k. From left to right, the passage from a perfectly isotropic condition to a perfectly transversely anisotropic one is illustrated: (a) k = 1/3; (b) k = 1/5; and (c) k = 0. (Online version in colour.)
In order to assign values to the dispersion parameter k, a connection between mechanical anisotropy and FA from DTIs is needed. This assumption is justified considering the DTI framework: by applying a specific series of magnetic gradients [31], the imaging technique measures the diffusion orientation of water molecules in a tissue and, specifically in brain tissue, water tends to diffuse along its ordered structures, which are axonal fibres. Consequently, the determination of diffusion orientation and its degree of anisotropy is considered to correspond to the numerical quantification of the main direction of the fibres in the brain tissue and their degree of mechanical anisotropy. The same hypothesis was used in previous studies [34–36].
The three-dimensional spatial representation of the structural tensor H is coupled with the diffusion tensor D obtained from diffusion tensor imaging. Diffusion tension formalism provides an approximation of the mean diffusion of water molecules in a three-dimensional ellipsoid; its properties are defined by the three lengths of the axes (λ1, λ2, λ3) and their orientations (v1, v2, v3). To keep track of the parameters, a 3 × 3 tensor D is used, which is related to them by a diagonalization procedure
 |
2.17 |
where λi is the i-th eigenvalue and vi is the corresponding eigenvector.
To link k and FA, the previous theoretical assumptions are held true. The principal direction is considered to be a0 = [1 0 0] and the behaviour of the material is assumed to be transversely isotropic. These assumptions correspond to λ1 being the greatest eigenvalue of the diffusion tensor and v1 (main eigenvector) being a0. Moreover, λ2 = λ3 as the mechanical behaviour is assumed to be transversally isotropic. Considering the mathematical definition of FA,
 |
2.18 |
when λ2 = λ3 this relation reduces to
 |
2.19 |
Considering the three-dimensional ellipsoidal spatial representation of D, the shape of the diffusion ellipsoid is related to FA, and specifically the eccentricity is related to the ratio λ1/λ2. As for the structure ellipsoid (figure 1), if isotropic features are detected (λ1 = λ2 = λ3), the diffusion tensor can be spatially represented by a sphere; for perfect anisotropic conditions ( ), instead, the diffusion ellipsoid collapses into a line. As both H and D define the numerical representation of the structure of the fibres in the tissue, in order to have the same degree of anisotropy, the two ellipsoids must coincide in shape and orientation. As a consequence,
| 2.20 |
Substituting into the FA definition (equation (2.19)),
 |
2.21 |
It can be easily demonstrated that, according to the theory, for k = 1/3 the corresponding FA value is FA = 0, which represents a perfectly isotropic condition; for k = 0, instead, the corresponding FA value is FA = 1, which stands for a perfectly transversely anisotropic situation. Equation (2.21) is graphically expressed in figure 2.
Figure 2.
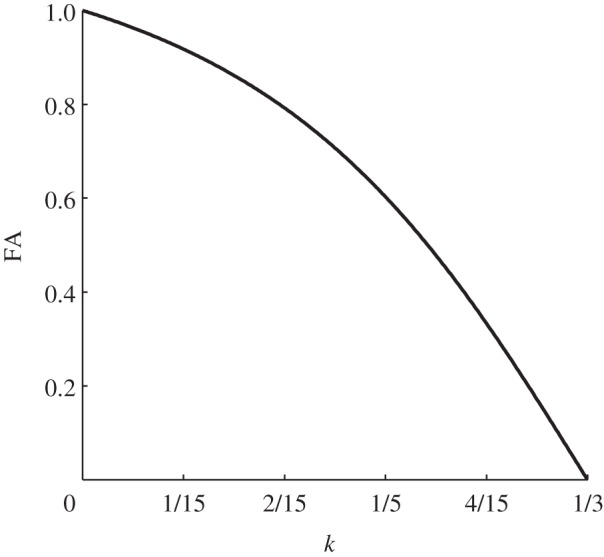
Relation between FA and fibre-reinforcement dispersion parameter (k). Refer to equation (2.21).
2.3. Fibre-reinforcement dispersion parameter
To assign numerical values to k, a discretization of equation (2.21) is needed. In this work, a mapping method is proposed to couple orientation information and mechanical fibre reinforcement. The heterogeneous anisotropic behaviour of the brain tissue is considered by defining several anisotropic materials that differ only in the degree of anisotropy defined by k. These distinct materials are then assigned to the regions of the brain marked by different distributions of the axonal fibres. We consider isotropic mechanical behaviour for FA values smaller than 0.2 whereas for higher values of fibre dispersion the range of FA is divided into eight increments (0.2–0.3, 0.3–0.4, …, 0.9–1.0) and for each interval the maximum FA value is chosen to compute the corresponding k. Table 3 illustrates the discretized relation between the fibre-reinforcement dispersion parameter and the FA. This is a new proposed relation that is justified mathematically in the literature [37,38]: according to Cercignani et al. [38], the grey matter of healthy subjects is characterized by a low degree of anisotropy and FA values are found to vary in a range of 0–0.2. As the behaviour of grey matter is extensively assumed to be isotropic [7,10,15,39], in this study a value of k = 1/3 is assigned to the dispersion parameter for each element of the FE model with FA in that range (table 3). For higher values of fibre alignment, instead, a significant variation in mechanical behaviour is considered for increments of FA of 0.1; according to equation (2.21), this corresponds to a variation of at least 17% in the ratio of the axes of the structure ellipsoid. Finally, to map the complete diffusion information within the FE head model, a FA value is assigned to each FE that belongs to brain tissue.
Table 3.
Discretization of equation (2.21) (FA–k) for FE simulations.
| FA range | k-value |
|---|---|
| 0.0–0.2 | 0.3333 |
| 0.2–0.3 | 0.2732 |
| 0.3–0.4 | 0.2500 |
| 0.4–0.5 | 0.2273 |
| 0.5–0.6 | 0.2000 |
| 0.6–0.7 | 0.1667 |
| 0.7–0.8 | 0.1282 |
| 0.8–0.9 | 0.0769 |
| 0.9–1.0 | 0.0000 |
A DTI dataset of a healthy patient with a spatial resolution of 2 × 2 × 3.6 mm is used: the protocol involves a mesh voxelization and an affine registration between the DTI brain and the voxelized FE brain mask (3D SLICER v. 4.2). The geometry of the DTI brain is aligned with the corresponding geometry of the FE model brain and the FA map is calculated at FE resolution. The anisotropic behaviour is finally assigned elementwise according to table 3.
3. Finite-element simulations
3.1. Tension and compression test
In this section, simple FE tests of tension–compression are presented and discussed. The focus of the simulations is to investigate the mechanical behaviour of the hyperviscoelastic fibre-reinforced material when the dispersion parameter k is varied. Three-dimensional FE models that mimic cylindrical brain tissue samples are developed in the FE code LS-Dyna 971 (figure 3). The geometry of the samples is modelled as a cylinder with an initial diameter of 30 mm and height of 10 mm. Eight-node hexahedral solid elements with reduced integration and hourglass control are used. At each node of the top plane of the models, x and y motion is constrained while a constant displacement of 3 mm is imposed along the z-axis in the positive direction; this procedure corresponds to applying a tension to the samples with a constant velocity of 5 mm min−1. At a later stage, for each node of the top plane of the models, the same displacement is imposed in the negative direction of the z-axis. In this way, a compression is applied to the sample at a constant velocity of 5 mm min−1 (figure 3).
Figure 3.
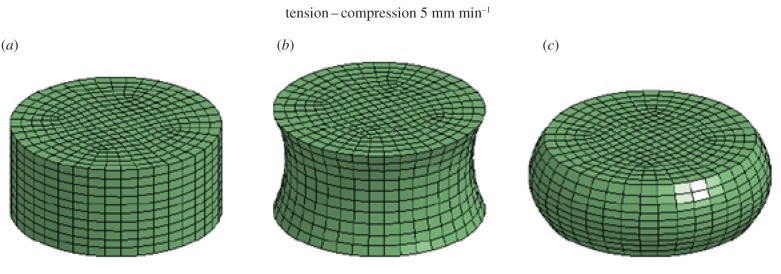
Three-dimensional FE model of brain tissue samples. (a) The original configuration is shown (λ = 0). (b) A tension is applied and the new configuration of the model is illustrated at 20 s (λ = 1.3). (c) A compression is applied and the new configuration of the model is presented at 35 s (λ = 0.8). (Online version in colour.)
To investigate the influence of the fibre-reinforcement dispersion parameter, FE simulations are performed: for each simulation, the cylinder is assigned the proposed hyperviscoelastic fibre-reinforced anisotropic constitutive law with a different value of the parameter k, according to table 3. The GOH model is supplied to LS-DYNA 971 as a user subroutine. The custom executable was written by Cloots et al. [28] and it is invoked in the input deck using user-defined material with appropriate input parameters.
Figure 4 illustrates the variation of the stress–stretch curves with the level of fibre alignment and the angle of main orientation of the fibres: when the principal direction is aligned in the direction of force (figure 4a), a higher degree of anisotropy is shown to stiffen the material; the more fibres are aligned, the more they resist the deformation. As a consequence, higher tensions are detected in correspondence with lower values of stretch. When fibres are not oriented in the same direction of the load, they take a minor part in stress transfer. Figure 4b,c shows the response of the models for a main orientation of 45° and 90° with respect to the z-axis. The behaviour of the isotropic cylinder (k = 0.3333) is independent of the direction of load. For other values of k, lower stresses are detected in correspondence with higher values of stretch and the contribution of the fibres decreases with increasing fibre alignment. Independent of the angle of main orientation, a significant change is noted for FA values higher than 0.4 (corpus callosum, corona radiata, etc.); this variation reduces with increasing dispersion of the fibres. From figure 4, it can be seen that fibres contribute their mechanical strength only in tension and not in compression: this is in agreement with the theoretical assumptions of the GOH model [29].
Figure 4.
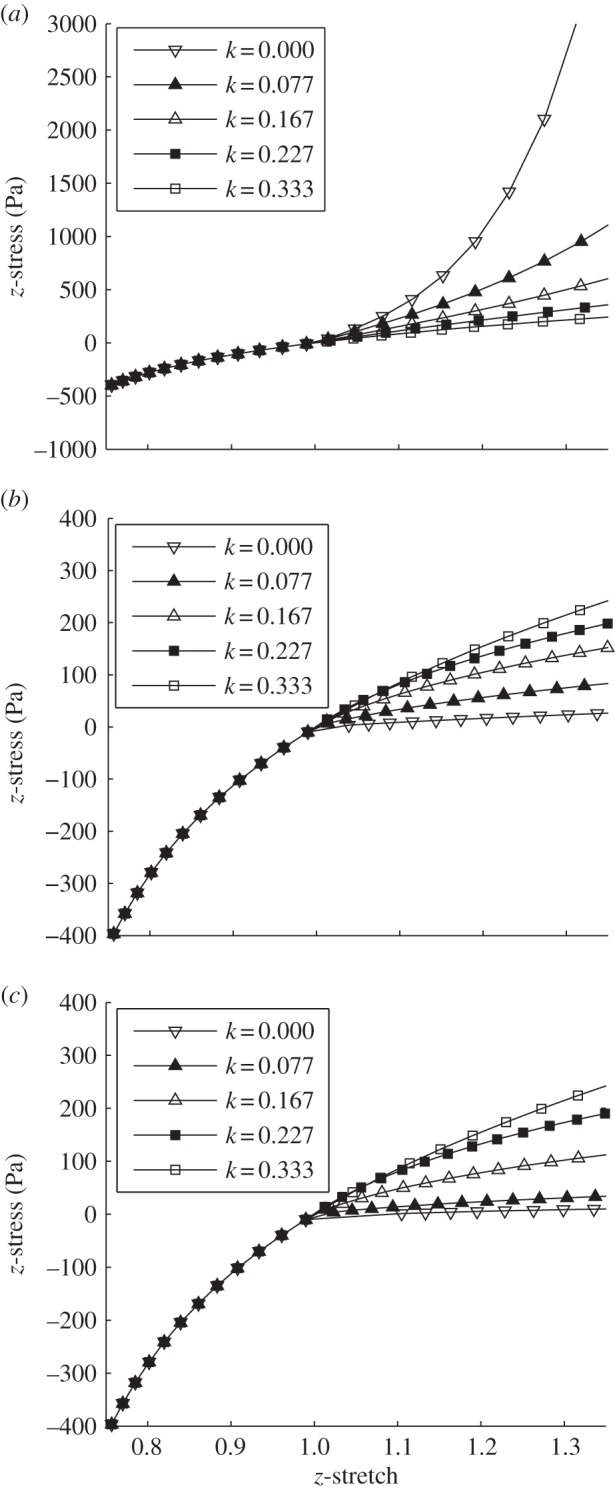
z-stress plotted as a function of z-stretch for various fibre-reinforcement dispersion parameters k and different angles of main orientation of the fibres. From top to bottom: (a) fibres are oriented in the direction of load; (b) fibres are oriented with an angle of 45°; and (c) fibres are perpendicular to the direction of load.
To give a complete analysis of the influence of the fibre-reinforcement dispersion parameter, experimental data collected by Franceschini [40] are then fitted for different regions of the brain assuming FA values according to DTI calculations. The results of the simulations are compared with experimental stress–stretch curves with the purpose of validating the relationship in equation (2.21) and of verifying that mechanical and diffusion anisotropy can be linked. The occipital lobe, frontal lobe, parietal lobe, corona radiata, thalamus and corpus callosum are assigned FA values according to the literature; subsequently, stress–stretch curves from these regions are compared with results from the simulations obtained for k-values correlated to the FA range (minimum and maximum values). In the simulations, the principal direction of the fibres is aligned in the direction of force; therefore, only brain tissue samples harvested in the same direction as the principal orientation of the fibres are considered. To determine the main direction, brain tractography is performed in 3D Slicer: a DICOM dataset with a spatial resolution of 2 × 2 × 3 : 6 mm is used; images refer to a healthy subject and were acquired using a Siemens Tim Trio scanner operating at 3.0 T with an echo time of 91.4 ms and a repetition time of 5200 ms. The fibre principal direction is assumed to be the superior–inferior orientation for the parietal and frontal lobe (figure 5a) and the thalamus (figure 5b) while the lateral direction is considered to be the principal one for the corpus callosum (figure 5c). Table 4 summarizes the properties of the different brain regions and the k-values used to perform the simulations. According to Bozzali et al. [41] and Lee et al. [42], the occipital lobe is assumed to have an FA lower than 0.2 (k = 0.3333 for FA = 0, k = 0.2943 for FA = 0.2) and the temporal and parietal lobes are assigned an FA value in the range of 0.2–0.3 (k = 0.2943, k = 0.2732). The thalamus is characterized by  (k = 0.2732, k = 0.2500), the corona radiata has an FA value varying from 0.4 to 0.6 (k = 0.2500, k = 0.2000), whereas the corpus callosum is the most oriented part marked by an FA > 0.6 (k = 0.2000 for FA = 0.6, k = 0.1000 for FA = 0.85, k = 0.0000 for FA = 1.0).
Figure 5.

Brain tractography. (a) Corpus callosum: fibre principal orientation is in the lateral direction (A, anterior; P, posterior; L, left; R, right). (b) Frontal and parietal lobe: fibre principal orientation is in the superior–inferior direction (A, anterior; P, posterior; S, superior; I, inferior). (c) Thalamus: fibre principal orientation is in the superior–inferior direction (A, anterior; P, posterior; S, superior; I, inferior).
Table 4.
FA range from DTIs and resulting k-range used in experiments for different brain regions.
| brain region | FA | k-value |
|---|---|---|
| occipital lobe | 0.0–0.2 | 0.3333; 0.2943 |
| frontal and parietal lobe | 0.2–0.3 | 0.2943; 0.2732 |
| thalamus | 0.3–0.4 | 0.2732; 0.2500 |
| corona radiata | 0.4–0.6 | 0.2500; 0.2000 |
| corpus callosum | 0.6–1.0 | 0.2000; 0.1000; 0.0000 |
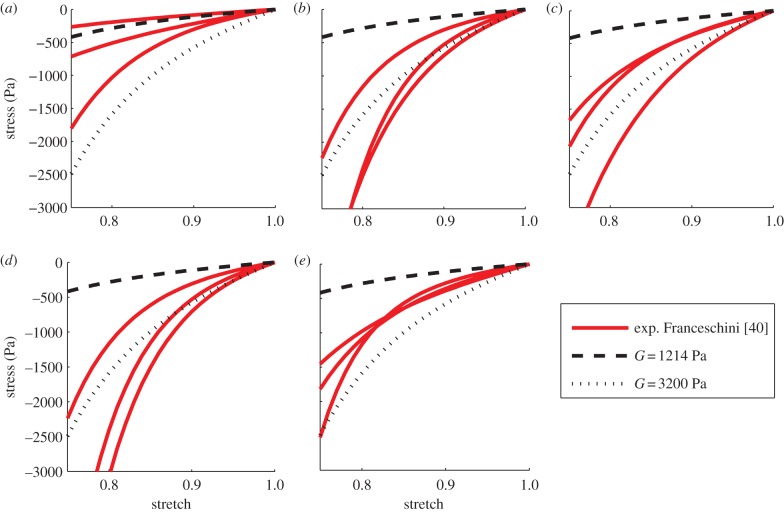
First, compression only is analysed and the GOH model is assigned parameters according to tables 1, 2 and 4. Considering the lack of contribution to the stiffness of the axonal fibres under compressional loads [29], the same response is detected for various values of k. Figure 6 illustrates the comparison between experimental and simulated curves for each brain region; three samples tested by Franceschini [40] in the principal direction of the fibres are used as a reference. As can be seen from the graphs, for G = 1214 Pa, the mechanical behaviour of the brain matter is not well represented. For this value of the material shear modulus, a more compliant response is notable for the hyperviscoelastic fibre-reinforced material model, with the only exception being the occipital lobe where the experimental curves are better fitted. For the other areas of the brain, experimental data show a stiffer behaviour which is related neither to the level of alignment of the fibres nor to the localization of the samples. A significant difference can only be noted between grey and white matter, suggesting that the organization of the components plays a limited role in the mechanical response of the tissue under compression.
Figure 6.
Experimental and simulated curves under compression for various values of G. (a) For the occipital lobe, experimental data refer to Franceschini [40] curves 4.16, A10 and A11. (b) For the frontal and parietal lobe, data refer to Franceschini [40] curves 4.7, A5 and A15. (c) For the thalamus, data refer to Franceschini [40] curves 4.10, A21 and A23. (d) For the corona radiata, data refer to Franceschini [40] curves 4.7, A15 and A16. (d) For the corpus callosum, data refer to Franceschini [40] curves 4.12, B14 and A2. (Online version in colour.)
Therefore, the behaviour of the material model under compression is modified and a parametric study conducted to better fit the experimental data. The shear modulus G is the only parameter contributing under compression. Reperforming calculations with G = 3200 Pa generally improves the representation of the experimental behaviour (figure 6).
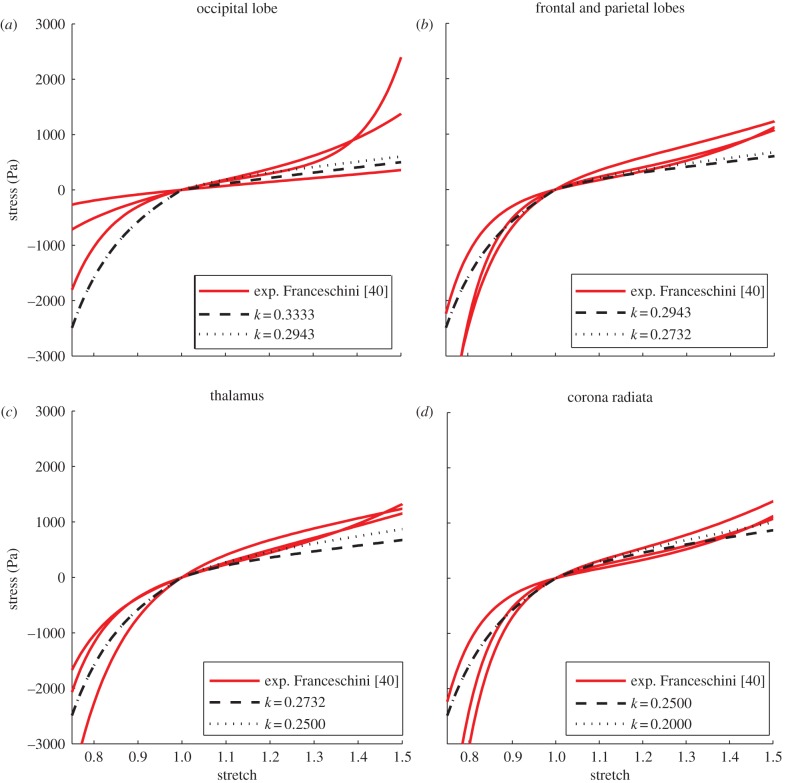
For G = 3200 Pa, tension–compression tests for different areas of the brain are then analysed. According to Ning et al. [20], k1 is adjusted to 30 475 Pa with respect to an empirical ratio of 0.105. Stress–stretch curves obtained from simulations are plotted against experimental curves extracted by Franceschini [40]. As can be seen from the graphs (figures 7 and 8), the experimental brain tissue response is well represented. On average, a high correlation is notable between the experimental and the simulated data and a mean r-value of 0.9261 is obtained (table 5). p-values are found to be smaller than 0.001. It can thus be claimed that equation (2.21) is able to describe the relationship existing between the fibre-reinforcement dispersion parameter and FA. Confirming the previous observation, the variation in k affects the stiffness of the material for FA values higher than 0.4 (corpus callosum, corona radiata), while the contribution reduces with increasing dispersion of the fibres (thalamus, frontal and parietal lobes and occipital lobe). For the less anisotropic areas, experimental data suggest that the ratio G/k1 should be better investigated.
Figure 7.
Tensile–compressive experimental and simulated curves for different areas of the brain: see table 4 for details of the location and fibre dispersion. Refer to figure 6 for the specification of the experimental data [40]. (Online version in colour.)
Figure 8.
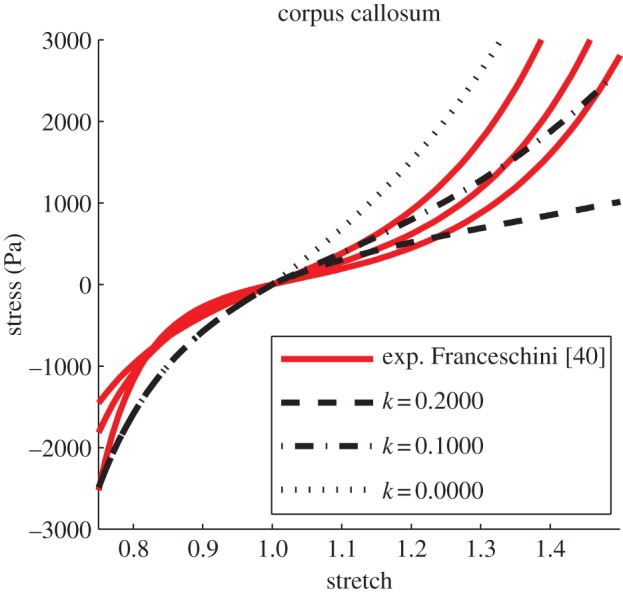
Tensile–compressive experimental and simulated curves in the corpus callosum: see table 4 for details of fibre dispersion. Refer to figure 6 for specification of the experimental data [40]. (Online version in colour.)
Table 5.
Correlation between experimental and simulated stress–stretch curves (figures 7 and 8). r-values are calculated for different areas of the brain.
| brain area | curve 1 | curve 2 | curve 3 |
|---|---|---|---|
| occipital lobe (k = 0.3333) | 0.8040 | 0.7283 | 0.8685 |
| occipital lobe (k = 0.2943) | 0.8220 | 0.7582 | 0.8907 |
| frontal and parietal lobes (k = 0.2943) | 0.9775 | 0.9525 | 0.9876 |
| frontal and parietal lobes (k = 0.2732) | 0.9767 | 0.9504 | 0.9865 |
| thalamus (k = 0.2732) | 0.9901 | 0.9996 | 0.9887 |
| thalamus (k = 0.2500) | 0.9936 | 0.9991 | 0.9897 |
| corona radiata (k = 0.2500) | 0.9742 | 0.9441 | 0.9516 |
| corona radiata (k = 0.2000) | 0.9722 | 0.9391 | 0.9468 |
| corpus callosum (k = 0.2000) | 0.9388 | 0.7611 | 0.9331 |
| corpus callosum (k = 0.1000) | 0.9086 | 0.8858 | 0.9875 |
| corpus callosum (k = 0.0000) | 0.7987 | 0.9706 | 0.9866 |
Finally, to test the quality of the FA–k relationship, a comparison of the model with an experiment of relative brain–skull motion is performed. Data are taken from postmortem experiments by Hardy et al. [43], in which the motion between the skull and the brain was measured using a high-speed biplane X-ray and polystyrene neutral density targets (NDTs). The NDTs were implanted into the occipitoparietal and the temporoparietal regions of the brain and the cadaver head was suspended in a fixture that permits rotation and translation. In this work, results from the occipital impact C755-T2 are used [43]. A simulation that involves the KTH head model [5] is performed and the full kinematics of case C755-T2 is applied to the skull. The KTH head model, developed in the FE code LS-DYNA 971, includes a three-dimensional reproduction of the scalp, the skull, the brain, the meninges, the cerebrospinal fluid, the ventricles, 11 pairs of the largest parasagittal bridging veins and a simple neck with the extension of the spinal cord and the dura mater (figure 9). It has been compared with relative motion, intracerebral acceleration, skull fracture and intracranial pressure experiments [5]. The original constitutive laws are used with the exception of the brain, where the hyperviscoelastic fibre-reinforced anisotropic behaviour is incorporated. The dispersion parameter k is quantified for different areas of the brain according to table 3 and the protocol of par. 2.3 is applied to obtain diffusion information at the FE resolution. A summary of the properties used for the head model is given in table 6.
Figure 9.
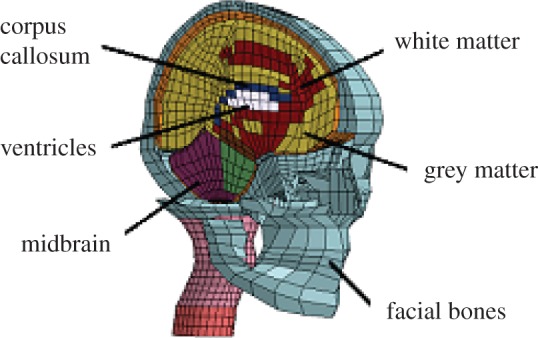
FE model of the human head: isometric view of the head model with brain exposed.
Table 6.
A summary of the properties of the head model components used in this study. K represents the bulk modulus while EA is the force/unit strain. The brain is assigned the hyperviscoelastic fibre-reinforced anisotropic material.
| tissue | Young's modulus (MPa) | density (kg dm−3) | Poisson's ratio |
|---|---|---|---|
| outer compact bone | 15 000 | 2.00 | 0.22 |
| inner compact bone | 15 000 | 2.00 | 0.22 |
| porous bone | 1000 | 1.30 | 0.24 |
| neck bone | 1000 | 1.30 | 0.24 |
| cerebrospinal fluid | K = 2.1 GPa | 1.00 | — |
| brain | GOH material | 1.04 | — |
| sinuses | K = 2.1 GPa | 1.00 | — |
| dura mater | 31.5 | 1.13 | 0.45 |
| falx | 31.5 | 1.13 | 0.45 |
| tentorium | 31.5 | 1.13 | 0.45 |
| pia mater | 11.5 | 1.13 | 0.45 |
| bridging veins | EA = 1.9 N | — | — |
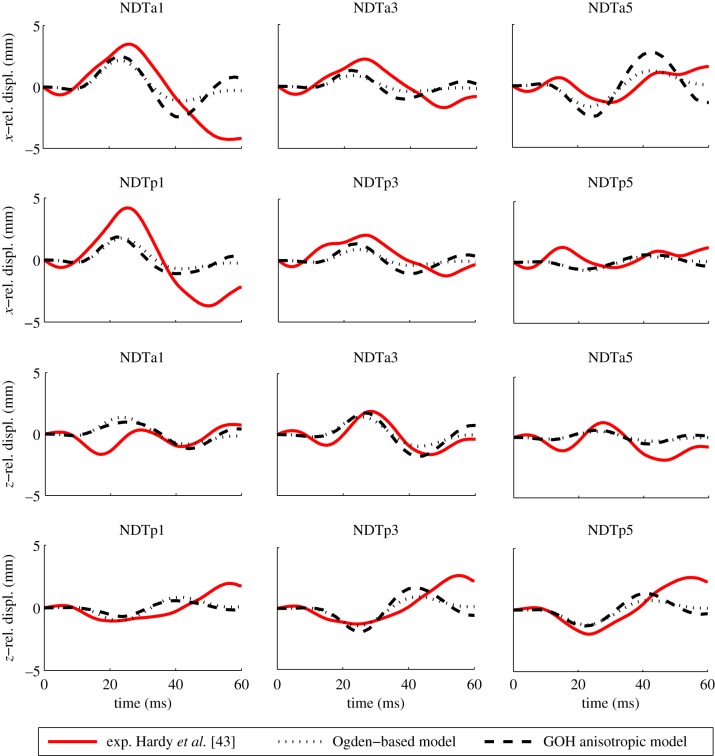
Figure 10 illustrates the comparison between the simulated relative skull–brain motion and the relative motion of the target. In order to evaluate the effects of the inclusion of the anisotropy, the response of the presented model is also compared with the prediction of the original isotropic head [5] where the brain is described by a second-order Ogden-based hyperviscoelastic law. For the anisotropic case, the model manages to reproduce both magnitude and overall shape of the three-dimensional localized brain tissue motions seen in the experiment. The magnitudes of motion are underestimated by an average of 33.7% in the x direction and an average of 28.9% in the z direction. The original Ogden-based model shows a discrepancy of 34.2% in the x direction and 31.8% in the z direction. The root mean square error is, respectively, 0.68 and 0.78 mm for the anisotropic and isotropic models. It can thus be claimed that the GOH anisotropic law is able to describe the behaviour of the brain for test C755-T2 but the introduction of the anisotropy does not significantly improve the model prediction of displacements. However, both the Ogden-based isotropic law and the GOH anisotropic material model were assigned values to reproduce experimental data from Franceschini [40]; therefore, a similar behaviour is to be expected.
Figure 10.
Simulation of relative motion in the sagittal plane for an occipital impact (C755-T2). For marker locations and coordinate system directions, see Hardy et al. [43]. Experimental data are plotted together with the GOH anisotropic model (dashed line) and the original Ogden-based model (dotted line). (Online version in colour.)
3.2. Testing for a simple rotational acceleration
In this section, a simple test of a rotational acceleration impulse is presented and discussed. The main focus of this investigation is to study the influence of k on the response of a specific brain region. In previous studies [5,44], it was shown that deviatoric strains are mainly caused by rotational loading. As the anisotropic response is to be evaluated, the idealized loading condition consists of rotational acceleration only: an acceleration sinusoid of magnitude amax is applied for 5 ms, followed by a longer (10 ms) deceleration sinusoid of magnitude amax/2. Figure 11 illustrates the profile of the curve. This specific loading condition is chosen because an angular acceleration with this magnitude and duration around the head centre of gravity in the sagittal plane results in a translational acceleration at the top of the skull corresponding to a head injury criterion value of 1000 [44].
Figure 11.
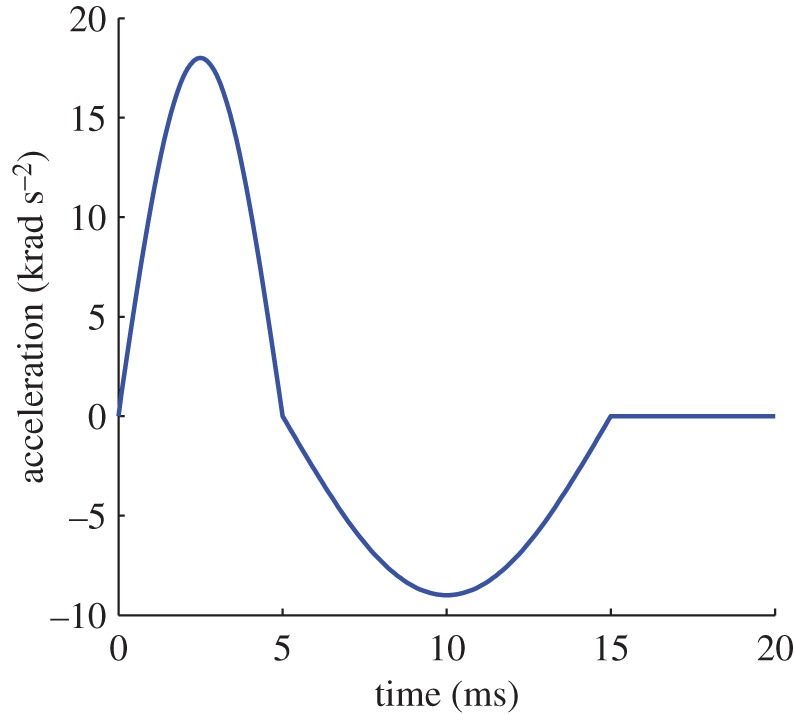
Acceleration profile for loading conditions in the sagittal plane. (Online version in colour.)
For this investigation, the KTH FE head model is used [5] (table 6); the special focus of the study is the brainstem. To investigate the influence of the fibre-reinforcement dispersion parameter, nine different simulations are performed: for each simulation, the brain is assigned the GOH isotropic constitutive law (k = 0.3333), whereas the brainstem is assigned the anisotropic model with a different value of the parameter k, according to table 3. It is important to underline that, in order to avoid influences on the mechanical response owing to the anatomical location, the same region of the brain is analysed for all the calculations. According to the anatomy of the brainstem, the principal direction of the tissue is modelled as inferior–posterior while the level of fibre dispersion varies elementwise depending on the k-value. Rotational acceleration of figure 11 is applied to the sagittal plane and the resulting deformations are compared with the study of the influence of the degree of anisotropy of the fibres on the brainstem response.
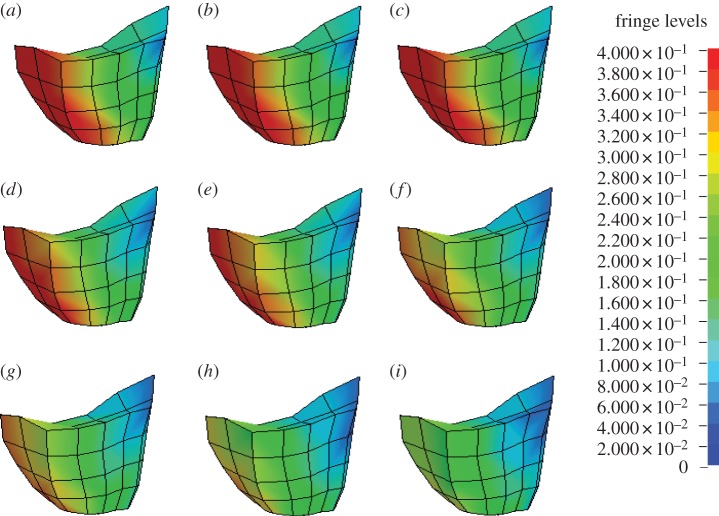
Figure 12 illustrates the magnitude and location of Green–Lagrange principal strains in the brainstem for various fibre-reinforcement dispersion parameters (k) at 5 ms (around the maximum). The results clearly indicate that the sagittal rotation produces smaller deformations for a higher level of fibre alignment; for randomly distributed fibres, a maximum principal strain of 0.38 is detected whereas for perfectly aligned fibres it decreases to 0.30. Table 7 illustrates the variations of the principal strains for different dispersion parameters.
Figure 12.
Magnitude and location of principal strain in the brainstem for various fibre dispersions (k) at 5 ms of simulation. (a) k = 0.3333; (b) k = 0.2732; (c) k = 0.2500; (d) k = 0.2273; (e) k = 0.2000; (f) k = 0.1667; (g) k = 0.1282; (h) k = 0.0769; and (i) k = 0.0000.
Table 7.
Variation of maximum principal strain with k; the reduction is expressed in percentage with respect to the isotropic curve (k = 0.3333).
| k-value | principal strain (max.) | reduction (%) |
|---|---|---|
| 0.3333 | 0.380 | — |
| 0.2732 | 0.380 | — |
| 0.2500 | 0.380 | — |
| 0.2273 | 0.376 | 1.19 |
| 0.2000 | 0.370 | 2.63 |
| 0.1667 | 0.364 | 4.21 |
| 0.1282 | 0.357 | 6.05 |
| 0.0769 | 0.345 | 9.21 |
| 0.0000 | 0.304 | 20.05 |
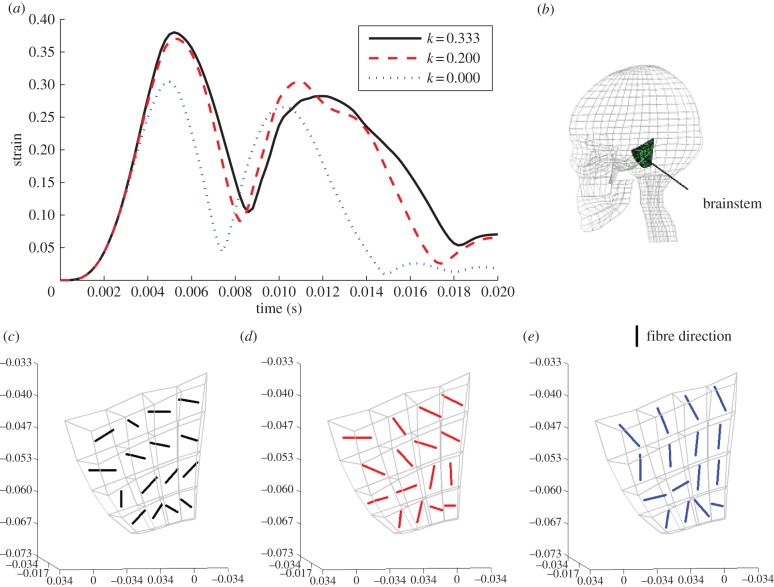
This difference in deformation may be a consequence of the large strain in the axonal direction during the acceleration phase. Figure 13 shows how the anisotropy affects the principal strain orientation: the more fibres are aligned, the more the direction of the principal strain corresponds to the directions of the fibres. Also, a high degree of anisotropy increases the stiffness of the material, the fibres resist the deformation and, as a consequence, the maximum principal strain decreases. For isotropic conditions, or slightly anisotropic, the material is more compliant in the principal direction of deformation. The same is confirmed when the deformations are plotted as a function of time (figure 13a), where higher and later peaks occur for isotropic conditions.
Figure 13.
Effect of the anisotropy on the orientation of principal strain: (a) evolution with time of strain for the isotropic (solid line), intermediately anisotropic (dashed line) and perfectly transversely anisotropic case (dotted line); (b) three-dimensional view of the brainstem; (c) orientation of the principal strain for the isotropic case (k = 0.33); (d) orientation of the principal strain for the intermediately anisotropic case (k = 0.20); (e) orientation of the principal strain for the perfectly transversely anisotropic case (k = 0.00). (Online version in colour.)
However, the effect on the location of the principal strains is shown to be minor (figure 12). The strain concentration seems to be caused by the anatomy of the head only and, in particular, the brainstem is deformed more owing to its location, which is confined between the spinal cord and the remaining part of the brain as well as the tentorium. Different results may be obtained for different areas of the brain.
4. Discussion and conclusion
This work aims at connecting FA from medical images with mechanical anisotropy of a hyperviscoelastic fibre-reinforced anisotropic material model for brain tissue. Both viscoelastic features and local morphological dependence on the mechanical response of the brain are taken into account and FE simulations are used to investigate the influence of the degree of anisotropy for different loading conditions. Heterogeneities of the tissue are considered through the use of the fibre-reinforcement dispersion parameter k [29]. To choose the numerical value of this variable, a new correlation between k and DTI FA is proposed (see equation (2.21) and table 3).
The results show that the dispersion of fibres plays an important role in accounting for the internal load-carrying mechanisms of the individual constituents of the tissue. When the fibres are aligned in the direction of the force, the mechanical behaviour of the brain is stiffer for a lower level of fibre dispersion. When fibres are mainly perpendicular to the direction of loading, they cannot take part in the stress transfer and smaller stresses are seen together with larger stretches. A great sensitivity is noted especially for FA values larger than 0.4 (corpus callosum, corona radiata, cerebral peduncle, etc.). This variation reduces with increasing dispersion of the fibres.
The nonlinear relationship, which is assumed to exist between k and FA (equation (2.21)), is supported by experimental data [40]. For simulations in simple tension and compression, the stress and strain are well correlated with the experimental findings. A mean r-value of 0.9261 is calculated and the statistical significance of the correlation is confirmed by p-values smaller than 0.001. However, for less anisotropic areas (i.e. thalamus, frontal and parietal lobes, and occipital lobe), where the organization of the components plays a minor role in the mechanical response of the tissue, the results suggest that the ratio between the shear modulus and the fibre-reinforcement parameter (G/k1) should be better investigated. The validation with data from postmortem head subjects illustrates that the anisotropic model is able to describe the behaviour of the brain during impact.
Moreover, when the strain in the axonal direction is large, the mechanical response of the tissue is affected to a larger extent in terms of changing the magnitude and orientation of the principal strain. For an angular acceleration in the sagittal plane, this gives a decrease in the principal strain of 20% for the brainstem, probably because of alignment of the strain field and the axon directions.
It is concluded that the incorporation of axonal orientation into a brain tissue constitutive model affects the strains predicted by a computational FE head model to a large extent. As the reliability of such models depends on an appropriate level of structural detail and accurate representation of the material behaviour, the introduction of fibre dispersion information into the constitutive law of brain tissue is crucial to improve the biofidelity of the simulations. The proposed FA–k relationship is a novel approach for obtaining this.
References
- 1.Miller K. 1999. Constitutive model of brain tissue suitable for finite element analysis of surgical procedures. J. Biomech. 32, 531–537. ( 10.1016/S0021-9290(99)00010-X) [DOI] [PubMed] [Google Scholar]
- 2.Takhounts EG, Crandall JR, Darvish K. 2003. On the importance of non-linearity of brain tissue under large deformations. Stapp Car Crash J. 47, 79–92. [DOI] [PubMed] [Google Scholar]
- 3.Brands DWA, Peters GWM, Bovendeerd PHM. 2004. Design and numerical implementation of a 3-D non-linear viscoelastic constitutive model for brain tissue during impact. J. Biomech. 37, 127–134. ( 10.1016/S0021-9290(03)00243-4) [DOI] [PubMed] [Google Scholar]
- 4.Deck C, Nicolle S, Willinger R. 2004. Human head FE modeling: improvement of skull geometry and brain constitutive laws. In Proc. 2004 Int. IRCOBI Conf. on the Biomechanics of Impact, Graz, Austria, 22–24 September 2004, pp. 79–92. Bron, France: International Research Council on the Biomechanics of Impact.
- 5.Kleiven S. 2007. Predictors for traumatic brain injuries evaluated through accident reconstructions. Stapp Car Crash J. 51, 81–114. [DOI] [PubMed] [Google Scholar]
- 6.Cheng S, Bilston L. 2007. Unconfined compression of white matter. J. Biomech. 40, 117–124. ( 10.1016/j.jbiomech.2005.11.004) [DOI] [PubMed] [Google Scholar]
- 7.Pervin F, Chen WW. 2009. Dynamic mechanical response of bovine gray matter and white matter brain tissues under compression. J. Biomech. 42, 731–735. ( 10.1016/j.jbiomech.2009.01.023) [DOI] [PubMed] [Google Scholar]
- 8.Libertiaux V, Pascon F. 2012. Differential versus integral formulation of fractional hyper-viscoelastic constitutive laws for brain tissue modelling. J. Comput. Appl. Math. 234, 2029–2035. ( 10.1016/j.cam.2009.08.060) [DOI] [Google Scholar]
- 9.Prange MT, Margulies SS. 2002. Regional, directional and age-dependent properties of the brain undergoing large deformation. J. Biomech. Eng. Trans. ASME 124, 244–252. ( 10.1115/1.1449907) [DOI] [PubMed] [Google Scholar]
- 10.Velardi F, Fraternali F, Angelillo M. 2006. Anisotropic constitutive equations and experimental tensile behavior of brain tissue. Biomech. Model. Mechanobiol. 5, 53–61. ( 10.1007/s10237-005-0007-9) [DOI] [PubMed] [Google Scholar]
- 11.Nicolle S, Lounis M, Willinger R, Palierne J. 2005. Shear linear behavior of brain tissue over a large frequency range. Biorheology 42, 209–223. [PubMed] [Google Scholar]
- 12.Bilston L. 2011. Brain tissue mechanical properties. In Biomechanics of the brain (ed. Miller K.), ch. 4, pp. 69–89. New York, NY: Springer. [Google Scholar]
- 13.Cloots R, Gervaise HMT, Van Dommelen JAW, Geers MGD. 2008. Biomechanics of traumatic brain injury: influences of the morphologic heterogeneities of the cerebral cortex. Ann. Biomed. Eng. 36, 1203–1215. ( 10.1007/s10439-008-9510-3) [DOI] [PMC free article] [PubMed] [Google Scholar]
- 14.Miller K, Chinzei K. 2002. Mechanical properties of brain tissue in tension. J. Biomech. 35, 483–490. ( 10.1016/S0021-9290(01)00234-2) [DOI] [PubMed] [Google Scholar]
- 15.Tamura A, Hayashi S, Watanabe I, Nagayama K, Matsumoto T. 2007. Mechanical characterization of brain tissue in high-rate compression. J. Biomech. Sci. Eng. 2, 115–126. ( 10.1299/jbse.2.115) [DOI] [Google Scholar]
- 16.Hrapko M, Van Dommelen JAW, Peters GWM, Wismans JSHM. 2006. The mechanical behaviour of brain tissue: large strain response and constitutive modelling. Biorheology 43, 623–636. [PubMed] [Google Scholar]
- 17.Shuck L, Advani S. 1972. Rheological response of human brain tissue in shear. J. Basic Eng. 94, 905–911. ( 10.1115/1.3425588) [DOI] [Google Scholar]
- 18.Zhang LY, Yang KH, King AI. 2001. Comparison of brain responses between frontal and lateral impacts by finite element modeling. J. Neurotrauma 18, 21–30. ( 10.1089/089771501750055749) [DOI] [PubMed] [Google Scholar]
- 19.Darvish KK, Crandall J. 2001. Non-linear viscoelastic effects in oscillatory shear deformation of brain tissue. Med. Eng. Phys. 23, 633–645. ( 10.1016/S1350-4533(01)00101-1) [DOI] [PubMed] [Google Scholar]
- 20.Ning X, Zhu Q, Lanir Y, Margulies SS. 2006. A transversely isotropic viscoelastic constitutive equation for brainstem undergoing finite deformation. J. Biomech. Eng. 128, 925–933. ( 10.1115/1.2354208) [DOI] [PubMed] [Google Scholar]
- 21.Hrapko M, Van Dommelen JAW, Peters GWM, Wismans JSHM. 2008. The influence of test conditions on characterization of the mechanical properties of brain tissue. J. Biomech. Eng. 130 ( 10.1115/1.2907746) [DOI] [PubMed] [Google Scholar]
- 22.van Dommelen J, van der Sande T, Hrapko M, Peters G. 2010. Mechanical properties of brain tissue by indentation: interregional variation. J. Mech. Behav. Biomed. Mater. 3, 158–166. ( 10.1016/j.jmbbm.2009.09.001) [DOI] [PubMed] [Google Scholar]
- 23.Bain AC, Meaney DF. 2000. Tissue-level thresholds for axonal damage in an experimental model of central nervous system white matter injury. J. Biomech. Eng. 122, 615–622. ( 10.1115/1.1324667) [DOI] [PubMed] [Google Scholar]
- 24.Smith D, Meaney D. 2000. Axonal damage in traumatic brain injury. Neuroscientist 6, 483–495. ( 10.1177/107385840000600611) [DOI] [Google Scholar]
- 25.Bain A, Raghupathi R, Meaney D. 2001. Dynamic stretch correlates to both morphological abnormalities and electrophysiological impairment in a model of traumatic axonal injury. J. Neurotrauma 18, 499–511. ( 10.1089/089771501300227305) [DOI] [PubMed] [Google Scholar]
- 26.Elkin B, Morrison B. 2007. Region-specific tolerance criteria for the living brain. Stapp Car Crash J. 51, 127–138. [DOI] [PubMed] [Google Scholar]
- 27.El Sayed T, Mota A, Fraternali F, Ortiz M. 2008. A variational constitutive model for soft biological tissues. J. Biomech. 41, 1458–1466. ( 10.1016/j.jbiomech.2008.02.023) [DOI] [PubMed] [Google Scholar]
- 28.Cloots R, Van Dommelen JAW, Kleiven S, Geers MGD. 2013. Multi-scale mechanics of traumatic brain injury: predicting axonal strains from head loads. Biomech. Model. Mechanobiol. 12, 137–150. ( 10.1007/s10237-012-0387-6) [DOI] [PubMed] [Google Scholar]
- 29.Gasser TC, Ogden RW, Holzapfel GA. 2006. Hyperelastic modelling of arterial layers with distributed collagen fibre orientations. J. R. Soc. Interface 3, 15–35. ( 10.1098/rsif.2005.0073) [DOI] [PMC free article] [PubMed] [Google Scholar]
- 30.Cloots R, Nyberg T, Kleiven S, Van Dommelen JAW, Geers MGD. 2011. Micromechanics of diffuse axonal injury: influence of axonal orientation and anisotropy. Biomech. Model. Mechanobiol. 10, 413–422. ( 10.1007/s10237-010-0243-5) [DOI] [PubMed] [Google Scholar]
- 31.Mori S, Zhang J. 2006. Principle of diffusion tensor imaging and its applications to basic neuroscience research. Neuron 51, 527–539. ( 10.1016/j.neuron.2006.08.012) [DOI] [PubMed] [Google Scholar]
- 32.Nolte J. 2002. The human brain: an introduction to its functional anatomy, 5th edn St Louis, MO: Mosby Inc. [Google Scholar]
- 33.Arbogast KB, Margulies SS. 1999. A fiber-reinforced composite model of the viscoelastic behavior of the brainstem in shear. J. Biomech. 32, 865–870. ( 10.1016/S0021-9290(99)00042-1) [DOI] [PubMed] [Google Scholar]
- 34.Colgan NC, Gilchrist M, Curran K. 2010. Applying DTI white matter orientations to finite element head models to examine diffuse TBI under high rotational accelerations. Prog. Biophys. Mol. Biol. 103, 304–309. ( 10.1016/j.pbiomolbio.2010.09.008) [DOI] [PubMed] [Google Scholar]
- 35.Chatelin S, Deck C, Willinger R. In press. An anisotropic viscous hyperelastic constitutive law for brain material finite-element modeling. J. Biorehol. ( 10.1007/s12573-012-0055-6) [DOI] [Google Scholar]
- 36.Wright RM, Ramesh KT. 2012. An axonal strain injury criterion for traumatic brain injury. Biomech. Model. Mechanobiol. 11, 245–260. ( 10.1007/s10237-011-0307-1) [DOI] [PubMed] [Google Scholar]
- 37.Sorensen AG, et al. 1999. Human acute cerebral ischemia: detection of changes in water diffusion anistropy by using MR imaging. Radiology 212, 785–792. ( 10.1148/radiology.212.3.r99se24785) [DOI] [PubMed] [Google Scholar]
- 38.Cercignani M, Inglese M, Pagani E, Comi G, Filippi M. 2001. Mean diffusivity and fractional anisotropy histograms of patients with multiple sclerosis. Am. J. Neuroradiol. 22, 952–958. [PMC free article] [PubMed] [Google Scholar]
- 39.Gefen A, Margulies S. 2004. Are in vivo and in situ brain tissues mechanically similar? J. Biomech. 37, 1339–1352. ( 10.1016/j.jbiomech.2003.12.032) [DOI] [PubMed] [Google Scholar]
- 40.Franceschini G. 2006. The mechanics of human brain tissue. PhD thesis, University of Trento, Trento, Italy. [Google Scholar]
- 41.Bozzali M, Falini A, Franceschi M, Cercignani M, Zuff M, Scotti G, Comi G, Filippi M. 2002. White matter damage in Alzheimer's disease assessed in vivo using diffusion tensor magnetic resonance imaging. J. Neurol. Neurosurg. Psychiatry 72, 742–746. ( 10.1136/jnnp.72.6.742) [DOI] [PMC free article] [PubMed] [Google Scholar]
- 42.Lee C, Danielian L, Thomasson D, Baker E. 2009. Normal regional fractional anisotropy and apparent diffusion coefficient of the brain measured on a 3T MR scanner. Neuroradiology 51, 3–9. ( 10.1007/s00234-008-0441-3) [DOI] [PubMed] [Google Scholar]
- 43.Hardy W, Foster C, Mason M, Yang K, King A, Tashman S. 2001. Investigation of head injury mechanisms using neutral density technology and high-speed biplanar X-ray. Stapp Car Crash J. 45, 337–368. [DOI] [PubMed] [Google Scholar]
- 44.Hrapko M, Van Dommelen JAW, Peters GWM, Wismans JSHM. 2009. On the consequences of non-linear constitutive modelling of brain tissue for injury prediction with numerical head models. Int. J. Crashworthiness 14, 245–257. ( 10.1080/13588260802440290) [DOI] [Google Scholar]


