
Figure 2.
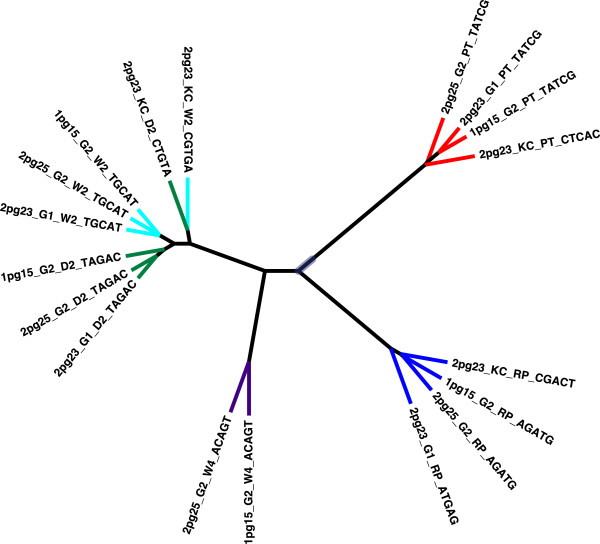
Distance tree of weighted UniFrac distances between samples for Patient 1 amplified and sequenced independently. Distance tree calculated by the unweighted pair group method with arithmetic mean. Branch tips are colored by sample: red, pre-treatment; blue, RePOOPulate formulation. Post-treatment samples are colored green (D2), cyan (W2), and purple (W4). Tip label fields are separated by an underscore character and the fields are: Ion Torrent run ID, person and time of amplification, sample identifier, barcode sequence