Abstract
This study investigates the grafting of poly-sodium styrene sulfonate (pNaSS) from trichlorosilane/10-undecen-1-yl 2-bromo-2-methylpropionate functionalized Si and Ti substrates by atom transfer radical polymerization (ATRP). The composition, molecular structure, thickness, and topography of the grafted pNaSS films were characterized with x-ray photoelectron spectroscopy (XPS), time-of-flight secondary ion mass spectrometry (ToF-SIMS), variable angle spectroscopic ellipsometry (VASE), and atomic force microscopy (AFM), respectively. XPS and ToF-SIMS results were consistent with the successful grafting of a thick and uniform pNaSS film on both substrates. VASE and AFM scratch tests showed the films were between 25 and 49 nm thick on Si, and between 13 and 35 nm thick on Ti. AFM determined root-mean-square roughness values were ∼2 nm on both Si and Ti substrates. Therefore, ATRP grafting is capable of producing relatively smooth, thick, and chemically homogeneous pNaSS films on Si and Ti substrates. These films will be used in subsequent studies to test the hypothesis that pNaSS-grafted Ti implants preferentially adsorb certain plasma proteins in an orientation and conformation that modulates the foreign body response and promotes formation of new bone.
INTRODUCTION
Titanium and its alloys are widely used in biomedical implants due to their optimal mechanical properties and relative bioinertness.1, 2 However, Ti implants are prone to failure due to the foreign body response, which is a cascade of events beginning with nonspecific protein adsorption onto the implant surface, and ending with envelopment of the implant within a fibrous capsule.1, 3 The fibrous encapsulation is hypothesized to prevent osseointegration, by inhibiting intimate bone-implant contact, leading to implant failure. A number of surface treatments have been developed to increase Ti-implant osseointegration. (Readers are referred to the reviews in Refs. 4, 5 for further insight into the surface modification of Ti implants.) However, the surface treatment most relevant to the current study is surface modification with bioactive polymers.
Increased proliferation and adhesion of fibroblasts,6 MG63 osteoblast-like cells,7, 8, 9 and human mandibular osteoblasts10 have been shown in vitro on sodium styrene sulfonate (NaSS) modified Ti and poly(ethylene terephthalate) surfaces. Promising results have also been obtained in vivo for the same surfaces.10, 11, 12 Since the foreign body response begins with nonspecific protein adsorption, and cell function on surfaces is mediated by adsorbed proteins,3 poly(NaSS) (pNaSS) grafted implants are hypothesized to preferentially adsorb certain plasma proteins in an orientation and conformation that modulates the foreign body response and promotes formation of new bone. Our ultimate goal is to test this hypothesis.
Two general grafting methods for NaSS surface modification were employed in previous studies on Ti surfaces: (1) surface-initiated radical polymerization from titanium peroxide groups obtained by chemical oxidation of the Ti;8, 9, 12 and (2) solution-initiated free-radical polymerization onto 3-methacryloxypropyltrimethoxysilane functionalized Ti.7, 13 While these grafting methods produced films that successfully demonstrated the beneficial effects of grafted NaSS, they do not allow the control of the grafted polymers in terms of chain length uniformity, thickness, etc. that can be obtained from atom transfer radical polymerization (ATRP). The substrates grafted via free-radical polymerization are suitable for cell-based in vitro and in vivo investigations, but to analyze the shape and size of adsorbed proteins with techniques such as atomic force microscopy, smooth and chemically uniform substrates are required.
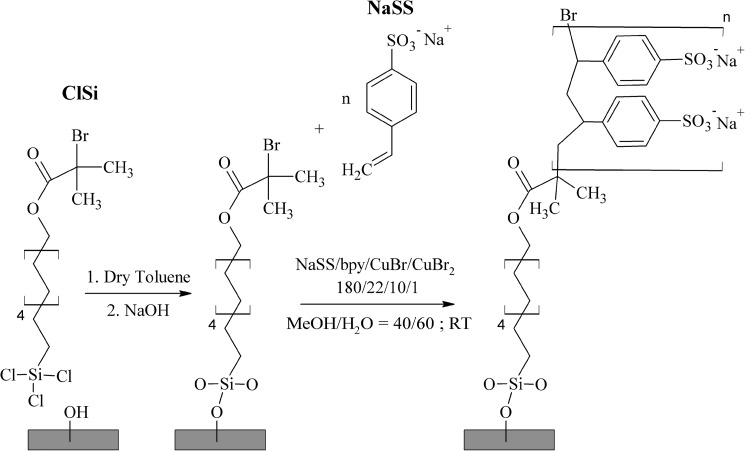
ATRP is a living polymerization method known for producing low polydispersity polymer chains in solution, which translates to uniform films when grafted from a surface.14, 15 ATRP is relatively versatile and has been applied with a wide variety of monomers.14, 15, 16, 17 When coupled with a material-specific strategy for surface immobilization of the ATRP initiator, ATRP can be applied to a wide range of surfaces. As a case-in-point, using a variety of immobilization strategies ATRP has been used to graft NaSS from: reduced ,18, 19, 20 plasma-treated poly(tetrafluoroethylene)21, 22, 23 and poly(vinylidene fluoride),24 carbon black,25 multiwalled carbon nanotubes,26 (Refs. 27, 28) and (Refs. 29, 30) nanoparticles, Ludox CL silica sols,31 and gold.32 Therefore, in this study, we used ATRP to graft NaSS from trichlorosilane/10-undecen-1-yl 2-bromo-2-methylpropionate [henceforth referred to as trichlorosilane/10-undecen-1-yl 2-bromo-2-methylpropionate (ClSi)] functionalized 1 × 1 cm2 diced Si wafers and 1 × 1 cm2 diced Si coated with ∼100 nm of electron-beam deposited Ti (Fig. 1). Since the surfaces of polished Si wafers are very uniform, both chemically and topographically (typical RMS roughness values are ca. 0.1 nm), the diced Si substrates are used to examine pNaSS film uniformity. The Ti-coated substrates are used to examine the suitability of the ATRP method for grafting NaSS from the surface of Ti implants. To our knowledge, this is the first such study to use ATRP to graft NaSS from Ti, and also the first such study to investigate the role of substrate effects on the uniformity of NaSS films grown via ATRP. The composition, molecular structure, thickness, and topography of the grafted pNaSS films were characterized with x-ray photoelectron spectroscopy (XPS), time-of-flight secondary ion mass spectrometry (ToF-SIMS), variable angle spectroscopic ellipsometry (VASE), and atomic force microscopy (AFM), respectively.
Figure 1.
Schematic representation of the two-step NaSS grafting procedure: step 1—surface immobilization of the ATRP initiator via ClSi functionalization of the substrate; step 2—ATRP grafting of NaSS.
EXPERIMENT
Materials
Si wafers (Silicon Valley Microelectronics Inc., San Jose, CA) were diced into 1 × 1 cm2 substrates using a diamond saw. Ti substrates were fabricated by depositing 100 nm of Ti onto the diced Si substrates via e-beam deposition at RT and pressures <1 × 10⁻⁶ Torr. Methanol, acetone, dichloromethane, toluene, phosphate buffered saline (PBS; 0.01 M phosphate, 0.138 M sodium chloride, 0.0027 M potassium chloride, pH 7.4), Cu(I) bromide (99.999%), Cu(II) bromide (>99.0%), 2,2′-bipyridine (bpy), and NaSS were all purchased from Sigma. The toluene was dried by storing over 4A molecular sieves, the rest of the chemicals were used as received. The synthesis of the ATRP initiator, ClSi, has been described previously.33
Substrate cleaning and ATRP-initiator functionalization
Substrates were cleaned by sonicating twice for 5 min in each of the following solvents: dichloromethane, acetone, and MeOH. This cleaning was performed prior to the Ti e-beam deposition, and again prior to the ClSi functionalization. After a subsequent 15-min UV-ozone step, the cleaned substrates were functionalized overnight at RT in a 0.2 vol. % solution of ClSi in dry toluene. The ClSi functionalization and ATRP steps were performed in glass test tubes with two substrates, one Si and one Ti, placed back-to-back in each tube. Functionalized substrates were rinsed in dry toluene followed by MeOH, and then briefly dipped in 1 mM to cross-link the surface silanes and neutralize the byproducts.
ATRP
ATRP catalyst solids, (6.42 mg, 4.48 μmol), (1 mg, 44.8 μmol), and bpy (15.4 mg, 98.6 μmol), were weighed and sealed in a glass test tube. ClSi-functionalized substrates were sealed in glass test tubes with NaSS monomer (203 mg, 98.6 mmol). All sealed tubes were cyclically evacuated and N2-backfilled to purge all oxygen. Meanwhile, the reaction solvents, 18-Ω DI and MeOH, were deoxygenated by bubbling N2 through them for at least 30 min. The ATRP catalyst solids were dissolved in 2 ml MeOH. The NaSS monomer was dissolved in 1 ml MeOH and then 1.5 ml of 18-Ω DI was added to achieve a 60/40 ratio. Each reaction was started by adding 90 μL of ATRP catalyst solution to a test tube containing the NaSS monomer plus the functionalized substrates. All reactions were shaken, not stirred, and allowed to proceed to completion for ca. 72 h, after which the substrates were rinsed with 18-Ω DI and soaked in PBS overnight to remove any residual Cu catalyst and monomer. Finally, the grafted substrates were rinsed again with 18-Ω DI , gently dried with a stream of , and stored under overnight before XPS analysis. All analyses were performed on the same set of samples in the following order: XPS, ToF-SIMS, AFM, and VASE. Two replicate samples for each substrate were prepared and analyzed for each treatment.
XPS
XPS compositions were determined from an average of three spots on two replicate samples for each substrate. The data were acquired on a Kratos AXIS Ultra DLD instrument (Kratos, Manchester, UK) in the hybrid mode using a nominal 0° photoelectron takeoff angle (TOA) and a monochromatic Al Kα1,2 x-ray source . Here, the photoelectron TOA is defined as the angle between the surface normal and the axis of the analyzer lens. Atomic compositions were calculated from peak areas obtained from survey scans (0–1200 eV) with analyzer pass energy of 80 eV, a 1 eV step size, and a 200 ms dwell time. Carbon and sulfur chemical shifts were determined from high resolution and spectra obtained with analyzer pass energy of 20 eV, a 0.3 eV step size, and 259.7 ms and 425.5 ms dwell times for and , respectively. All samples were grounded to the spectrometer and run as conductors. Binding energy scales were calibrated by setting the peak in the region to 285.0 eV, and a linear background was subtracted for all peak area quantifications. The peak areas were normalized by the manufacturer supplied sensitivity factors, and surface concentrations were calculated using casa xps (Casa Software, Ltd.).
ToF-SIMS
Positive and negative secondary ion spectra and images were acquired on a TOF.SIMS 5-100 instrument (ION-TOF, Münster, Germany) using a pulsed 25 keV primary ion beam under static conditions (primary ion dose < 1012 ions/cm2). Five spectra were collected from 100 × 100 μm2 regions for each sample at both polarities, and at least one image was acquired from 500 × 500 μm2 regions for each sample at both polarities. Spectra were acquired in high-current bunch (high mass resolution) mode, and images in burst alignment (high spatial resolution) mode. Secondary ions were collected over a range of 0–800 at a mass resolution , in high-current bunch mode, between 4000 and 8000. Positive spectra were mass calibrated using , , and peaks, and negative spectra were calibrating using , , , , , and peaks. Mass calibration corrections were typically below 20 ppm.
Principal component analysis
Principal component analysis (PCA) of the ToF-SIMS data, previously described in detail,34, 35, 36 is a multivariate analysis technique that was used to identify principal sources of variation between sample spectra. For both positive and negative spectra, lists of all significant peaks—defined as any peak with intensity three times the background noise—were compiled and imported into a series of scripts written by NESAC/BIO for matlab37, 38 (MathWorks, Inc., Natick, MA). Contaminant peaks [e.g., poly(dimethyl siloxane) (PDMS) peaks] were removed from the peak lists prior to PCA analysis. Data sets were also normalized by the sum of selected peaks, mean centered, and square-root transformed to ensure that variance within the data set was due to differences in sample variances rather than in sample means.
VASE
VASE measurements were made using an M-2000 ellipsometer (J.A. Woolam, Lincoln, NE). On one spot per sample, spectra were collected at three different angles (55°, 65°, and 75°) in a spectral range from 210 to 1700 nm. These data were used to develop the ellipsometric angle models. Following these single-spot measurements, sample mapping measurements were performed on a grid of 25 spots evenly spaced 0.1 cm apart in a 0.5 × 0.5 cm2 area. The mapping measurements were performed at a single angle of 65° using a focused spot size of ∼150 μm. Modeling was performed with the CompleteEASE software package provided by the manufacturer. The accuracy of the model fits was evaluated based on a figure of merit as well as physical relevance of the refractive index and extinction coefficient plots generated by the model.
AFM
AFM images were acquired on a Dimension Icon (Bruker, Santa Barbara, CA) in TappingModeTM using OTESPA rectangular cantilevers (k = 40 N/m; Bruker, Santa Barbara, CA). One 1-μm scan, and one larger-area scan, was collected at five different spots per sample. Images were line and plane flattened as necessary using the NanoScope Analysis software package.
Scratch test measurements were also performed to verify the accuracy of the ellipsometry models. These consisted of using a high deflection set point in contact mode to scratch a 5 × 5 μm2 hole in the pNaSS film, reducing the deflection set point and increasing the scan size to 20 × 20 μm2 to determine the depth of the scratched hole. This procedure was iterated, each time scratching with a high deflection set point until the thickness remained constant between iterations.
RESULTS AND DISCUSSION
NaSS grafting conditions
A preliminary set of experiments was performed to optimize the NaSS grafting conditions. A series of reactions was performed on e-beam deposited Ti under conditions nearly identical to those reported above, except that a 50/50 ratio was used. Initial conditions were adapted from the work of Choi and Kim on solution-phase ATRP of NaSS.39 The reactions were followed with XPS, and three spots were analyzed on two samples at each time point (2, 8, and 72 h).
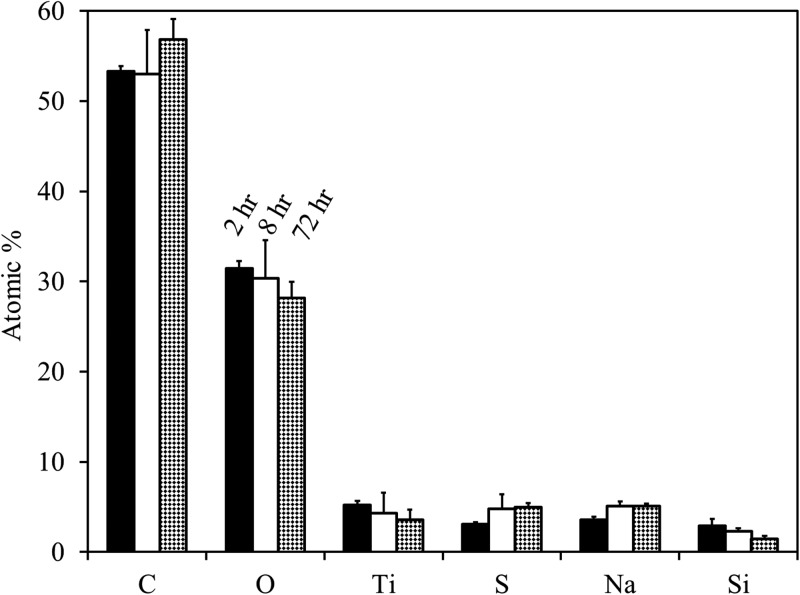
The survey composition results (Fig. 2) show decreasing Ti, O, and Si content with increasing reaction time. This is due to the attenuation of the substrate signal by an increasingly thick pNaSS film and is accompanied by the expected corresponding increase in C, S, and Na content. Of note is the significant Ti content observed even after 72 h reaction time, which suggests that the pNaSS films are either patchy or thinner than the ∼10 nm XPS sampling depth. Accompanying ToF-SIMS imaging and AFM measurements (not shown) were indicative of uniform and continuous films, indicating the films were thick. Increasing solvent water content has been shown to increase reaction kinetics and final film thickness, but at the cost of decreased monodispersity.39, 40 Therefore, the was increased slightly to 60/40 to graft thicker films, while maintaining good pNaSS-film uniformity.
Figure 2.
XPS compositions for a preliminary time-dependent study. Reactions were performed solely on Ti substrates under identical conditions to those described in the experimental section, except that a 50/50 ratio was used. Compositions are reported as the avg ± stdev of three spots on two samples.
It should be noted that, within error, S and Na content does not change between pNaSS films grown for 8 and 72 h at 50/50 . This indicates that the reaction has essentially gone to completion after ca. 8 h. Increasing water content increases reaction kinetics, thus the reactions run at 60/40 have likely gone to completion in . And since reaction kinetics were not a main focus of this study, it was only out of convenience that the reactions were allowed to run for ∼72 h (i.e., over the weekend). Therefore, the long reaction times reported in this paper should not be interpreted as a measure of NaSS grafting kinetics.
XPS survey and high resolution spectra
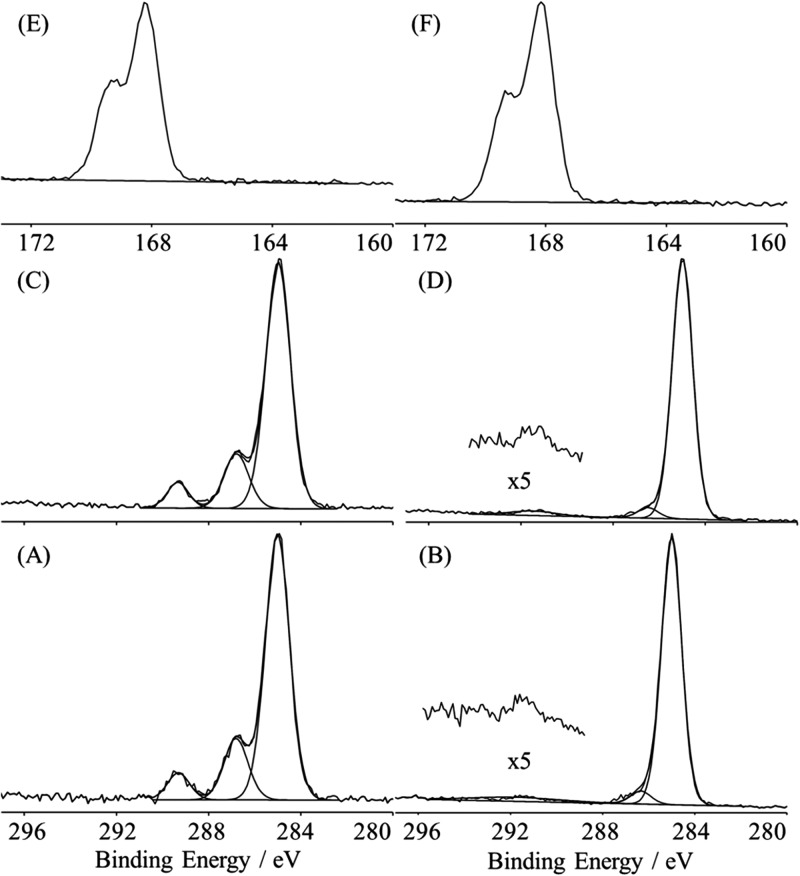
XPS survey composition results (Table Table I.) show the bare substrates to be composed of Ti, Si, O, and C from a thin adventitious hydrocarbon overlayer. The bare substrate high resolution spectra show a hydrocarbon peak at 285 eV, with a slight shoulder at 286.7 eV, and a small peak at 288.7 eV (not shown). Following ClSi functionalization, the addition of Br and Si is observed for the Ti substrates, and the addition of Br is observed for the Si substrates. Furthermore, the ClSi high resolution C1s spectra [Figs. 3a, 3c] show well-defined hydrocarbon (C-C/C-H), ether (C-O), and ester (O-C = O) peaks at 285, 286.8, and 289.3 eV, respectively. However, the ether:ester peak area ratios are consistently ∼2.5:1, where the ClSi stoichiometry would predict a ratio of 1:1. This is partially due to the contribution of an overlapping C-Br peak to the ether peak. While the C-Br chemical shift is only ∼0.8 eV, the C-Br carbon is also β-shifted ∼0.8 eV by the ester group.41, 42 Adding the two chemical shifts as a rough approximation places the C-Br peak at ∼286.6 eV, which overlaps with the ether peak. Lacking the energy resolution distinguish the two peaks from each other, the C-Br peak is detected by the added contribution to the ether peak area. This results in an expected 2:1 (ether + C-Br):ester peak area ratio, which is similar to the observed peak area ratio. The addition of the Br and Si in the survey spectra, and well-defined ether and ester peaks in the high resolution spectra are consistent with the successful ClSi functionalization of both Ti and Si substrates.
Table I.
XPS determined elemental compositions of bare, ClSi-modified, and pNaSS-grafted Ti and Si substrates. AFM RMS roughness values for each sample are also listed. All composition and roughness values are reported as the avg ± stdev of three spots on two samples.
| XPS atomic % | ||||||
|---|---|---|---|---|---|---|
| Evaporated Ti | Diced Si | |||||
| Bare substrate | ClSi iodified | pNaSS grafted | Bare substrate | ClSi modified | pNaSS grafted | |
| 54.2 ± 0.5 | 37.6 ± 1.0 | 22.5 ± 1.2 | 34.8 ± 0.7 | 25.5 ± 0.6 | 22.6 ± 0.6 | |
| 23.3 ± 0.4 | 44.3 ± 2.1 | 63.2 ± 1.2 | 12.6 ± 0.9 | 41.8 ± 2.3 | 64.0 ± 0.6 | |
| 22.4 ± 0.2 | 13.2 ± 0.5 | 0.3 ± 0.2 | - | - | - | |
| - | 3.3 ± 1.0 | 1.3 ± 1.4 | 52.6 ± 1.3 | 29.5 ± 1.7 | 2.0 ± 0.6 | |
| - | 1.5 ± 0.2 | - | - | 3.2 ± 1.3 | - | |
| - | - | 6.3 ± 0.5 | - | - | 5.8 ± 0.3 | |
| - | - | 6.4 ± 0.4 | - | - | 5.6 ± 0.7 | |
| AFM RMS roughness | 2.2 ± 0.2 | 2.1 ± 0.3 | 2.4 ± 0.7 | 0.2 ± 0.01 | 0.8 ± 0.2 | 1.9 ± 0.9 |
Figure 3.
XPS high resolution spectra of the ClSi (a) and NaSS (b) films on Ti; XPS high resolution spectra of the ClSi (c) and NaSS (d) films on Si; XPS high resolution spectra of the NaSS film on Ti (e) and Si (f).
The ClSi layer thickness can be calculated from the attenuation of the substrate peaks between the bare and ClSi-functionalized substrates using
| (1) |
where d is the overlayer thickness, θ the photoemission angle relative to the surface normal, λ the inelastic mean free path, and I and the attenuated and bare substrate intensities, respectively. In nearly all cases, before Eq. 1 can be used bare substrate intensities must be corrected for the attenuation caused by the presence of an adventitious hydrocarbon overlayer.43 This can be done using the method of Smith.43 First the thickness of the adventitious hydrocarbon overlayer must be determined using
| (2) |
where x is the hydrocarbon atom%, is the effective attenuation length for photoelectrons traveling through the hydrocarbon overlayer (taken to be 3.5 nm), and θ is the photoelectron emission angle relative to the surface normal. Next, the substrate composition may be estimated without the effect of the hydrocarbon overlayer using43
| (3) |
where is the measured atom% with the overlayer, d the overlayer thickness calculated with Eq. 2, and λ the effective attenuation length for the element and line of interest through the hydrocarbon overlayer. The corrected atom%, , is found for each element except carbon and must be renormalized to 100% to estimate the bare substrate composition without the hydrocarbon overlayer. For inorganic compounds, excited with an Al Kα source in the kinetic energy range between 400 and 1500 eV, λ may be calculated using43
| (4) |
With this method, assuming an effective photoelectron TOA of 40° for the spectrometer operated in hybrid mode,44 thicknesses of 1.0 ± 0.1 nm and 0.9 ± 0.1 nm were calculated for ClSi films on Ti and Si, respectively.
Following the ATRP surface grafting, equal amounts of S and Na are observed in the survey spectra, as well as the disappearance of Br and near complete attenuation of the substrate peaks. The equal amounts of S and Na are in accordance with the stoichiometry expected from the NaSS monomer, and the disappearance of the Br and near complete attenuation of the substrate peaks are indicative of the successful grafting of a ≥ 10 nm thick layer of pNaSS on both Si and Ti substrates. This is supported by the high resolution spectra [Figs. 3e, 3f], which show the and doublet peaks in the expected 2:1 ratio appearing at ∼168 eV, which is the expected binding energy for a sulfur species.45 Furthermore, the high resolution spectra [Figs. 3b, 3d] are marked by the disappearance of the ester peak, as well as the addition of a shake-up peak at ∼291.7 eV characteristic of the aromatic ring46 present in the NaSS monomer structure. It should be noted that on the Ti samples, the Ti substrate signal is attenuated to a much greater extent (13.2 ± 0.5 at. % to 0.3 ± 0.2 at. % before and after NaSS grafting) than the Si signal (3.3 ± 1.0 at. % to 1.3 ± 1.4 at. % before and after NaSS grafting). This is due to the contribution of low levels of PDMS contamination on the Ti samples. The PDMS was detected by the presence of characteristic peaks at nominal of 73 , 147 , and 207 in the positive ToF-SIMS spectra. No PDMS peaks were found in the negative spectra, and those found in the positive spectra were isolated to one set of Ti and Si replicates, both of which originated from the same reaction tube. As best as could be determined, no other ClSi or NaSS samples appeared to be contaminated.
ToF-SIMS
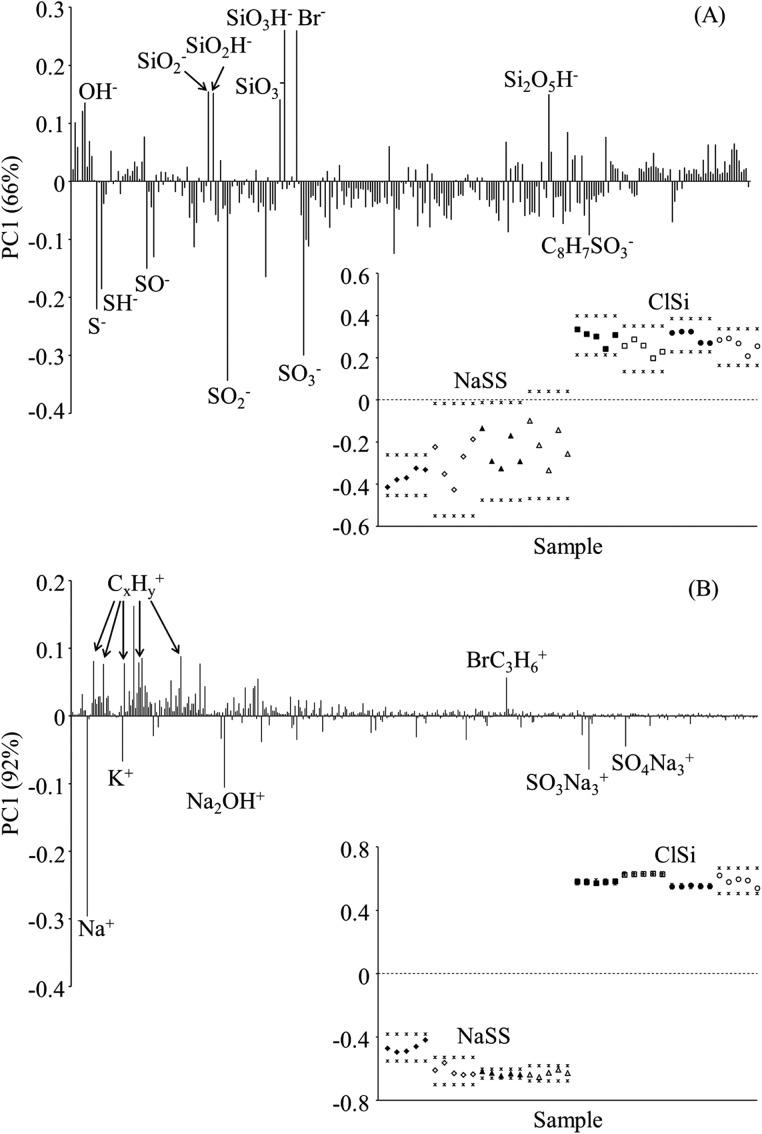
PCA results from the ToF-SIMS spectra are reported for an range from 0 to 400 [Figs. 4a, 4b]. Peaks of intensity 3× the background could not be found outside of that range. PCA results for the negative spectra [Fig. 3a] separate the ClSi from the NaSS samples: ClSi samples load positively and are associated with Br− and Si-containing peaks; NaSS samples load negatively and are associated with sulfonate containing fragments and the NaSS monomer . The 95% confidence intervals for the NaSS samples on the two different substrates overlap completely, indicating that PCA is unable to chemically differentiate NaSS films prepared on Ti and Si substrates. The same is true of the ClSi samples when the entire data set is analyzed at once. However, when analyzed by themselves, the ClSi samples separate based on substrate type, indicating that the ClSi film thickness is less than the ∼2 nm SIMS sampling depth (not shown).
Figure 4.
ToF-SIMS PCA loadings plots with inset scores plots for negative (a) and positive (b) secondary ion spectra. (♦) and (▲) designate NaSS on Ti and Si, respectively; (▪) and (●) designate ClSi and Ti and Si, respectively. Open symbols designate measurements on replicate samples. (*) designate the 95% confidence intervals.
The positive spectra PCA results separate the samples in the same way, with the ClSi samples loading positively and the NaSS samples loading negatively. However, since both ClSi and NaSS contain electronegative atoms (e.g., O, S, and Br), most of the ClSi and NaSS characteristic ions are present in the negative spectra. The peak in the positive spectra is the only fragment found that can be attributed to the ClSi head group. As expected, several Na-containing ions (, , , and ) are present in the positive ion spectra of the NaSS samples.
Figure 5 shows 500 × 500 μm2 ToF-SIMS images of the signal [Figs. 5a, 5b] and the sum of fragments [Figs. 5c, 5d] for both Ti and Si substrates. The images show uniform coverage, at the spatial resolution used in the ToF-SIMS analysis (∼2 μm), of the ClSi film across both substrates. Similar results are obtained for the sum of Br-containing fragments (e.g., ) in the positive polarity. However, the signal is lower for the Si substrate since many of the Br-containing fragments are Ti adducts. The images also show uniform coverage of NaSS across both substrates.
Figure 5.
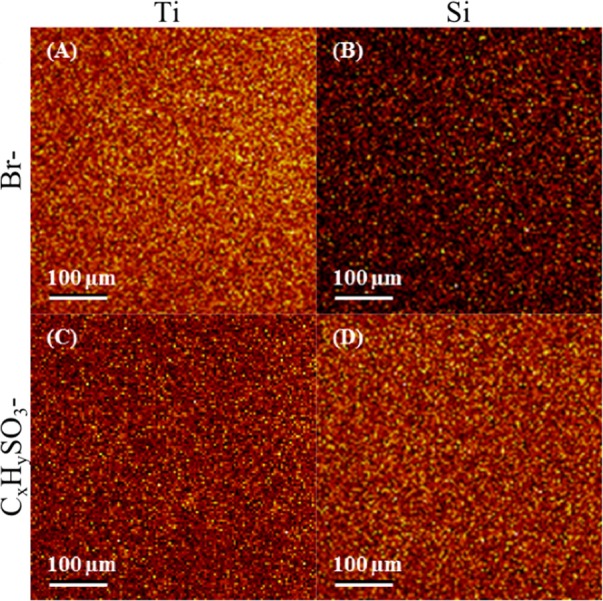
(Color online) 500 × 500 μm2 ToF-SIMS images of the signal on ClSi functionalized Ti (a) and Si (b) substrates, and the sum of fragments on NaSS grafted Ti (c) and Si (d) substrates.
VASE
The ellipsometry models were built stepwise from VASE measurements performed on two samples each of blank, ClSi-functionalized, and NaSS-grafted Si and Ti substrates. Thicknesses for the ClSi and pNaSS layers are reported in Table Table II.. The blank Si samples were treated as a layer atop a pure Si substrate using prefabricated Si and models included in the CompleteEASE software. This model returned an oxide layer thickness of 2.3 nm for the VASE measurements, and a range of oxide thicknesses between 2.3 and 2.7 nm for the ellipsometry mapping measurements.
Table II.
Ellipsometry and AFM determined ClSi and pNaSS film thicknesses (nm). SE mapping thicknesses are reported as the avg ± stdev of the 25 spots measured across each sample (see Fig. 6). Scratch test thicknesses are reported as the avg ± stdev of three spots across each sample. Replicate number refers to the fact that two replicates of each substrate were prepared and analyzed after each treatment.
| Substrate | Film | Replicate number | VASE (nm) | SE mapping (nm) | Scratch test (nm) |
|---|---|---|---|---|---|
| Si | ClSi | 1 | 1.3 | 1.5 ± 0.2 | 1.4 ± 0.2 |
| 2 | 1.8 | 1.2 ± 0.1 | 1.1 ± 0.1 | ||
| pNaSS | 1 | 24.7 | 25.4 ± 3.8 | 16.8 ± 2.1 | |
| 2 | 45.7 | 48.9 ± 5.9 | 49.0 ± 3.8 | ||
| Ti | ClSi | 1 | 2.3 | 2.1 ± 0.2 | 1.9 ± 0.1 |
| 2 | 1.1 | 0.9 ± 0.1 | 1.6 ± 0.2 | ||
| pNaSS | 1 | 13.2 | 13.3 ± 0.5 | 10.8 ± 1.3 | |
| 2 | 33.8 | 34.9 ± 3.4 | 41.0 ± 8.8 |
The modeling of deposited Ti VASE spectra is complicated by the large band gap. Additionally, the high reactivity of Ti means that, even under high vacuum conditions, the oxide film composition is difficult to control and can vary with thickness to include suboxides (e.g., ), nitrides, and carbides.47, 48, 49 Thus, developing a physically meaningful VASE model that accurately describes the optical properties and thickness of deposited Ti film is nontrivial. However, determination of the Ti substrate optical properties is not a focus of this study. Therefore, the analysis was simplified by treating the blank Ti samples as a single layer using a B-spline function to parameterize the pseudo optical properties of the substrate.50, 51
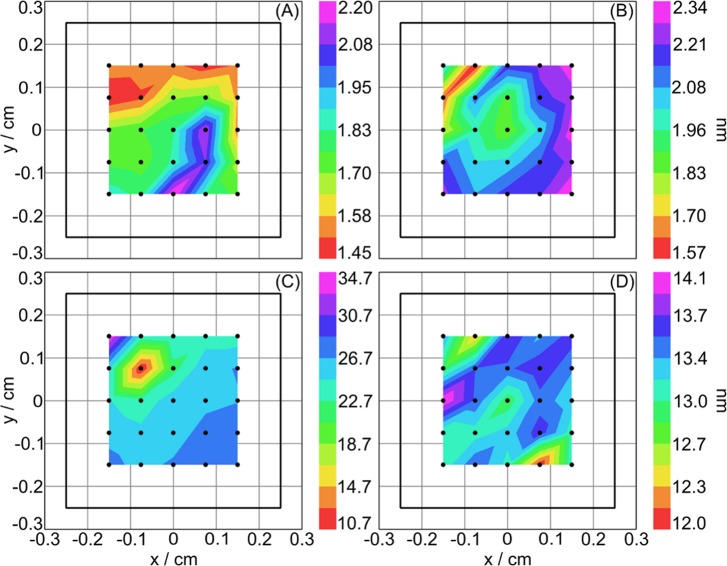
The Cauchy dispersion equation, which is suitable for transparent thin films such as silanes,50, 52 was used to fit the VASE measurements on the ClSi-functionalized substrates. The Cauchy model yielded ClSi-layer thicknesses of ∼1.5 nm on Si, and 1–2 nm on Ti, which are in good agreement with the XPS-determined overlayer thicknesses. This indicates that the ClSi functionalization process produces similar thickness films on both Si and Ti substrates. Thickness maps for one replicate ClSi-functionalized on the Si and Ti substrates are shown in Figs. 6a, 6b, respectively.
Figure 6.
(Color online) Ellipsometry thickness maps for the ClSi-functionalized Si (a) and Ti (b) substrates, and for NaSS-grafted Si (c) and Ti (d) substrates.
The pNaSS films on both substrates had a visible yellow tint to them. Therefore, in addition to absorbing in the UV range due to benzene ring π–π* transition,53 they absorb in the yellow visible range (∼600 nm). Therefore, the optical properties were once again parameterized with a B-spline function, yielding pNaSS film thicknesses between 25 and 49 nm on Si, and 13 and 34 nm on Ti. Figures 6c, 6d show the pNaSS films to be fairly uniform across the substrate, and that the wide range in pNaSS film thicknesses represents the variability between replicates. It should be noted that the thinner Si and Ti replicates both came from the same reaction vial, as did the thicker Si and Ti replicates. Thicknesses obtained from AFM scratch test measurements (Table Table II.) are in excellent agreement with the ellipsometry results. Thickness maps for one replicate of the NaSS-grafted Si and Ti samples are shown in Figs. 6c, 6d, respectively. Thus, it appears that the grafting reaction produces slightly thicker films on Si, and that relatively large variances in film thickness may be expected between batches. These differences are despite running each reaction with one Si and one Ti each vial, and using the same catalyst mixture for all reactions.
The film-thickness differences between substrates might be attributed to differences in ClSi film quality, since organosilane self-assembled monolayer quality is known to be affected by substrate roughness and surface chemistry.54 This hypothesis is supported by the SE mapping measurements, since the ClSi film thicknesses on Ti are much more variable than on Si: the 2.1 nm average thickness for Ti replicate 1 could be indicative of multilayer formation, and the 0.9 nm average thickness for replicate 2 could be indicative of a less well-ordered film. As a reference, organosilane monolayers on Si were found to be ∼1.5 nm thick, which is in the same range as the ClSi films on Si.55 The film-thickness differences between batches could also be due to sensitivity toward small variances in reaction conditions. For example, ATRP is very sensitive to oxygen. Therefore, solvents are always degassed with either nitrogen or argon to purge dissolved oxygen, and reactions quenched by exposure to air.18, 19, 20, 21, 22, 23, 24, 25, 26, 27, 28, 29, 30, 31, 32 Thus, it may be that a small leak in vial 1 lead to the premature termination of the grafting reaction and thinner pNaSS films on Si and Ti replicate 1.
AFM
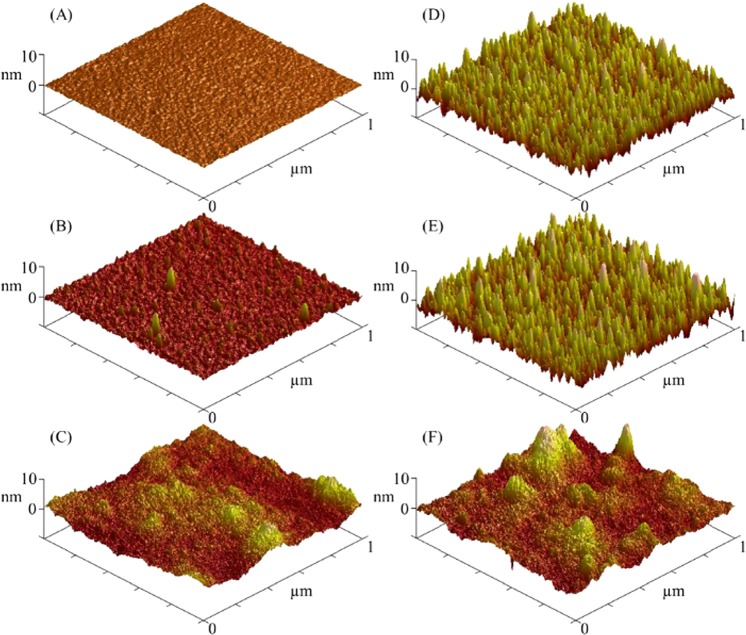
AFM images are shown in Fig. 7, and average RMS roughness values ± standard deviations are reported in Table Table I.. Within error, the Ti roughness values remain constant regardless of treatment. The AFM images [Figs. 7d, 7e, 7f] show the surface topography of the Ti samples to be unchanged by the ClSi treatment and significantly changed by the pNaSS grafting. However, the Si roughness values increase significantly with each treatment, as does the surface topography [Figs. 7a, 7b, 7c]. Interestingly enough, despite the difference in roughness values between the bare Ti and Si substrates, within error there is no difference in the roughness values of the NaSS films grafted from the two substrates. This indicates that the NaSS film is thick enough to obscure the initial Ti roughness, and that the uniformity of NaSS films grown by surface initiated ATRP under the above reported conditions can be taken to be approximately 2 nm.
Figure 7.
(Color online) 1 × 1 μm2 AFM images of bare Si (a) and Ti (d) substrates, ClSi-functionalized Si (b) and Ti (e) substrates, and NaSS grafted Si (c) and Ti (f) substrates.
SUMMARY AND CONCLUSIONS
In this study, we used ATRP to graft NaSS from ClSi functionalized Si and Ti surfaces. The composition, molecular structure, thickness, and topography of the grafted pNaSS films were characterized with XPS, ToF-SIMS, VASE, and AFM, respectively. XPS and ToF-SIMS results confirmed that both Si and Ti substrates were successfully first functionalized with a ClSi layer and then grafted with a laterally chemically homogeneous NaSS film. VASE and spectroscopic ellipsometry mapping measurements found the grafting reaction produces slightly thicker NaSS films on Si versus Ti substrates, and that relatively large variances in film thickness may be expected between batches. AFM found that within error there is no difference in NaSS film roughness values between the Si and Ti substrates, despite relatively large differences in bare-substrate roughness values. Thus, we have successfully produced chemically homogeneous and relatively smooth NaSS-grafted substrates. These may now be used in subsequent studies testing the hypothesis that pNaSS-grafted Ti implants preferentially adsorb certain plasma proteins in an orientation and conformation that modulates the foreign body response and promotes formation of new bone.
ACKNOWLEDGMENTS
This study was supported by NIH grant EB-002027 (R.N.F. and D.G.C.) and ONR grant N000141210441 (A.J.K. and S.J.). The ellipsometry experiments were done at the University of Washington Nanotechnology User Facility, a member of the NSF National Nanotechnology Infrastructure Network. Veronique Migonney is thanked for stimulating discussions about the preparation and biological applications of grafted NaSS films. Special thanks to Jonathan Lane, without whose mentorship, and encouragement to publish these results, this publication might not have been realized.
References
- Kokubo T., Pattanayak D. K., Yamaguchi S., Takadama H., Matsushita T., Kawai T., Takemoto M., Fujibayashi S., and Nakamura T., J. R. Soc. Interface 7, S503 (2010). 10.1098/rsif.2010.0129.focus [DOI] [PMC free article] [PubMed] [Google Scholar]
- Ban S., Iwaya Y., Kono H., and Sato H., Dent. Mater. 22, 1115 (2006). 10.1016/j.dental.2005.09.007 [DOI] [PubMed] [Google Scholar]
- Castner D. G. and Ratner B. D., Surf. Sci. 500, 28 (2002). 10.1016/S0039-6028(01)01587-4 [DOI] [Google Scholar]
- Liu X., Chu P. K., and Ding C., Mater. Sci. Eng., R 47, 49 (2004). 10.1016/j.mser.2004.11.001 [DOI] [Google Scholar]
- Le Guéhennec L., Soueidan A., Layrolle P., and Amouriq Y., Dent. Mater. 23, 844 (2007). 10.1016/j.dental.2006.06.025 [DOI] [PubMed] [Google Scholar]
- Pavon-Djavid G., Gamble L. J., Ciobanu M., Gueguen V., Castner D. G., and Migonney V., Biomacromolecules 8, 3317 (2007). 10.1021/bm070344i [DOI] [PubMed] [Google Scholar]
- Helary G., Noirclere F., Mayingi J., Bacroix B., and Migonney V., J. Mater. Sci. Mater. Med. 21, 655 (2010). 10.1007/s10856-009-3892-0 [DOI] [PubMed] [Google Scholar]
- Helary G., Noirclere F., Mayingi J., and Migonney V., Acta Biomater. 5, 124 (2009). 10.1016/j.actbio.2008.07.037 [DOI] [PubMed] [Google Scholar]
- Michiardi A., Helary G., Nguyen P. C. T., Gamble L. J., Anagnostou F., Castner D. G., and Migonney V., Acta Biomater. 6, 667 (2010). 10.1016/j.actbio.2009.08.043 [DOI] [PMC free article] [PubMed] [Google Scholar]
- Vaquette C., Viateau V., Guérard S., Anagnostou F., Manassero M., Castner D. G., and Migonney V., Biomaterials 34, 7048 (2013). 10.1016/j.biomaterials.2013.05.058 [DOI] [PMC free article] [PubMed] [Google Scholar]
- Zhou J., Manassero M., Migonney V., and Viateau V., IRBM News 30, 153 (2009). 10.1016/j.irbm.2009.06.001 [DOI] [Google Scholar]
- Kerner S., Migonney V., Pavon-Djavid G., Helary G., Sedel L., and Anagnostou F., J. Mater. Sci. Mater. Med. 21, 707 (2010). 10.1007/s10856-009-3928-5 [DOI] [PubMed] [Google Scholar]
- Zorn G., Baio J. E., Weidner T., Migonney V., and Castner D. G., Langmuir 27, 13104 (2011). 10.1021/la201918y [DOI] [PMC free article] [PubMed] [Google Scholar]
- Edmondson S., Osborne V. L., and Huck W. T. S., Chem. Soc. Rev. 33, 14 (2004). 10.1039/b210143m [DOI] [PubMed] [Google Scholar]
- Coessens V., Pintauer T., and Matyjaszewski K., Prog. Polym. Sci. 26, 337 (2001). 10.1016/S0079-6700(01)00003-X [DOI] [Google Scholar]
- Tugulu S. and Klok H.-A., Biomacromolecules 9, 906 (2008). 10.1021/bm701293g [DOI] [PubMed] [Google Scholar]
- Barbey R., Lavanant L., Paripovic D., Schüwer N., Sugnaux C., Tugulu S., and Klok H.-A., Chem. Rev. 109, 5437 (2009). 10.1021/cr900045a [DOI] [PubMed] [Google Scholar]
- Xu F. J., Xu D., Kang E. T., and Neoh K. G., J. Mater. Chem. 14, 2674 (2004). 10.1039/b406503d [DOI] [Google Scholar]
- Xu F. J., Kang E. T., and Neoh K. G., Macromolecules 38, 1573 (2005). 10.1021/ma049225a [DOI] [Google Scholar]
- Xu F. J., Kang E. T., and Neoh K. G., J. Mater. Chem. 16, 2948 (2006). 10.1039/b604410g [DOI] [Google Scholar]
- Tu C.-Y., Liu Y.-L., Lee K.-R., and Lai J.-Y., Polymer 46, 6976 (2005). 10.1016/j.polymer.2005.05.116 [DOI] [Google Scholar]
- Liu Y.-L., Luo M.-T., and Lai J.-Y., Macromol. Rapid Commun. 28, 329 (2007). 10.1002/marc.200600718 [DOI] [Google Scholar]
- Yu W. H., Kang E. T., and Neoh K. G., Langmuir 21, 450 (2005). 10.1021/la0485531 [DOI] [PubMed] [Google Scholar]
- Zhai G., Kang E. T., and Neoh K. G., Macromolecules 37, 7240 (2004). 10.1021/ma048894l [DOI] [Google Scholar]
- Xiao-He Y., Qiang Y., Hao Y., Li W. and Yu-Quan C., Chin. J. Analytical Chem. 35, 1751 (2007). 10.1016/S1872-2040(08)60007-9 [DOI] [Google Scholar]
- Kong H., Luo P., Gao C., and Yan D., Polymer 46, 2472 (2005). 10.1016/j.polymer.2005.01.037 [DOI] [Google Scholar]
- Marutani E., Yamamoto S., Ninjbadgar T., Tsujii Y., Fukuda T., and Takano M., Polymer 45, 2231 (2004). 10.1016/j.polymer.2004.02.005 [DOI] [Google Scholar]
- Lei Z., Li Y., and Wei X., J. Solid State Chem. 181, 480 (2008). 10.1016/j.jssc.2007.12.004 [DOI] [Google Scholar]
- Chen X., Randall D. P., Perruchot C., Watts J. F., Patten T. E., von Werne T., and Armes S. P., J. Colloid Interface Sci. 257, 56 (2003). 10.1016/S0021-9797(02)00014-0 [DOI] [PubMed] [Google Scholar]
- Lei Z., Bi S., Hu B., and Yang H., Food Chem. 105, 889 (2007). 10.1016/j.foodchem.2007.04.045 [DOI] [Google Scholar]
- Vo C.-D., Schmid A., Armes S. P., Sakai K., and Biggs S., Langmuir 23, 408 (2007). 10.1021/la063003j [DOI] [PubMed] [Google Scholar]
- Sankhe A. Y., Husson S. M., and Kilbey S. M., J. Polym. Sci., Part A: Polym. Chem. 45, 566 (2007). 10.1002/pola.21817 [DOI] [Google Scholar]
- Keefe A. J., Brault N. D., and Jiang S., Biomacromolecules 13, 1683 (2012). 10.1021/bm300399s [DOI] [PMC free article] [PubMed] [Google Scholar]
- Wagner M. S., Tyler B. J., and Castner D. G., Anal. Chem. 74, 1824 (2002). 10.1021/ac0111311 [DOI] [PubMed] [Google Scholar]
- Wagner M. S., Graham D. J., Ratner B. D., and Castner D. G., Surf. Sci. 570, 78 (2004). 10.1016/j.susc.2004.06.184 [DOI] [Google Scholar]
- Wagner M. S., Graham D. J., and Castner D. G., Appl. Surf. Sci. 252, 6575 (2006). 10.1016/j.apsusc.2006.02.073 [DOI] [Google Scholar]
- Graham D. J. and Castner D. G., Biointerphases 7, 1 (2012). 10.1007/s13758-012-0049-3 [DOI] [PMC free article] [PubMed] [Google Scholar]
- Graham D. J. and Castner D. G., Mass Spectrom. 2, S0014 (2013) 10.5702/massspectrometry.S0014. [DOI] [PMC free article] [PubMed] [Google Scholar]
- Choi C.-K. and Kim Y.-B., Polym. Bull. 49, 433 (2003). 10.1007/s00289-003-0130-7 [DOI] [Google Scholar]
- Weaver J. V. M., Bannister I., Robinson K. L., Bories-Azeau X., Armes S. P., Smallridge M., and McKenna P., Macromolecules 37, 2395 (2004). 10.1021/ma0356358 [DOI] [Google Scholar]
- Castner D. G. and Ratner B. D., Surf. Interface Anal. 15, 479 (1990). 10.1002/sia.740150807 [DOI] [PMC free article] [PubMed] [Google Scholar]
- Beamson G. and Briggs D., High Resolution XPS of Organic Polymers: The Scienta ESCA300 Database (Wiley, Chichester, 1992). [Google Scholar]
- Smith G. C., J. Electron. Spectrosc. Relat. Phenom. 148, 21 (2005). 10.1016/j.elspec.2005.02.004 [DOI] [Google Scholar]
- Techane S. D., Gamble L. J., and Castner D. G., J. Phys. Chem. C 115, 9432 (2011). 10.1021/jp201213g [DOI] [PMC free article] [PubMed] [Google Scholar]
- Wagner C. D., Riggs W. M., Davis L. E., and Moulder J. F., Handbook of X-Ray Photoelectron Spectroscopy (Perkin-Elmer Corporation Physical Electronics Division, Eden Prairie, MN, 1979). [Google Scholar]
- Chilkoti A., Castner D. G. and Ratner B. D., Appl. Spectrosc. 45, 209 (1991). 10.1366/0003702914337588 [DOI] [Google Scholar]
- Jeyachandran Y. L., Karunagaran B., Narayandass S. K., Mangalaraj D., Jenkins T. E., and Martin P. J., Mater. Sci. Eng., A 431, 277 (2006). 10.1016/j.msea.2006.06.020 [DOI] [Google Scholar]
- Bhattacharyya D., Sahoo N. K., Thakur S., and Das N. C., Thin Solid Films 360, 96 (2000). 10.1016/S0040-6090(99)00966-9 [DOI] [Google Scholar]
- Sun L. and Hou P., Thin Solid Films 455–456, 525 (2004). 10.1016/j.tsf.2004.01.059 [DOI] [Google Scholar]
- Franquet A., Terryn H., Bertrand P., and Vereecken J., Surf. Interface Anal. 34, 25 (2002). 10.1002/sia.1245 [DOI] [Google Scholar]
- Johs B. and Hale J. S., Phys. Status Solidi A 205, 715 (2008). 10.1002/pssa.200777754 [DOI] [Google Scholar]
- J. A. Woollam Co. Inc., CompleteEASETM software manual, version 4.63 ed. (2011).
- Pettersson L. A. A., Ghosh S., and Inganäs O., Org. Electron. 3, 143 (2002). 10.1016/S1566-1199(02)00051-4 [DOI] [Google Scholar]
- Vogel N., Jung M., Retsch M., Knoll W., Jonas U., and Köper I., Small 5, 821 (2009). 10.1002/smll.200801583 [DOI] [PubMed] [Google Scholar]
- Wasserman S. R., Tao Y. T., and Whitesides G. M., Langmuir 5, 1074 (1989). 10.1021/la00088a035 [DOI] [Google Scholar]


