

Abstract
Post-transcriptional processing of some long non-coding RNAs (lncRNAs) reveals that they are a source of miRNAs. We show that the 268-nt non-coding RNA component of mitochondrial RNA processing endoribonuclease, (RNase MRP), is the source of at least two short (∼20 nt) RNAs designated RMRP-S1 and RMRP-S2, which function as miRNAs. Point mutations in RNase MRP cause human cartilage–hair hypoplasia (CHH), and several disease-causing mutations map to RMRP-S1 and -S2. SHAPE chemical probing identified two alternative secondary structures altered by disease mutations. RMRP-S1 and -S2 are significantly reduced in two fibroblast cell lines and a B-cell line derived from CHH patients. Tests of gene regulatory activity of RMRP-S1 and -S2 identified over 900 genes that were significantly regulated, of which over 75% were down-regulated, and 90% contained target sites with seed complements of RMRP-S1 and -S2 predominantly in their 3′ UTRs. Pathway analysis identified regulated genes that function in skeletal development, hair development and hematopoietic cell differentiation including PTCH2 and SOX4 among others, linked to major CHH phenotypes. Also, genes associated with alternative RNA splicing, cell proliferation and differentiation were highly targeted. Therefore, alterations RMRP-S1 and -S2, caused by point mutations in RMRP, are strongly implicated in the molecular mechanism of CHH.
INTRODUCTION
Cartilage–hair hypoplasia (CHH) is an autosomal recessive disorder arising from mutations in the non-coding RNA component of mitochondrial RNA-processing endoribonuclease encoded by the RNase MRP gene (1–4). In 1965, McKusick et al. described CHH in the Amish population and recognized it as an inherited disease (5). Patients presented with metaphyseal osteochondrodysplasia that caused short-limbed dwarfism and fine, sparse, light-colored hair (5). The CHH carrier frequency is 1:10 in the Amish population, and 1:76 among the Finnish (5, 6). As the disease has been further studied, many additional variable features have come to light. Several of these include mild-to-severe immunological deficiencies (7, 8), severe anemia (9) and gastrointestinal malabsorption or Hirschsprung's disease (10). One of the major concerns in CHH is a 6–10% incidence of malignancies. Primarily, lymphomas, leukemia, skin, eye and liver neoplasms have been reported (5, 7, 11, 12).
The molecular genetic basis for CHH was discovered when bi-allelic mutations were identified in RNase MRP located on chromosome 9p13, which encodes a 268-nt untranslated RNA subunit (designated RMRP) (1, 11, 13, 14). Since then, >90 different mutations in RNase MRP have been associated with the wide clinical spectrum of CHH (11, 15, 16). Homozygosity for the founder mutation 70A>G accounts for most of CHH cases among the Amish and Finnish populations (2, 3); however, the disease is often caused by compound heterozygosity for other point mutations, deletions and duplications in the RNase MRP gene and its promoter (4). The transcription start site is highly conserved, and mutations in the promoter have been shown to drastically affect the rate of gene transcription (3). Only two patients with biallelic mutations in the 5′ regulatory region of the RNase MRP have been reported (7, 17), consistent with the notion that such mutations are particularly detrimental and may be embryonically lethal. In this regard, RNase MRP is essential for early murine development (18). Short stature with metaphyseal dysplasia is a hallmark of the whole spectrum that ranges from milder phenotypes including metaphyseal dysplasia without hypotrichosis (16) and CHH to the severe anauxetic dysplasia (AD) (11). Although mutations in the promoter 5′ regulatory region have been associated with the severe AD skeletal phenotype (4), a clear-cut association of specific mutations with specific disease phenotypes has not been forthcoming.
The cellular biology associated with the major CHH phenotypes suggests that CHH is likely to be caused by alterations in the biology of stem cells. For example, the normal growth and differentiation of bone is dependent upon the ability of the progeny of mesenchymal stem/progenitor cells (MSPC) differentiate into chondrocytes and osteoblasts in bone growth plates (19–21). Any dysfunction of these cells caused by RNase MRP mutations would likely cause the common dwarfism phenotype (2, 5, 15). Furthermore, MSPC are also the source of stem cells for hematopoiesis (22, 23) and basal stem cells in hair follicles (23). Finally, bone marrow failure has been frequently observed in CHH, suggesting inability to sustain the hematopoietic stem cell pool (7, 24). Therefore, abnormal function of stem cells can account for all the major phenotypes of CHH and understanding the role of RMRP in their biology will likely be fundamental to understanding the disease. This report suggests an RNAi-based mechanism by which mutations in RNase MRP may cause CHH phenotypes.
RNase MRP is a ubiquitously expressed intronless gene transcribed by RNA polymerase III from nuclear DNA (25, 26). The human transcript folds into a highly complex secondary structure associated with 7–10 proteins (27–29). The transcription start site is highly conserved and mutations in the promoter that alter it are associated with severe forms of CHH (1, 15). The promoter mutations that alter the 5′ end of RMRP are only observed in the compound heterozygous state and are thought to be lethal in the homozygous state (1, 3). RMRP has been identified primarily in the nucleus and nucleolus, and a small portion has been found in mitochondria (30). It was the first nuclear-synthesized RNA shown to be transported to the mitochondria (31). In mitochondria, RMRP acts as an endonuclease that cleaves an RNA synthesized from the origin of DNA replication to produce an RNA primer for leading strand synthesis of mitochondrial DNA (32). However, the complete loss of this activity in yeast does not block mitochondrial growth, suggesting that other endonucleases can substitute for RMRP in the mitochondria (32). Therefore, alterations in this activity of RMRP are not thought to be causally related to CHH syndromes.
The RMRP present in nucleoli also carries out an essential function in the final processing steps of 5.8S rRNA (33). In yeast, RMRP was found to be responsible for the final cleavage of a short segment of RNA from pre-5.8S rRNAs to produce the final mature functional 5S rRNA (34). Extension of studies to mammalian cells confirmed the nuclear 5.8S rRNA-processing activity of RMRP (4, 11). Furthermore, it has been shown that knockdown of RMRP causes major defects in ribosome functions during protein synthesis and an expected major reduction in growth (4). Ten other point mutations scattered throughout the RNase MRP gene that may alter the secondary structure of RMRP cause significant reduction in 5.8S rRNA processing (4). Patients with these mutations survive and present many different phenotypes, suggesting that this activity is unlikely to be involved in CHH.
It was recently reported that RMRP forms a complex with the telomerase-associated reverse transcriptase (TERT) (35). The TERT/RMRP complex exhibits RNA-dependent RNA polymerase activity and produces dsRNAs that can be processed into siRNAs by Dicer. This activity was identified in highly malignant tumor cells, and its importance in somatic cells that are generally TERT negative is not clear. Also, antisense reads of RMRP are very rare in cells (36) and not enriched in Argonaute RNPs (37). The relevance of this activity to CHH, should it exist in stem cells, remains to be determined.
Despite the above-mentioned advances, a unifying mechanism to explain RMRP action and especially the specific effects of point mutation in causing the widely variable CHH syndromes is lacking. Here we show that nuclear RMRP can act as a reservoir for the production of a class of small RNAs that we designate ‘silencing long non-coding derived RNAs’ (silondRNAs). In addition, we show that these silondRNAs, specifically named RMRP-S1 and RMRP-S2, have robust silencing activity that targets sets of genes that are directly related to many of the CHH phenotypes. As such, our data establish a new paradigm that may account for the specific and variable effects of RMRP point mutations and variable phenotypes of CHH.
RESULTS
Deep sequencing reveals two enriched segments of RMRP
It has been reported that lncRNAs can be the source of miRNA (38). To identify such RNAs on a broad basis, we fractionated total RNA from normal human liver and cirrhotic human liver by 15% PAGE, extracted small RNAs of ∼19–30 nt and constructed a library using Illumina technology. Deep sequencing reads from normal and cirrhotic liver libraries were obtained and mapped to the human genome. The sequencing reads have been deposited into SRA (NCBI BioProject PRJNA219492, SRA Study SRP030022).
In this report, we focus on the small RNAs that were sequenced from RNase MRP. The reads that mapped to RNase MRP were distributed across the gene with a very distinct enrichment of two regions of the gene designated RMRP-S1 (originating from the 5′ end of RMRP) and RMRP-S2 (originating from the middle of RMRP) (Fig. 1). We identified a major transcript initiating at the RefSeq annotated start site of RMRP. However, we also identified significant numbers of reads initiating at +1 and +2 from the RefSeq start site (Fig. 1). These data identified RNA reads from 20 to 22 nt initiating from RMRP nt 5′ end through +2 nt. In contrast, RMRP-S2 reads had a very distinct 5′ end at nt 140 (Fig. 1). Interestingly, the depth of reads for RMRP-S1 and -S2 were reversed in normal liver versus cirrhotic liver. In normal liver, the S1/S2 read ratio was 0.19, whereas in cirrhotic liver, the S1/S2 ratio was 2.0, suggesting different processing or stability of the small RNAs in healthy versus diseased tissue.
Figure 1.
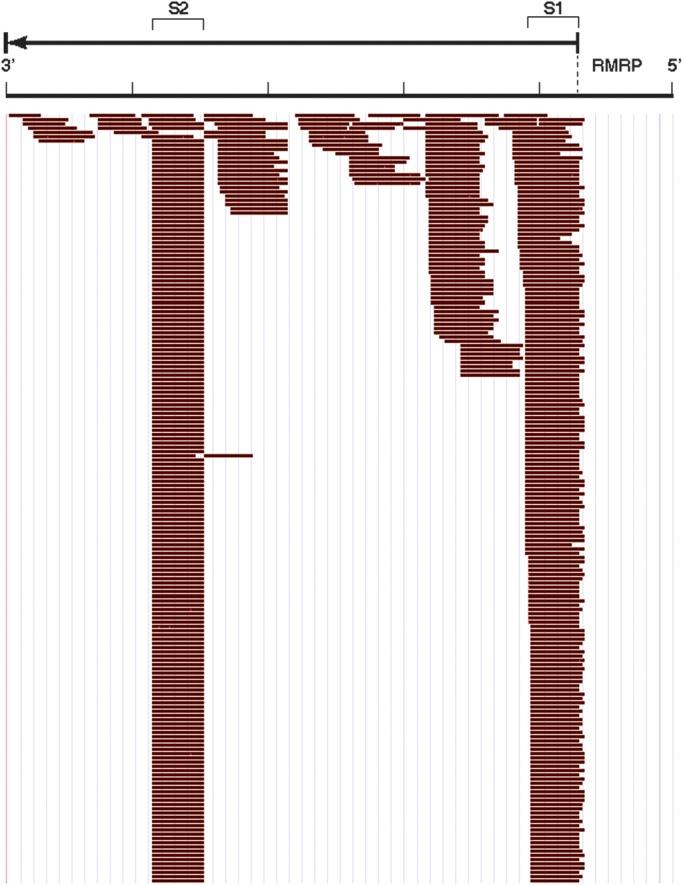
Profile of small RNA reads across RMRP from miSeq library prepared from normal liver. RMRP gene is represented 5′ to 3′ (right to left) with the RMRP RNA sequence denoted by the arrow above the read profile. S1- and S2-labeled brackets denote the segments identified as RMRP-S1 and RMRP-S2, respectively. Individual reads identified by Maroon Bars below the gene. No antisense RNA reads were detected. The sequence profiles of S1 and S2 were cut off at the same depth of reads for illustration purposes. The ratio of depth of reads for S1/S2 in normal liver was 0.19 and for cirrhotic liver (profile not shown) was 2.0.
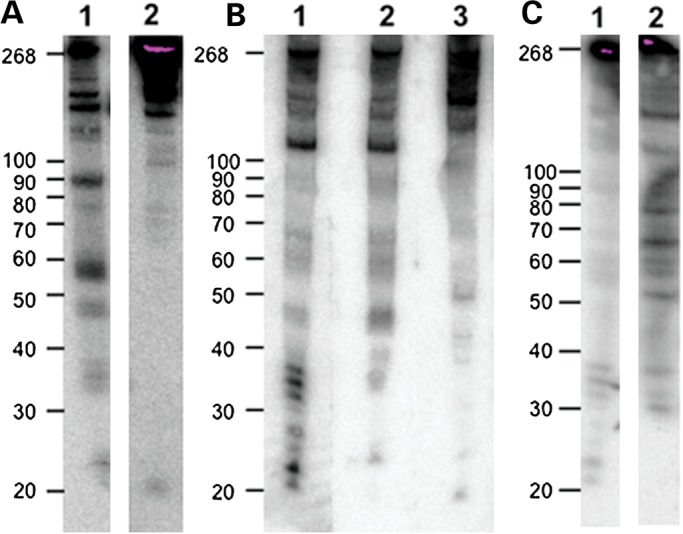
We independently identified the 5′ ends of RMRP-S1 and -S2 in the RNA preparations from two cirrhotic liver RNA preparations, using S1 nuclease protection assays (Fig. 2A). The full-length probes migrated to their predicted positions in the negative control (no S1 nuclease added). This analysis identified a set of three major and two minor 5′ start sites that mapped from nucleotides −2 to +2 for RMRP-S1, confirming the sequencing read data (Fig. 2B, Lanes 1–3). For RMRP-S2, S1 nuclease analysis identified only one major 5′ end at nucleotide 140, also consistent with the sequencing data (Fig. 2B, Lanes 4–6).
Figure 2.

Mapping of 5′ ends of RMRP-S1 and -S2. (A) Top lines, locations of input probes S1 and S2 on the full-length RMRP gene (left–right 5′–3′). Sequences of the S1 and S2 input probes below the map. Arrows denote locations of transcript start sites determined by S1 nuclease protection shown in (B). Black arrows, equal strongest bands; gray arrows, less strong bands. (B) S1 nuclease protection assay results. Lane 1: input probe for RMRP-S1; Lanes 2 and 3: protected fragments in two different cirrhotic liver RNAs. Lane 4: input probe for RMRP-S2; Lanes 5 and 6: protected fragments in two cirrhotic liver RNAs.
We next wanted to determine in what proportions the fragments from RMRP-S1 were present in different tissues and cells and whether we could detect a single species for RMRP-S2. For this, we probed northern blots of RNA from cirrhotic liver, human embryonic kidney 293 (HEK293) cells and MSPC (Fig. 3A–C). In cirrhotic liver, we detected a weak-hybridizing region between 20 and 22 nt with a 5′ end probe (5′ nt 1–20) detecting RMRP-S1 and a single band of 19–20 nt using a probe that detects RMRP-S2. In HEK293 cells, a clear set of four bands between 20 and 30 nt were detected and in MSPC two distinct bands of ∼21 and 23 nt were detected using the RMRP-S1 probe. Interestingly, a second 5′ end probe detecting nt 21–40 of RMRP also detected a small RNA of ∼23–24 nt (Fig. 3B, Lane 2). This fragment has been previously reported as associated with Argonaute (35). Taken together these data support the conclusion that there are multiple RMRP 5′ end fragments that occur in differing abundance in different cells. In addition, we observed that a certain proportion of RMRP RNAs exist as larger fragments as shown by fragments between 30 and 40 nt and larger, especially a major band at 125 nt that maps a cleavage site toward the middle of the RNA.
Figure 3.
Northern blot analysis of RMRP RNAs in cirrhotic liver, HEK293 cells and MSPCs. (A) Northern blot analysis of cirrhotic liver RNA with antisense probes to RMRP-S1 and -S2-detected small RNAs of 22 and 20 nt, respectively. Lane 1: probe detecting RMRP-S1; Lane 2: probe detecting RMRP-S2. Left markers in nucleotides, full-length RMRP = 268 nt. (B) Northern blot detection of RMRP-S1 and RMRP-S2 in HEK293 cells. Lane 1: HEK293 RNA hybridized with probe 5′ nt 1–20. Fragments at ∼21–23 are RMRP-S1. Lane 2: HEK293 RNA hybridized with probe 5′ nt 21–40. Note fragment at ∼23 nt that is similar to RMRP fragment detected by Maida (35). Lane 3: HEK293 RNA hybridized with probe 5′ nt 140–160. Fragment at ∼20 nt is RMRP-S2. (C) Northern blot detection and mapping of RMRP fragments using 5′ and 3′ end probes 01 (5′ end) and 10 (3′ end, nt 240–268). Northern blot used total RNA from MSPC. Lane 1: northern blot of RMRP detected by 5′ end probe O1 (nt 1–20). Note two prominent bands at 20–22 nt designated as RMRP-S1. Lane 2: northern blot of RMRP detected by 3′ end probe O10 (nt 240–268).
A different picture emerged when northern blots were hybridized with a probe detecting RMRP-S2. In all cases, we only detected a single band of ∼19–20 nt (Fig. 3A, Lane 2; 3B, Lane 3). Interestingly, in MSPC, we did not detect a band representing RMRP-S2 (data not shown) whereas the clear single bands representing RMRP-S2 were detected in cirrhotic liver and HEK293 cells (Fig. 3A, Lane 2; 3B, Lane 3). This demonstrates that RMRP processing may vary in different cell contexts. To further characterize RMRP processing, we probed a northern blot of MSPC RNA with a probe detecting the 3′ end of RMRP (probe 010). Probe 10 detected major bands of ∼29, 35, 50, 57, 59, 65, 75, 110 and 145 (Fig. 3C, Lane 2). In addition, RMRP-S1, probe 01, detected bands at ∼37, 38, 41, 60–65 and a major band at ∼100 nt (plus other non-measurable bands greater than the 100-nt marker) (Fig. 3C, Lane 1). This enabled us to obtain an approximate map of RMRP processing fragments extending from the ends of RMRP into the central portion of the RNA (Supplementary Material, Fig. S1).
Quantitative analysis of the northern blot lanes including full-length RMRP showed that RMRP-S1 accounted for 0.79% of the total RMRP in MSPC RNA (Supplementary Material, Fig. S1). A recent paper has demonstrated that the long non-coding RNA H19 serves as a developmental reservoir of miR675 (39). In that report, <0.25% of H19 was processed into miR675 at steady state (39) and this amount of miR-675 was sufficient to confer significant gene-silencing activity (39). Therefore, our results are consistent with full-length nuclear RMRP serving as a reservoir for the production of small RNAs such as RMRP-S1 and -S2 that could act as miRNAs. A possible role in gene silencing was supported by data obtained using the PAR-CLIP method that identified both the RMRP-S1 and -S2 sequences as specifically associated with Argonaute (Supplementary Material, Fig. S2) (37).
Characterization of RMRP secondary structure and identification of small RNAs, RMRP-S1 and -S2, originating from RMRP
As secondary structure is a key regulator of processing of small RNAs, we experimentally determined the secondary structure of RMRP using SHAPE (selective 2′-hydroxyl acylation analyzed by primer extension) (40). Highly reactive nucleotides (SHAPE value > 0.7, Fig. 4A) indicate single-stranded RNA nucleotides (42, 43). Significant improvements in RNA structure prediction are achieved when SHAPE reactivity is incorporated in the structure prediction program SHAPEknots (42). We used this approach to determine the secondary structure of RMRP in solution (44). Overall the SHAPE-determined secondary structure corresponded closely with previously reported secondary structure of RMRP determined by evolutionary analysis (Fig. 4). The SHAPE data confirmed that RMRP-S1 and -S2 are found in distinct stem-loop structures, which are targets for Drosha and Dicer processing (Fig. 4A, red bars).
Figure 4.

(A) RMRP secondary structure determined by SHAPE chemical probing. Red bars alongside the structure denote location of RMRP-S1 and -S2. Gray circles: nucleotides associated with disease causing mutations in CHH (4, 15). Blue to orange heat bar of SHAPE values represents the degree of confidence in single strand at that position as determined by SHAPE chemical mapping. Orange = high confidence; blue = low confidence. (B) Comparison of the RMRP secondary structures determined by SHAPE analysis versus previously published structures. Top, blue circles: RMRP secondary structures determined using SHAPE chemical mapping bottom, Yellow circles: previously published based on RNA co-variation analysis and some chemical and enzymatic probing (15). The structures are drawn as ‘arc’ diagrams using the R-CHIE R package for visualizing RNA (41). Each arc in the diagram represents a base pair, and the RNA sequence is represented as a horizontal line. Left = 5′ end of RMRP, Right = 3′ end of RMRP. RED brackets locations of RMRP-S1 and RMRP-S2. Crossing Arcs identify pseudoknots. In addition, they allow a direct comparison of the structures. In this case, we observe that the SHAPE structure (top, blue) does not have a pseudoknot, while the evolutionarily derived structure (bottom, yellow) does between the P2 and P4 helices. The SHAPE-derived structure instead suggests the formation of an Alternative P2 helix (Alt-P2) that effectively resolves the pseudoknot. We used the SHAPEknots approach to confirm that the SHAPE data are not consistent with the P2–P4 pseudoknot under our solution conditions. In addition, we observe intermediate-to-high SHAPE reactivity for nucleotides 205–217, which include the 3′ end of the P2 helix shown as a black trace in Figure 4B. Nucleotides where it was not possible to obtain SHAPE data are indicated in green. Our SHAPE data are thus consistent with RMRP adopting two alternative conformations (P2 and Alt-P2).
To compare the SHAPE structure directly with the previously published structures, we constructed an ‘arc’ diagram using the R-CHIE R package for visualizing RNA (41) (Fig. 4B). In the arc diagram, the nucleotide sequence of RMRP is represented by the horizontal line with 5′–3′ going left to right. The nucleotide locations of RMRP-S1 and RMRP-S2 are denoted in the sequence by Red Brackets. The upper blue arc depicts the SHAPE-determined structure, and the lower yellow arc diagram depicts previously published structure (15). Nucleotides connected by arcs are base-paired, and series of arcs represent RNA helices (or paired regions). For example, the stem-loop of RMRP-S1 is linked by a large blue arc connecting the 5′ and 3′ ends of RMRP.
A novel feature of arc diagrams is that they can reveal candidate pseudoknots in the secondary structures, which are identified by crossing arcs. We observed that the SHAPE structure (top, blue) does not have a pseudoknot, whereas the evolutionarily derived structure (bottom, yellow) does between the P2 and P4 helices. The SHAPE-derived structure instead suggests the formation of an Alternative P2 helix (Alt-P2) that effectively resolves the pseudoknot.
We used the SHAPEknots approach to confirm that the SHAPE data are not consistent with the P2–P4 pseudoknot under our solution conditions. In addition, we observe intermediate-to-high SHAPE reactivity for nucleotides 205–217, which include the 3′ end of the P2 helix shown as a black trace in Figure 4B. Nucleotides where it was not possible to obtain SHAPE data are indicated in green.
In addition, we observe intermediate-to-high SHAPE reactivity was measured for nucleotides 205–217, which include the 3′ end of the P2 helix shown as a black trace in Figure 4B. Intermediate-to-high SHAPE reactivity was measured for nucleotides 205–217, which includes nucleotides 212–217, which form the 3′ end of the P2 helix; these data are consistent with the absence of a pseudoknot. Thus, the P2 helix is only partially formed under our solution conditions, and our SHAPE data (black trace, Fig. 4B) are consistent with the formation of the Alt-P2 helix. These data suggest that RMRP is capable of adopting at least two alternative structures, one including the P2–P4 pseudoknot (yellow structure, Fig. 4B) and one with the Alt-P2 helix form (blue structure, Fig. 4B). These two conformations may be differentially processed into RMRP-S1 and -S2, and their relative abundance may also be correlated with the amount of each silond in the cell.
Dicer knockdown reduces RMRP-S1 and RMRP-S2 levels
We investigated whether biogenesis of RMRP-S1 and -S2 were dependent upon Dicer activity using siRNAs to knockdown Dicer in HEK293 cells. We transfected a mix of siRNAs previously shown to knock out Dicer (44) and used qRT-PCR to measure the silond levels at 24, 48 and 72 h after initiating transfection (Fig. 5). We observed a near complete knockdown of Dicer at 48 and 72 h and knockdown of RMRP-S1 and -S2 followed at 72 h. Thus, the reduction in RMRP-S1 and -S2 was dependent upon complete knockdown of Dicer for 24 h, suggesting that their mechanism of biogenesis is Dicer dependent.
Figure 5.

Reduction in RMRP-S1 and RMRP-S2 follows Dicer knockdown. (A) TaqMan assays measuring the time course of knockdown of RMRP-S1 and -S2 after Dicer knockdown. Black bars: RMRP-S1, gray bars: RMRP-S2. 48 h RMRP-S2 was not determined. (B) Time course of knockdown of Dicer mRNA after siRNA transfection determined by QRT-PCR assay. Fold difference = 2(−ddCt)+ _SEM (n = 6 for each sample). M = mock; D24, D48 and D72 = 24, 48 and 72 h post-transfection with Dicer siRNA.
Quantitative variation in levels of RMRP-S1 and RMRP-S2 in a spectrum of cell types
The above-mentioned analyses suggested that significant differences in the relative levels of RMRP-S1 and -S2 may exist in tissues and cells raising the possibility that RMRP may be processed in a cell-type-dependent manner. To obtain quantitative measurements, we had custom stem-loop primers designed by Dharmacon, Inc. to produce quantitative TaqMan assays for RMRP-S1 and -S2. The 3′ end stem-loop primers were designed such that RMRP-S1 or -S2 and not full-length RMRP would be detected. Using these assays, we measured RMRP-S1 and -S2 levels in: human embryonic stem cells (hES) and eight independently derived human induced Pluripotent Stem cell lines (hiPS). Relative to normal human dermal fibroblasts (NHDF), the levels of RMRP-S1 and -S2 were 8-fold and 5-fold higher in the hES cell line at passage 73 (Fig. 6A, H1ES p73). However, the levels of RMRP-S1 and -S2 were highly variable in the hiPS cell lines. In four hiPS lines, RMRP-S1 was approximately equal to NHDF, and it was reduced by 40–80% in the other four hiPS lines. In contrast, RMRP-S2 levels were greatly reduced in all the hiPS lines compared with NHDF (Fig. 6A).
Figure 6.

(A) Human ES cells and selected human iPS cell lines express elevated levels of RMRP-S1 and -S2 compared with NHDF. Quantitative analysis of S1 and S2 levels in H1ES cells (H1ES p73) and 8 independently derived hiPS lines (left to right, 2.2.1 p21, CL4, 2.2.4, 2.2.10, 2.2.19, 2.2.1, 2.2.30, 2.2.31). (Gray bars) RMRP-S1 and (black bars) RMRP-S2 levels were measured by custom Taqman assay (Materials and Methods). Data were normalized using miR-16 expression, and the fold difference was calculated using NHDF as normalization control = 1. Fold difference = 2(−ddCt) + _SEM (n = 6 for each sample). Relative to NHDF, the levels of RMRP-S1 and -S2 were 8-fold and 5-fold higher in the standard human ES cell line at passage 73, H1ESp73. (B) Quantitative analysis of RMRP-S1 (gray bars) and RMRP-S2 (Black bars) in MSPC, fetal human bone marrow derived MSPC, and HCH, primary Human Chondrocytes. NHDF, normal human dermal fibroblasts, used as the reference sample. Levels were measured by Taqman assay as in Figure 5. Data were normalized using miR-16 expression, and the fold difference was calculated using NHDF as normalization control = 1. Fold difference = 2(−ddCt) + _SEM. (N = 6 for each sample). (C) The levels of RMRP-S1 and -S2 are altered during differentiation of human iPS cells. Quantitative changes in RMRP-S1 and -S2 as hiPS are induced toward the hepatocyte lineage were measured by Taqman assay of total cellular RNA. RMRP-S1 (gray bars) and RMRP-S2 (black bars), treatments at each stage listed below bars. Fibroblast: normal cultured human primary fibroblasts. iPS: human iPS clone Activin: Stage 1, hiPS treated with Activin. FGF/BMP4: Stage 2, cells treated with FGF and BMP4. HGF: Stage 3, cells treated with human Hepatocyte Growth Factor. OSM: Stage 4. cells treated with Oncostatin M. Hepatocytes: freshly isolated human hepatocytes were used as the reference sample (45). Data were normalized using miR-16 expression, and the fold difference was calculated using NHDF as normalization control = 1. Fold difference = 2(−ddCt) + _SEM. (n = 3 for each sample).
TaqMan analysis was also carried out for MSPC total RNA (Fig. 6B). Compared with NHDF, RMRP-S1 levels were ∼1.5-fold higher in MSPC and RMRP-S2 levels were 60–80% reduced in MSPC. Both RMRP-S1 and -S2 were detectable in primary chondrocytes. RMRP-S1 was present at levels equivalent to that in NHDF, and RMRP-S2 was significantly lower than the level measured in either NHDF or MSPC.
The above-mentioned data suggested that RMRP-S1 and -S2 levels may vary during cell differentiation. Therefore, we subjected hiPS cells to a differentiation protocol that included the first stages of chondrocyte differentiation and additional differentiation steps toward the hepatocyte lineage. Combinations of Activin, FGF and BMP4 induce primitive streak mesoderm that is a precursor of chondrogenic cells (20). TaqMan analysis revealed a large increase in both RMRP-S1 and -S2 in response to the first differentiation step that involved Activin treatment, which is a common treatment of MSPC toward many cell fates (Fig. 6C) (20). Subsequent treatments with FGF/BMP4, HGF and OSM caused reductions in both RMRP-S1 and -S2. These data revealed that the presence of RMRP-S1 and -S2 is regulated during stem cell differentiation.
Finally, we obtained two fibroblast cell lines from CHH patients with the common homozygous 70A>G mutation. TaqMan analysis of RMRP-S1 and -S2 showed that they were 60 to 70% reduced in the mutant CHH fibroblasts (respectively) compared with NHDF (Fig. 7A). An additional B-cell line from a CHH patient with compound heterozygosity for a −25–5 dup and a 146G>A mutation was analyzed in the same way (Fig. 7B). In this case, RMRP-S1 was 80% reduced and RMRP-S2 60% reduced. As the RMRP 146G>A mutation is in the RMRP-S2 sequence (Fig. 4A), it is possible that the mutation altered the production of RMRP-S2 from that segment of RMRP.
Figure 7.

(A) Primary fibroblasts isolated from CHH patients express significantly lower levels of RMRP-S1 and RMRP-S2 compared with NHDF. Taqman assays specifically detecting RMRP-S1 (left) or RMRP-S2 (right). (NHDF) total RNA isolated from primary NHDF and (GMO3626 and GMO1617) two independent of primary fibroblast isolations from CHH patients with homozygous 70A>G mutation. Data were normalized using miR-16 expression, and the fold difference was calculated using NHDF as normalization control = 1. Fold difference = 2(−ddCt) + _SEM. (n = 9 for each determination). Error bars = ±SEM. (B) EBV-immortalized B cells from a CHH patient express reduced levels of RMRP-S1 and RMRP-S2 compared with normal JY-immortalized B cells. Quantitative analysis of RMRP-S1 (left) and RMRP-S2 (right) in CHH-immortalized B cells, GM08660 (156G>C) compared with JY EBV-immortalized B lymphoblastoid cells, assayed by custom TaqMan assays. Data were normalized using miR-16 expression, and the fold difference was calculated using JY cells as control. Fold difference = 2(−ddCt) + _SEM. (n = 9 for each determination).
RMRP-S1 and -S2 mediate widespread gene regulation with disease relevance
We synthesized mimics and inhibitors of RMRP-S1 and -S2 through Dharmacon (Materials and Methods). The mimics are double-stranded RNAs with modified nucleotides that render them RNase resistant. The inhibitors are antisense RNAs with added stem-loops on each end to promote inhibitory activity. Each was transfected into HEK293 cells in triplicate followed by RNA isolation. HEK293 cells were chosen for initial experiments because they are of fetal origin, have many stem cell characteristics, and their responses to mimics and inhibitors have been well documented. Gene expression was analyzed using Affymetrix arrays. To identify RMRP-S1- and -S2-regulated genes, we calculated the difference between gene expression in the presence of mimic and that in the presence of inhibitor (see Materials and Methods). When cells were treated with irrelevant control oligonucleotides, we detected only one significantly regulated gene.
These experiments produced two dramatically different sets of results (Table 1 and Supplementary Tables S1 and S2). The mimic and inhibitor of RMRP-S1 significantly regulated 35 genes. Down-regulated genes comprised 82% of the response genes. A search for seed sites for RMRP-S1 in the down-regulated genes identified 26 unique target sites of which 16 (61%) were located in the 3′ UTRs. A plot of the degree of up- or down-regulation versus frequency of genes revealed a significant skewing toward down-regulation (Fig. 8A). In contrast, transfections of mimic and inhibitor of RMRP-S2 revealed 901 significantly regulated genes. Down-regulated genes comprised 75% of the responding genes (Table 1, Fig. 8B). Candidate target sites for RMRP-S2 were identified in 93% of the down-regulated genes, and most contained more than one target site. Of the 2811 unique target sites in the down-regulated genes, 1795 sites (63%) were in 3′ UTRs. Furthermore, the density of target sites per kb of 3′ UTR sequence was 2-fold higher than target sites in coding sequences (CDS) in the regulated genes. A plot of the degree of up- or down-regulation versus frequency of genes also revealed a significant skewing toward down-regulation (Fig. 8B). Overall, these data support a very robust silencing activity, especially for RMRP-S2, in HEK293 cells.
Table 1.
Summary table of genes regulated by S1 and S2 in Hek293 cells
| RMRP-S1 |
RMRP-S2 |
|||||
|---|---|---|---|---|---|---|
| Total | Down-regulated | Upregulated | Total | Down-regulated | Upregulated | |
| Responsive genes | 35 | 29 | 6 | 901 | 680 | 221 |
| % genes with target site | 45.0 | 50.0 | 16.7 | 90.6 | 93.3 | 82.9 |
| Total target sites | 32 | 31 | 1 | 5498 | 4599 | 899 |
| Unique target sites | 27 | 26 | 1 | 3297 | 2811 | 486 |
| Unique CDS | 8 | 7 | 1 | 1146 | 893 | 253 |
| Unique 3′ UTR | 16 | 16 | 0 | 1999 | 1795 | 204 |
| Unique Non-coding | 0 | 0 | 0 | 103 | 89 | 14 |
| CDS sites/kb | 0.2 | 0.2 | 0.1 | 0.9 | 0.9 | 0.7 |
| 3′UTR sites/kb | 0.2 | 0.2 | 0.0 | 1.2 | 1.3 | 0.6 |
| ncRNA sites/kb | 0.0 | 0.0 | 0.0 | 1.0 | 1.3 | 0.5 |
Mimics or inhibitors of S1 and S2 were transfected into Hek293 cells and total RNA isolated at 24 h. Regulated genes were detected after hybridization of probes to Affymetrix arrays. Significantly regulated genes were identified by subtracting mimic minus inhibitor values. Control oligonucleotides revealed only one significantly regulated gene. Genes: RefSeq genes on Affymetrix Array. Target sites: 6-nt sequences in regulated genes that are complementary to the seed sequences 5′ nt 1–6, 2–7 or 3–8 of RMRP-S1 or -S2. Unique target sites: target sites represented only one time in a gene. Unique CDS, 3′ UTR; non-coding: location of target sites in gene bodies. CDS, 3′ UTR, ncRNA Sites/kb: frequency of target sites in different regions of genes.
Figure 8.

Frequency and degree of gene regulation by transfection of mimics and inhibitors of (A) RMRP-S1 and (B) RMRP-S2. Degree of regulation versus a negative control is plotted as the cumulative fold change [Log 2 (mimic regulation minus inhibitor regulation)]. Only significantly up- or down-regulated genes are plotted on the bar graph leaving a blank central area for unregulated genes.
Genes regulated by RMRP-S1 and RMRP-S2 are linked to CHH-associated pathways
We used Ingenuity Pathway Analysis (IPA) to identify enriched categories of genes that were responsive to RMRP-S1 and -S2 from the HEK293 transfections (Table 2). In both cases, highly enriched categories that related to CHH disease phenotypes were identified. RMRP-S2-regulated genes were abundant in categories including skeletal and muscular disorders, hematological system development and cancer, all of which are associated with CHH phenotypes (Table 2). A similar result was obtained for the RMRP-S1-regulated genes, which were enriched in connective tissue and osteoblast development and maturation that are directly linked to the dwarfism phenotype of CHH. Graphs of the most down-regulated genes for RMRP-S2 and -S1 revealed multiple genes in the enriched categories. Genes associated with hematopoiesis (red bars), splicing control (green bars), growth and proliferation (yellow bars), and bone growth and development (orange + yellow, and orange + red bars) were identified in the most highly down-regulated genes (Fig. 9A and B).
Table 2.
IPA analysis identified enriched categories of genes regulated by S1 and S2 correlate well with CHH phenotypes
| Enriched category | P value | # molecules | |
|---|---|---|---|
| RMRP-S1 | Cell death | 0.000018 | 9 |
| Embryonic development | 0.00042 | 3 | |
| Tissue development | 0.00042 | 4 | |
| Connective tissue development and function | 0.0015 | 6 | |
| Maturation of osteoblasts | 0.0058 | 1 | |
| Development of limb bud | 0.0087 | 1 | |
| Development of osteoblasts | 0.025 | 1 | |
| RMRP-S2 | Neurological disease | 0.000034 | 96 |
| Cell cycle | 0.00025 | 46 | |
| Skeletal and muscular disorders | 0.00034 | 97 | |
| Cancer | 0.00077 | 78 | |
| Hematological disease | 0.00079 | 6 | |
| Hematological system development and function | 0.0018 | 6 | |
| Hematopoiesis | 0.0019 | 4 |
Enriched category: functional linkage category of genes; # molecules: number of different genes in the category.
Figure 9.

Bar graphs depicting the most highly down-regulated genes by RMRP-S1 (A) and RMRP-S2 (B). Colored bars denote genes in enriched categories according to IPA. Red bars: hematopoietic genes; green bars: splicing genes; yellow bars: growth and proliferation genes; orange bars: bone growth and development genes. Blue bars: varied functional categories including transcription factors, tumor suppressors and other structural and regulatory genes. Yellow/orange striped bar: bone growth and proliferation. Orange and red striped bar: bone growth and hematopoietic gene.
Two key down-regulated genes related to the CHH bone growth phenotype were PTCH2 and SOX 4. Together these genes function to promote the correct balance between chondrocyte growth and bone mineralization by osteoblasts (46–48). We transfected HEK293 cells with inhibitors or mimics of RMRP-S1 and -S2 to independently confirm their regulation. QRT-PCR assays revealed a significant rise of both PTCH2 and SOX4 RNA after transfection of RMRP-S1 and -S2 inhibitors, compared with mock-transfected cells (Fig. 10A). Furthermore, western blots revealed decreased protein levels following RMRP-S1 and -S2 mimic treatment (Fig. 10B).
Figure 10.

Regulation of PTCH2 and SOX4 by transfection of RMRP mimics or inhibitors. (A) Increase in PTCH2 RNA after transfection of either RMRP-S1 or RMRP-S2 inhibitors in HEK293 cells determined by Syber green qRT-PCR. (B) Increase in SOX4 levels determined by Syber green qRT-PCR. Fold difference = 2(−ddCt) + _SEM. (n = 9 for each determination). (C) Western blot detection of regulation of PTCH2 and SOX4 protein after treatment of HEK293 with mimics (Mimic) or inhibitors (Inh) of RMRP-S1 or RMRP-S2.
Previous work has shown that RMRP may play a role in the regulation of cell proliferation (49, 50), and it is possible that this may contribute to the increased incidence of cancer in CHH patients. Interestingly, both RMRP-S1 and -S2 regulate genes that are important in the control of cellular proliferation and play a role in tumor formation (Fig. 9A and B). Finally, several components of the U11/U12 splicesome including snoRNAs, RNU12, RNU11, RNU5B-1, RNU5D-1, RNU5F-1, RNU4ATAC and the RNA-processing factor, PRPF40A, were down-regulated by RMRP-S1 and -S2 (Fig. 9A and B, green bars).
DISCUSSION
Roles for lncRNAs in gene regulation and human disease are largely unknown. Increasing evidence is revealing that lncRNAs can serve as the source for miRNAs that have potent gene regulatory activity (38). In addition, roles for RNA-binding proteins in the biogenesis of small regulatory RNAs from lncRNAs are emerging (39). In one recent example, the important RNA-binding protein, HuR, was found to regulate the biogenesis of miR-675 from the lncRNA H19 (39). In that case, the H19 RNA serves as a ‘reservoir’ for the generation of miR-675 from only a small portion of the total H19 RNA. Our data suggest that a similar mechanism may be true for the nuclear localized RMRP RNA, in which only a small portion is used as a source of silondRNAs, RMRP-S1 and -S2.
This report, and a large body of earlier work (25–35), describes five classes of RMRP/protein complexes in cells. The first class is the most abundant and is localized in the nucleus and nucleolus, (30). It includes full-length RMRP in a large protein complex with endonuclease activity, and it functions to process 5.8 to 5S rRNA (33, 34). A second class of RMRP/protein complexes exists in mitochondria and has an endoribonuclease activity that generates the RNA primer for leading strand synthesis of mitochondrial DNA (25,31,32). This report describes a third class of RMRP/protein complexes that are involved in gene silencing in the cytoplasm. Regulation of levels of mRNA transcripts of a limited set of genes has been reported previously (3, 50). RMRP-S1 and -S2 represent only a small fraction of the total RMRP in the cell and have been detected in AgoRNPs by at least two methods, including CLIP and PAR-CLIP (37, 51) and our modified method of RISC isolation based on the protocol of Landthaller (52).
The fourth classes of RMRP/protein complexes recently reported are RMRP/TERT complexes located primarily in the nucleus (35). This class of RMRP is necessarily limited to cells in which TERT is expressed and was demonstrated to occur in malignantly transformed cell lines. In these cells, TERT uses the 3′ end of RMRP as a loop primer for an RdRP activity that reverse-transcribes 268-nt RMRP to produce a 534-nt RNA that forms a double-stranded RNA that can be cleaved by Dicer and incorporated into RISC. In tumor cells, a single antisense RMRP fragment produced by TERT/RMRP RdRP activity had siRNA activity against full-length nuclear RMRP (35). However, abundant antisense RMRP transcripts have not been detected by us, nor are they prominent in other published small RNA deep-sequencing databases (36). Therefore, the significance of this activity in somatic cells and stem cells remains to be determined. Another report has recently identified a fifth type of RMRP RNA, as two antisense circular RMRP RNAs in HEK293 cells (53). Functions of these RNAs, along with those in the fourth class, have not been linked to gene regulation that relates to CHH phenotypes.
The ability of RMRP to adopt an alternative conformation is of particular interest in the context of the data presented in this manuscript. Indeed, RMRP-S1 is processed from the 5′ end of the P2 and Alt-P2 helices (Fig. 4B). In addition, RMRP-S2 is processed from nucleotides near the P12 helix that are nested between the P2 and P4 pseudoknots. The most common CHH-associated mutation is 70A>G, and it may disrupt the P4 helix of the P2–P4 pseudoknot. How such structural change may alter the relative processing of RMRP-S1 and -S2 is unknown. However, in two fibroblast cell lines with the 70A>G mutation, the levels of both RMRP-S1 and -S2 are significantly reduced compared with the NHDF. These data support the expectation that the alteration of the structural conformation of RMRP may be a factor in disease etiology for CHH.
In this report, we use a transfection approach with mimics and inhibitors of RMRP-S1 and -S2 to investigate their capacity for gene regulation (Table 2 and Supplementary Tables S1 and S2, Fig. 9). These studies revealed a surprisingly large, disease relevant set of RMRP-S1- and -S2-regulated genes. PTCH2 was the second most highly down-regulated gene in the RMRP-S2 response dataset, and this gene is part of the regulatory network that controls Indian Hedgehog (IHH) signaling (46). IHH signaling is tightly regulated to obtain the correct balance between chondrocyte growth and bone mineralization by osteoblasts (46). Roles for PTCH2 that are related to CHH have been elucidated in tissue specific knockout mice (54–58). For example, PTCH2 KO in the skin causes deformation of hair follicles and its KO in bone marrow causes defects in hematopoiesis. PTCH2 KO in the brain also causes neuronal defects, and all of these phenotypes have been associated with CHH (59).
Two additional significantly down-regulated genes with S2 targets in their 3′UTRs were SOX4 and BMPR2. They also play important roles in the regulation of bone formation (47, 48). The stem cell differentiation gene SOX4 regulates the differentiation of mesenchymal stem cells (MSC) to osteocytes and BMPR2 controls BMP signaling that plays a role in osteoblast growth (23). Precise levels of these key proteins are needed to obtain the correct balance of osteoblast growth, differentiation, apoptosis and mineralization of cartilage, to insure proper bone growth (19–21, 23). Therefore, our discovery of regulation of these three important genes provides a possible direct link between RMRP-S2 production and control of bone growth, which is arguably the major phenotype in CHH (1, 5, 15).
Our hypothesis is that RMRP-S1 and -S2 function as rheostats that regulate gene expression dependent upon their level in RISC and the level of the target mRNAs. We envision that they require a certain threshold level to effectively regulate their targets, as recently reported for miRNAs (60). Our hypothesis anticipates that mutations in RMRP may alter the secondary structure of RMRP and the subsequent biogenesis of RMRP-S1 and -S2. Both RMRP-S1 and -S2 are located in segments of RMRP that harbor disease-causing mutations (Fig. 4). RMRP-S2 contains 3 nt which, when mutated, cause a form of CHH (Fig. 4). Several disease-causing point mutations also occur in the first 20 nt at the 5′ end of RMRP where RMRP-S1 originates. In addition, mutations in the RMRP promoter that cause deletions and duplications are associated with severe forms of CHH (15) and would also be expected to alter the start site that would change the ‘seed’ site and drastically alter gene-silencing specificity of RMRP-S1 (Fig. 4).
Furthermore, our quantitative analysis of RMRP-S1 and -S2 levels in an immortalized B-cell line with a 146G>C mutation in RMRP-S2 revealed a 80% reduction in RMRP-S1 and a 60% reduction in RMRP-S2 (Fig. 7B). We also show that two fibroblast cell lines that contain a homozygous 70A>G founder mutation have 60–70% reduction in steady state levels of RMRP-S1 and -S2, respectively (Fig. 7A). As the 70A>G mutation is not located in either RMRP-S1 or -S2, the data suggest that alterations in secondary structure caused by the mutation may affect the biogenesis of the two silondRNAs. Knowing the importance of thresholds in determining the effectiveness of miRNAs in RISC (60), the functional consequences of the reductions in RMRP-S1 and -S2 must be determined by further investigations in appropriate stem and differentiated somatic cells associated with CHH phenotypes.
Additionally, RMRP-S2 was found to regulate five ncRNA components of the U12 spliceosomal complex (Fig. 9), which recognizes altered splice donor and acceptor site consensus sequences (61), contained within ∼700 genes (45,62). RMRP-S2 also down-regulated the pre-mRNA-processing factor PRPF40A, which is involved in recruiting U12 to splice sites. Furthermore, mutations in one of the RMRP-S2-regulated components of U12, the small nuclear RNA (snRNA) U4atac, cause microcephalic osteodysplastic primordial dwarfism and Taybi–Linder syndrome (63–65) by inhibiting U12-mediated splicing (63, 64). The phenotypes of these two diseases closely mirror those of CHH. RMRP-S2 also regulated several other lncRNAs, including DLEU2, the host transcript for mirs-15-1 and -16-1 (66). This cluster of miRNAs controls B-cell proliferation, and its deletion leads to chronic lymphocytic leukemia (67), of which CHH patients have a highly increased incidence.
Overall, the above-mentioned data suggest a widespread network of disease-associated genes regulated by the RMRP silondRNAs, RMRP-S1 and -S2. The wider significance of this work supports the existence of extensive networks of small RNAs derived from lncRNAs. The influence of these networks is likely to extend to all aspects of organismic development. Furthermore, knowledge of alterations in the small RNAs is, as in the case of RMRP mentioned earlier, likely to shed light on mechanisms of many human diseases for which the molecular basis is currently unknown.
MATERIALS AND METHODS
Tissues
Cirrhotic liver tissues were obtained from explants of anonymous patients at the time of liver transplant. Normal liver was obtained from a liver resection from liver with small metastatic colon cancer. All tissues were obtained according to an Einstein IRB-approved protocol, and these tissues have been designated ‘exempt’ by the review board.
Growth of cells and cell lines
Human MSPC were obtained and were grown in alpha MEM (Life Technologies, Inc., Grand Island, NY, USA) with 10% Fetal bovine serum, 1× non-essential amino acids and 1× penicillin/streptomycin solution. Primary normal human fibroblasts and primary human chondrocytes were obtained from Promocell, Inc., Heidelberg, Germany, and were propagated using complete fibroblast media or complete chondrocyte media, respectively, according to the supplier’s protocol. H1Es cells, iPS cell lines and hepatocytes were provided by the Stem cell Cores at Albert Einstein College of Medicine.
CHH cell lines
Dermal fibroblast cell lines GM03626 and GM01617 were established from skin biopsies of patients with a typical CHH phenotype and a homozygous 70A>G mutation, upon parental informed consent using an IRB-approved protocol (7). Fibroblasts were maintained in Dulbecco's modified Eagle medium (high glucose and l-glutamine) containing 10% FBS, 1 mM/l l-glutamine and penicillin/streptomycin and cultured at 37°C, 5% CO2.
The lymphoblastoid cell line GM08660 was originated by Epstein–Barr virus (EBV) immortalization of peripheral blood lymphocytes obtained from a patient with CHH (7), upon parental informed consent using an IRB-approved protocol. EBV-transformed cells were maintained in RPMI 1640 supplemented with 10% fetal bovine serum, 2 mM/l l-glutamine and 50 µg/ml gentamycin and cultured at 37°C, 5% CO2.
Human CD34+ cells were isolated from peripheral using StemSep magnetic beads as recommended by the manufacturer (Stem Cells Technologies, Vancouver, WA, USA). FACS and average 95% verified enrichment. JY cells were grown in RPMI 1640 supplemented with 10% fetal bovine serum and 2 mM/l l-glutamine and 1× Penicillin/streptomycin (Life Technologies, Inc.).
RNA isolation
Total RNAs were prepared using TRIzol with the following modifications. Sodium acetate to a final concentration of 0.12 m and 1/5 volume of Chloroform/isoamyl alcohol was added to the initial TRIzol lysate. Precipitation of small RNAs was enhanced using 3 volumes of 100% ethanol overnight at −20°C. RNA pellets were air-dried and resuspended in nuclease-free water.
Northern blots
Forty micrograms of total RNA, fractionated by electrophoresis through 12% urea acrylamide gels and transferred to Hybond membrane by electroblotting at 30 for 1 h. Membranes were prehybridized in 0.75 m NaCl, 0.05 m NaHPO4, 7% SDS, 1× Denhardt's solution and 100 ng/ml sonicated salmon sperm DNA and were hybridized in the same buffer with 5′ 32P-end labeled oligonucleotides for ∼18 h at 50°C. Blots were washed to a final stringency of 100 mm NaCl, 50 mm NaHPO4 and 1% SDS at 50°C. Hybridization was detected using a FujiFilm FLA-5100 imaging system.
Taqman assays
TaqMan stem-loop primers, reverse primers and assays for RMRP-S1 and -S2 were designed and synthesized by Applied Biosystems. These assays specifically detect the short RNAs derived from RMRP and not full-length RMRP transcript. The sequences used to design these assays are as follows: RMRP-S1, 5′-GGUUCGUGCUGAAGGCCUGUAU-3′ and RMRP-S2, 5′-CAAAGUCCGCCAAGAAGCGUAU-3′. For specific reverse transcription of the short RNAs, 10 ng of total RNA was used. Quantitative PCR was carried out using TaqMan Master mix II without UNG as per the manufacturer’s suggested protocol on an ABI 7500 fast QPCR cycler.
S1 Nuclease protection
S1 nuclease protection was performed using the method of Berk and Sharp (68). The input probe for RMRP-S1 was 5′-ATACAGGCCTTCAGCACGAACCACGTCCTCA-3′. The input probe for RMRP-S2 was 5′-ATACGCTTCTTGGCGGACTTTGGAGTGGGAA-3′. Oligonucleotide probes were end labeled with γ32P-ATP (Perkin Elmer). Following S1 digestion, the samples were precipitated using 3 volumes of 100% ethanol. Pellets were dissolved in RNA loading buffer and run on a 15% denaturing PAGE. Labeled fragments were detected using a FujiFilm FLA-5100 imaging system.
Transfection experiments
We transfected HEK293 cells with mimics or inhibitors of RMRP-S1 or RMRP-S2, and, after twenty-four hours, total RNA was prepared. The quality was analyzed using the Agilent Bioanalyzer 2000. Knockdown or increase of the miRNA was confirmed by qPCR. Gene expression levels for each transfection were assayed using Affymetrix Human Gene 1.0 ST arrays.
Analysis of microarray data was performed using the limma package (69) of R/Bioconductor (70, 71). Significantly regulated genes were defined as those with an adjusted p-value of <0.05 according to the linear model, contrasting expression in mimic versus inhibitor transfections. Gene identifiers were obtained using biomaRt (72). Seed sites were identified using a methodology previously reported as offering the optimal balance between sensitivity and specificity, defined as ungapped homology of at least 6 nt from positions 1–8 of the miRNA (73). Gene ontology analysis was conducted using Ingenuity Pathway Analysis (IPA; Ingenuity Systems, www.ingenuity.com). Raw microarray data are available on GEO (74).
Bioinformatics methods
Results from publicly available small RNA-sequencing experiments were downloaded from the SRA (accessions: SRX342470-73), and from the ENCODE project (small RNA-seq from CSHL and CAGE from RIKEN) via the UCSC Genome Browser (36). When necessary, reads were mapped to the human genome, revision hg19, using Bowtie (75).
Shape analysis
The RMRP 268-nt sequence was inserted between the Sgfl and Mlul sites of the PCMV6-AC non-tagged precision shuttle vector (Origene) including 5′ and 3′ hairpin loops and a 5′ T7 promoter (TAATACGACTCACTATAGG). The plasmid was transformed into Escherichia coli competent cells and amplified using PCR. The PCR product was transcribed into RNA using MegaScript and MegaClear following Ambion's protocol. SHAPE experiments were carried out as described previously using an identical annealing protocol, i.e. heat to 95°C for 2 min followed by 2 min on ice. The data were analyzed using a combination of the CAFA and Shapefinder software as previously described (76, 77). The structure was precited using the ShapeKnots software (78) and visualized using VARNA (79).
Western blots
Protein isolation and western blots were performed according to the method of Wang et al. (80). Expression of PTCH2 and SOX4 protein was detected using antibodies, sc-9672 and sc-17326, respectively (Santa Cruz Biotechnologies, Inc., Santa Cruz, CA, USA) at a 1:200 dilution. Donkey anti-goat antibody labeled with HRP (sc-2020) was used as a secondary antibody at a dilution of 1:2000. Antibodies were visualized using Amersham ECL prime western blotting detection reagent followed by imaging using a FluroChem Q CCD imaging system. Images were adjusted for brightness and contrast, and image reversal was performed using PhotoShop CS.
SUPPLEMENTARY MATERIAL
FUNDING
This work was supported by NYSTEM FAU#0804180400 (to C.E.R.) and NYSTEM CO28172 (to L.E.R.) and by NIH grants RO1 CA 37232-28 (to C.E.R.), P30 DK41296-21, 1U24AI086037-01, R01AI100887-01 (to L.D.N.) and R01GM101237 (to A.L.) and from the Manton Foundation (to L.D.N.)
Supplementary Material
ACKNOWLEDGEMENTS
We thank Lauren Davis-Neulander and Justin Ritz for their help collecting the SHAPE data and generating Figure 4A.
Conflict of Interest statement. None declared.
REFERENCES
- 1.Ridanpaa M., van Eenennaam H., Pelin K., Chadwick R., Johnson C., Yuan B., van Venrooij W., Pruijn G., Salmela R., Rockas S., et al. Mutations in the RNA component of RNase MRP cause a pleiotropic human disease, cartilage-hair hypoplasia. Cell. 2001;104:195–203. doi: 10.1016/s0092-8674(01)00205-7. [DOI] [PubMed] [Google Scholar]
- 2.Ridanpaa M., Jain P., McKusick V.A., Francomano C.A., Kaitila I. The major mutation in the RMRP gene causing CHH among the Amish is the same as that found in most Finnish cases. Am. J. Med. Genet. 2003;121C:81–83. doi: 10.1002/ajmg.c.20006. [DOI] [PubMed] [Google Scholar]
- 3.Hermanns P., Tran A., Munivez E., Carter S., Zabel B., Lee B., Leroy J.G. RMRP Mutations in cartilage-hair hypoplasia. Am. J. Med. Genet. 2006;140:2121–2130. doi: 10.1002/ajmg.a.31331. [DOI] [PubMed] [Google Scholar]
- 4.Thiel C.T., Mortier G., Kaitila I., Reis A., Rauch A. Type and level of RMRP functional impairment predicts phenotype in the cartilage hair hypoplasia-anauxetic dysplasia spectrum. Am. J. Hum. Genet. 2007;81:519–529. doi: 10.1086/521034. [DOI] [PMC free article] [PubMed] [Google Scholar]
- 5.McKusick V.A., Eldridge R., Hostetler J.A., Ruangwit U., Egeland J.A. Dwarfism in the Amish. Ii. Cartilage-Hair Hypoplasia. Bull. Johns Hopkins Hosp. 1965;116:285–326. [PubMed] [Google Scholar]
- 6.Makitie O., Kaitila I. Cartilage-hair hypoplasia—clinical manifestations in 108 Finnish patients. Eur. J. Pediatr. 1993;152:211–217. doi: 10.1007/BF01956147. [DOI] [PubMed] [Google Scholar]
- 7.Kavadas F.D., Giliani S., Gu Y., Mazzolari E., Bates A., Pegoiani E., Roifman C.M., Notarangelo L.D. Variability of clinical and laboratory features among patients with ribonuclease mitochondrial RNA processing endoribonuclease gene mutations. J. Allergy Clin. Immunol. 2008;122:1178–1184. doi: 10.1016/j.jaci.2008.07.036. [DOI] [PubMed] [Google Scholar]
- 8.Castigli E., Irani A.M., Geha R.S., Chatila T. Defective expression of early activation genes in cartilage-hair hypoplasia (CHH) with severe combined immunodeficiency (SCID) Clin. Exp. Immunol. 1995;102:6–10. doi: 10.1111/j.1365-2249.1995.tb06628.x. [DOI] [PMC free article] [PubMed] [Google Scholar]
- 9.Makitie O., Juvonen E., Dunkel L., Kaitila I., Siimes M.A. Anemia in children with cartilage-hair hypoplasia is related to body growth and to the insulin-like growth factor system. J. Clin. Endo. Met. 2000;85:563–568. doi: 10.1210/jcem.85.2.6339. [DOI] [PubMed] [Google Scholar]
- 10.van der Burgt I., Haraldsson A., Oosterwijk J.C., van Essen A.J., Weemaes C., Hamel B. Cartilage hair hypoplasia, metaphyseal chondrodysplasia type McKusick: description of seven patients and review of the literature. Am. J. Med. Genet. 1991;41:371–380. doi: 10.1002/ajmg.1320410320. [DOI] [PubMed] [Google Scholar]
- 11.Thiel C.T., Horn D., Zabel B., Ekici A.B., Salinas K., Gebhart E., Ruschendorf F., Sticht H., Spranger J., Muller D., et al. Severely incapacitating mutations in patients with extreme short stature identify RNA-processing endoribonuclease RMRP as an essential cell growth regulator. Am. J. Hum. Genet. 2005;77:795–806. doi: 10.1086/497708. [DOI] [PMC free article] [PubMed] [Google Scholar]
- 12.Makitie O., Pukkala E., Teppo L., Kaitila I. Increased incidence of cancer in patients with cartilage-hair hypoplasia. J. Pediatr. 1999;134:315–318. doi: 10.1016/s0022-3476(99)70456-7. [DOI] [PubMed] [Google Scholar]
- 13.Sulisalo T., Sistonen P., Hastbacka J., Wadelius C., Makitie O., de la Chapelle A., Kaitila I. Cartilage-hair hypoplasia gene assigned to chromosome 9 by linkage analysis. Nat. Genet. 1993;3:338–341. doi: 10.1038/ng0493-338. [DOI] [PubMed] [Google Scholar]
- 14.Sulisalo T., Klockars J., Makitie O., Francomano C.A., de la Chapelle A., Kaitila I., Sistonen P. High-resolution linkage-disequilibrium mapping of the cartilage-hair hypoplasia gene. Am. J. Hum. Genet. 1994;55:937–945. [PMC free article] [PubMed] [Google Scholar]
- 15.Thiel C.T., Rauch A. The molecular basis of the cartilage-hair hypoplasia–anauxetic dysplasia spectrum. Best Pract. Res. Clin. Endo. Met. 2011;25:131–142. doi: 10.1016/j.beem.2010.08.004. [DOI] [PubMed] [Google Scholar]
- 16.Bonafe L., Schmitt K., Eich G., Giedion A., Superti-Furga A. RMRP gene sequence analysis confirms a cartilage-hair hypoplasia variant with only skeletal manifestations and reveals a high density of single-nucleotide polymorphisms. Clin. Genet. 2002;61:146–151. doi: 10.1034/j.1399-0004.2002.610210.x. [DOI] [PubMed] [Google Scholar]
- 17.Vatanavicharn N., Visitsunthorn N., Pho-iam T., Jirapongsananuruk O., Pacharn P., Chokephaibulkit K., Limwongse C., Wasant P. An infant with cartilage-hair hypoplasia due to a novel homozygous mutation in the promoter region of the RMRP gene associated with chondrodysplasia and severe immunodeficiency. J. Appl. Genet. 2010;51:523–528. doi: 10.1007/BF03208884. [DOI] [PubMed] [Google Scholar]
- 18.Rosenbluh J., Nijhawan D., Chen Z., Wong K.K., Masutomi K., Hahn W.C. RMRP is a non-coding RNA essential for early murine development. PLoS One. 2011;6:e26270. doi: 10.1371/journal.pone.0026270. [DOI] [PMC free article] [PubMed] [Google Scholar]
- 19.Majumdar M.K., Banks V., Peluso D.P., Morris E.A. Isolation, characterization, and chondrogenic potential of human bone marrow-derived multipotential stromal cells. J. Cell. Phys. 2000;185:98–106. doi: 10.1002/1097-4652(200010)185:1<98::AID-JCP9>3.0.CO;2-1. [DOI] [PubMed] [Google Scholar]
- 20.Oldershaw R.A., Baxter M.A., Lowe E.T., Bates N., Grady L.M., Soncin F., Brison D.R., Hardingham T.E., Kimber S.J. Directed differentiation of human embryonic stem cells toward chondrocytes. Nat. Biotech. 2010;28:1187–1194. doi: 10.1038/nbt.1683. [DOI] [PubMed] [Google Scholar]
- 21.Sottile V., Thomson A., McWhir J. In vitro osteogenic differentiation of human ES cells. Clon. Stem Cells. 2003;5:149–155. doi: 10.1089/153623003322234759. [DOI] [PubMed] [Google Scholar]
- 22.Frenette P.S., Pinho S., Lucas D., Scheiermann C. Mesenchymal stem cell: keystone of the hematopoietic stem cell niche and a stepping-stone for regenerative medicine. Ann. Rev. Immunol. 2013;31:285–316. doi: 10.1146/annurev-immunol-032712-095919. [DOI] [PubMed] [Google Scholar]
- 23.Pittenger M.F., Mackay A.M., Beck S.C., Jaiswal R.K., Douglas R., Mosca J.D., Moorman M.A., Simonetti D.W., Craig S., Marshak D.R. Multilineage potential of adult human mesenchymal stem cells. Science. 1999;284:143–147. doi: 10.1126/science.284.5411.143. [DOI] [PubMed] [Google Scholar]
- 24.de la Fuente M.A., Recher M., Rider N.L., Strauss K.A., Morton D.H., Adair M., Bonilla F.A., Ochs H.D., Gelfand E.W., Pessach I.M., et al. Reduced thymic output, cell cycle abnormalities, and increased apoptosis of T lymphocytes in patients with cartilage-hair hypoplasia. J. Allergy Clin. Immunol. 2011;28:139–146. doi: 10.1016/j.jaci.2011.03.042. [DOI] [PMC free article] [PubMed] [Google Scholar]
- 25.Chang D.D., Clayton D.A. Mouse RNAase MRP RNA is encoded by a nuclear gene and contains a decamer sequence complementary to a conserved region of mitochondrial RNA substrate. Cell. 1989;56:131–139. doi: 10.1016/0092-8674(89)90991-4. [DOI] [PubMed] [Google Scholar]
- 26.Topper J.N., Clayton D.A. Characterization of human MRP/Th RNA and its nuclear gene: full length MRP/Th RNA is an active endoribonuclease when assembled as an RNP. Nucl. Acids Res. 1990;18:793–799. doi: 10.1093/nar/18.4.793. [DOI] [PMC free article] [PubMed] [Google Scholar]
- 27.Welting T.J., van Venrooij W.J., Pruijn G.J. Mutual interactions between subunits of the human RNase MRP ribonucleoprotein complex. Nucl. Acids Res. 2004;32:2138–2146. doi: 10.1093/nar/gkh539. [DOI] [PMC free article] [PubMed] [Google Scholar]
- 28.Welting T.J., Mattijssen S., Peters F.M., van Doorn N.L., Dekkers L., van Venrooij W.J., Heus H.A., Bonafe L., Pruijn G.J. Cartilage–hair hypoplasia-associated mutations in the RNase MRP P3 domain affect RNA folding and ribonucleoprotein assembly. Biochim. Biophys. Act. 2008;1783:455–466. doi: 10.1016/j.bbamcr.2007.11.016. [DOI] [PubMed] [Google Scholar]
- 29.Martin A.N., Li Y. RNase MRP RNA and human genetic diseases. Cell. Res. 2007;17:219–226. doi: 10.1038/sj.cr.7310120. [DOI] [PubMed] [Google Scholar]
- 30.Li K., Smagula C.S., Parsons W.J., Richardson J.A., Gonzalez M., Hagler H.K., Williams R.S. Subcellular partitioning of MRP RNA assessed by ultrastructural and biochemical analysis. J. Cell Bio. 1994;124:871–882. doi: 10.1083/jcb.124.6.871. [DOI] [PMC free article] [PubMed] [Google Scholar]
- 31.Chang D.D., Clayton D.A. A mammalian mitochondrial RNA processing activity contains nucleus-encoded RNA. Science. 1987;235:1178–1184. doi: 10.1126/science.2434997. [DOI] [PubMed] [Google Scholar]
- 32.Chang D.D., Clayton D.A. A novel endoribonuclease cleaves at a priming site of mouse mitochondrial DNA replication. EMBO J. 1987;6:409–417. doi: 10.1002/j.1460-2075.1987.tb04770.x. [DOI] [PMC free article] [PubMed] [Google Scholar]
- 33.Chu S., Archer R.H., Zengel J.M., Lindahl L. The RNA of RNase MRP is required for normal processing of ribosomal RNA. Proc. Natl. Acad. Sci. U.S.A. 1994;91:659–663. doi: 10.1073/pnas.91.2.659. [DOI] [PMC free article] [PubMed] [Google Scholar]
- 34.Schmitt M.E., Clayton D.A. Nuclear RNase MRP is required for correct processing of pre-5.8S rRNA in Saccharomyces cerevisiae. Mol. Cell. Bio. 1993;13:7935–7941. doi: 10.1128/mcb.13.12.7935. [DOI] [PMC free article] [PubMed] [Google Scholar]
- 35.Maida Y., Yasukawa M., Furuuchi M., Lassmann T., Possemato R., Okamoto N., Kasim V., Hayashizaki Y., Hahn W.C., Masutomi K. An RNA-dependent RNA polymerase formed by TERT and the RMRP RNA. Nature. 2009;461:230–235. doi: 10.1038/nature08283. [DOI] [PMC free article] [PubMed] [Google Scholar]
- 36.Djebali S., Davis C.A., Merkel A., Dobin A., Lassmann T., Mortazavi A., Tanzer A., Lagarde J., Lin W., Schlesinger F., et al. Landscape of transcription in human cells. Nature. 2012;489:101–108. doi: 10.1038/nature11233. [DOI] [PMC free article] [PubMed] [Google Scholar]
- 37.Hafner M., Landthaler M., Burger L., Khorshid M., Hausser J., Berninger P., Rothballer A., Ascano M., Jungkamp A.C., Munschauer M., et al. Transcriptome-wide identification of RNA-binding protein and microRNA target sites by PAR-CLIP. Cell. 2010;141:129–141. doi: 10.1016/j.cell.2010.03.009. [DOI] [PMC free article] [PubMed] [Google Scholar]
- 38.Rother S., Meister G. Small RNAs derived from longer non-coding RNAs. Biochimie. 2011;93:1905–1915. doi: 10.1016/j.biochi.2011.07.032. [DOI] [PubMed] [Google Scholar]
- 39.Keniry A., Oxley D., Monnier P., Kyba M., Dandolo L., Smits G., Reik W. The H19 lincRNA is a developmental reservoir of miR-675 that suppresses growth and Igf1r. Nat. Cell Biol. 2012;14:659–665. doi: 10.1038/ncb2521. [DOI] [PMC free article] [PubMed] [Google Scholar]
- 40.Auyeung V.C., Ulitsky I., McGeary S.E., Bartel D.P. Beyond secondary structure: primary-sequence determinants license pri-miRNA hairpins for processing. Cell. 2013;152:844–858. doi: 10.1016/j.cell.2013.01.031. [DOI] [PMC free article] [PubMed] [Google Scholar]
- 41.Lai D., Proctor J.R., Zhu J.Y., Meyer I.M. R-CHIE: a web server and R package for visualizing RNA secondary structures. Nucl. Acids Res. 2012;40:e95. doi: 10.1093/nar/gks241. [DOI] [PMC free article] [PubMed] [Google Scholar]
- 42.Deigan K.E., Li T.W., Mathews D.H., Weeks K.M. Accurate SHAPE-directed RNA structure determination. Proc. Natl. Acad. Sci. U.S.A. 2009;106:97–102. doi: 10.1073/pnas.0806929106. [DOI] [PMC free article] [PubMed] [Google Scholar]
- 43.Martin J.S., Halvorsen M., Davis-Neulander L., Ritz J., Gopinath C., Beauregard A., Laederach A. Structural effects of linkage disequilibrium on the transcriptome. RNA. 2012;18:77–87. doi: 10.1261/rna.029900.111. [DOI] [PMC free article] [PubMed] [Google Scholar]
- 44.Bu Y., Lu C., Bian C., Wang J., Li J., Zhang B., Li Z., Brewer G., Zhao R.C. Knockdown of Dicer in MCF-7 human breast carcinoma cells results in G1 arrest and increased sensitivity to cisplatin. Oncol. Rep. 2009;21:13–17. [PubMed] [Google Scholar]
- 45.Alioto T.S. U12DB: a database of orthologous U12-type spliceosomal introns. Nuc. Acids Res. 2007;35:D110–e26115. doi: 10.1093/nar/gkl796. [DOI] [PMC free article] [PubMed] [Google Scholar]
- 46.Juppner H. Role of parathyroid hormone-related peptide and Indian hedgehog in skeletal development. Pediatr. Nephrol. 2000;14:606–611. doi: 10.1007/s004670000343. [DOI] [PubMed] [Google Scholar]
- 47.Penzo-Mendez A.I. Critical roles for SoxC transcription factors in development and cancer. Int. J. Biochem. Cell Bio. 2010;42:425–428. doi: 10.1016/j.biocel.2009.07.018. [DOI] [PMC free article] [PubMed] [Google Scholar]
- 48.Kawakami Y., Ishikawa T., Shimabara M., Tanda N., Enomoto-Iwamoto M., Iwamoto M., Kuwana T., Ueki A., Noji S., Nohno T. BMP signaling during bone pattern determination in the developing limb. Dev. 1996;122:3557–3566. doi: 10.1242/dev.122.11.3557. [DOI] [PubMed] [Google Scholar]
- 49.Gill T., Cai T., Aulds J., Wierzbicki S., Schmitt M.E. RNase MRP cleaves the CLB2 mRNA to promote cell cycle progression: novel method of mRNA degradation. Mol. Cell. Bio. 2004;24:945–953. doi: 10.1128/MCB.24.3.945-953.2004. [DOI] [PMC free article] [PubMed] [Google Scholar]
- 50.Mattijssen S., Hinson E.R., Onnekink C., Hermanns P., Zabel B., Cresswell P., Pruijn G.J. Viperin mRNA is a novel target for the human RNase MRP/RNase P endoribonuclease. C.M.L.S. 2011;68:2469–2480. doi: 10.1007/s00018-010-0568-3. [DOI] [PMC free article] [PubMed] [Google Scholar]
- 51.Chi S.W., Zang J.B., Mele A., Darnell R.B. Argonaute HITS-CLIP decodes microRNA–mRNA interaction maps. Nature. 2009;460:479–486. doi: 10.1038/nature08170. [DOI] [PMC free article] [PubMed] [Google Scholar]
- 52.Landthaler M., Gaidatzis D., Rothballer A., Chen P.Y., Soll S.J., Dinic L., Ojo T., Hafner M., Zavolan M., Tuschl T. Molecular characterization of human Argonaute-containing ribonucleoprotein complexes and their bound target mRNAs. RNA. 2008;14:2580–2596. doi: 10.1261/rna.1351608. [DOI] [PMC free article] [PubMed] [Google Scholar]
- 53.Memczak S., Jens M., Elefsinioti A., Torti F., Krueger J., Rybak A., Maier L., Mackowiak S.D., Gregersen L.H., Munschauer M., et al. Circular RNAs are a large class of animal RNAs with regulatory potency. Nature. 2013;495:333–338. doi: 10.1038/nature11928. [DOI] [PubMed] [Google Scholar]
- 54.Nieuwenhuis E., Motoyama J., Barnfield P.C., Yoshikawa Y., Zhang X., Mo R., Crackower M.A., Hui C.C. Mice with a targeted mutation of patched2 are viable but develop alopecia and epidermal hyperplasia. Mol. Cell. Bio. 2006;26:6609–6622. doi: 10.1128/MCB.00295-06. [DOI] [PMC free article] [PubMed] [Google Scholar]
- 55.Nitzki F., Becker M., Frommhold A., Schulz-Schaeffer W., Hahn H. Patched knockout mouse models of Basal cell carcinoma. J. Skin Cancer. 2012;2012:907543. doi: 10.1155/2012/907543. [DOI] [PMC free article] [PubMed] [Google Scholar]
- 56.Mak K.K., Chen M.H., Day T.F., Chuang P.T., Yang Y. Wnt/beta-catenin signaling interacts differentially with Ihh signaling in controlling endochondral bone and synovial joint formation. Dev. 2006;133:3695–3707. doi: 10.1242/dev.02546. [DOI] [PubMed] [Google Scholar]
- 57.Oro A.E., Higgins K. Hair cycle regulation of Hedgehog signal reception. Dev. Biol. 2003;255:238–248. doi: 10.1016/s0012-1606(02)00042-8. [DOI] [PubMed] [Google Scholar]
- 58.Uhmann A., Dittmann K., Nitzki F., Dressel R., Koleva M., Frommhold A., Zibat A., Binder C., Adham I., Nitsche M., et al. The Hedgehog receptor Patched controls lymphoid lineage commitment. Blood. 2007;110:1814–1823. doi: 10.1182/blood-2007-02-075648. [DOI] [PubMed] [Google Scholar]
- 59.Yang Z.J., Ellis T., Markant S.L., Read T.A., Kessler J.D., Bourboulas M., Schuller U., Machold R., Fishell G., Rowitch D.H., Wainwright B.J., Wechsler-Reya R.J. Medulloblastoma can be initiated by deletion of Patched in lineage-restricted progenitors or stem cells. Cancer Cell. 2008;14:135–145. doi: 10.1016/j.ccr.2008.07.003. [DOI] [PMC free article] [PubMed] [Google Scholar]
- 60.Mukherji S., Ebert M.S., Zheng G.X., Tsang J.S., Sharp P.A., van Oudenaarden A. MicroRNAs can generate thresholds in target gene expression. Nat. Genet. 2011;43:854–859. doi: 10.1038/ng.905. [DOI] [PMC free article] [PubMed] [Google Scholar]
- 61.Tarn W.Y., Steitz J.A. Highly diverged U4 and U6 small nuclear RNAs required for splicing rare AT-AC introns. Science. 1996;273:1824–1832. doi: 10.1126/science.273.5283.1824. [DOI] [PubMed] [Google Scholar]
- 62.Levine A., Durbin R. A computational scan for U12-dependent introns in the human genome sequence. Nucl. Acids Res. 2001;29:4006–4013. doi: 10.1093/nar/29.19.4006. [DOI] [PMC free article] [PubMed] [Google Scholar]
- 63.He H., Liyanarachchi S., Akagi K., Nagy R., Li J., Dietrich R.C., Li W., Sebastian N., Wen B., Xin B., et al. Mutations in U4atac snRNA, a component of the minor spliceosome, in the developmental disorder MOPD I. Science. 2011;332:238–240. doi: 10.1126/science.1200587. [DOI] [PMC free article] [PubMed] [Google Scholar]
- 64.Edery P., Marcaillou C., Sahbatou M., Labalme A., Chastang J., Touraine R., Tubacher E., Senni F., Bober M.B., Nampoothiri S., et al. Association of TALS developmental disorder with defect in minor splicing component U4atac snRNA. Science. 2011;332:240–243. doi: 10.1126/science.1202205. [DOI] [PubMed] [Google Scholar]
- 65.Abdel-Salam G.M., Miyake N., Eid M.M., Abdel-Hamid M.S., Hassan N.A., Eid O.M., Effat L.K., El-Badry T.H., El-Kamah G.Y., El-Darouti M., et al. A homozygous mutation in RNU4ATAC as a cause of microcephalic osteodysplastic primordial dwarfism type I (MOPD I) with associated pigmentary disorder. Am. J. Med. Genet. Pt. A. 2011;155A:2885–2896. doi: 10.1002/ajmg.a.34299. [DOI] [PubMed] [Google Scholar]
- 66.Lerner M., Harada M., Loven J., Castro J., Davis Z., Oscier D., Henriksson M., Sangfelt O., Grander D., Corcoran M.M. DLEU2, frequently deleted in malignancy, functions as a critical host gene of the cell cycle inhibitory microRNAs miR-15a and miR-16–1. Exp. Cell Res. 2009;315:2941–2952. doi: 10.1016/j.yexcr.2009.07.001. [DOI] [PubMed] [Google Scholar]
- 67.Klein U., Lia M., Crespo M., Siegel R., Shen Q., Mo T., Ambesi-Impiombato A., Califano A., Migliazza A., Bhagat G., et al. The DLEU2/miR-15a/16–1 cluster controls B cell proliferation and its deletion leads to chronic lymphocytic leukemia. Cancer Cell. 2010;17:28–40. doi: 10.1016/j.ccr.2009.11.019. [DOI] [PubMed] [Google Scholar]
- 68.Berk A.J., Sharp P.A. Sizing and mapping of early adenovirus mRNAs by gel electrophoresis of S1 endonuclease-digested hybrids. Cell. 1977;12:721–732. doi: 10.1016/0092-8674(77)90272-0. [DOI] [PubMed] [Google Scholar]
- 69.Smyth G.K., Michaud J., Scott H.S. Use of within-array replicate spots for assessing differential expression in microarray experiments. Bioinformatics. 2005;21:2067–2075. doi: 10.1093/bioinformatics/bti270. [DOI] [PubMed] [Google Scholar]
- 70.Team R.D.C. R Foundation for Statistical Computing. Vienna, Austria: 2011. A language and environment for statistical computing. ISBN 3-900051-07-0, URL http://www.R-project.org/ [Google Scholar]
- 71.Gentleman R.C., Carey V.J., Bates D.M., Bolstad B., Dettling M., Dudoit S., Ellis B., Gautier L., Ge Y., Gentry J., et al. Bioconductor: open software development for computational biology and bioinformatics. Genom. Biol. 2004;5:R80. doi: 10.1186/gb-2004-5-10-r80. [DOI] [PMC free article] [PubMed] [Google Scholar]
- 72.Durinck S., Moreau Y., Kasprzyk A., Davis S., De Moor B., Brazma A., Huber W. Biomart and bioconductor: a powerful link between biological databases and microarray data analysis. Bioinformatics. 2005;21:3439–3440. doi: 10.1093/bioinformatics/bti525. [DOI] [PubMed] [Google Scholar]
- 73.Ellwanger D.C., Buttner F.A., Mewes H.W., Stumpflen V. The sufficient minimal set of miRNA seed types. Bioinformatics. 2011;27:1346–1350. doi: 10.1093/bioinformatics/btr149. [DOI] [PMC free article] [PubMed] [Google Scholar]
- 74.Edgar R., Domrachev M., Lash A.E. Gene expression omnibus: NCBI gene expression and hybridization array data repository. Nucl. Acids Res. 2002;30:207–210. doi: 10.1093/nar/30.1.207. [DOI] [PMC free article] [PubMed] [Google Scholar]
- 75.Langmead B., Trapnell C., Pop M., Salzberg S.L. Ultrafast and memory-efficient alignment of short DNA sequences to the human genome. Genom. Biol. 2009;10:R25. doi: 10.1186/gb-2009-10-3-r25. [DOI] [PMC free article] [PubMed] [Google Scholar]
- 76.Mitra S., Shcherbakova I.V., Altman R.B., Brenowitz M., Laederach A. High-throughput single-nucleotide structural mapping by capillary automated footprinting analysis. Nucl. Acids Res. 2008;36:e63. doi: 10.1093/nar/gkn267. [DOI] [PMC free article] [PubMed] [Google Scholar]
- 77.Vasa S.M., Guex N., Wilkinson K.A., Weeks K.M., Giddings M.C. Shapefinder: a software system for high-throughput quantitative analysis of nucleic acid reactivity information resolved by capillary electrophoresis. RNA. 2008;14:1979–1990. doi: 10.1261/rna.1166808. [DOI] [PMC free article] [PubMed] [Google Scholar]
- 78.Hajdin C.E., Bellaousov S., Huggins W., Leonard C.W., Mathews D.H., Weeks K.M. Accurate SHAPE-directed RNA secondary structure modeling, including pseudoknots. Proc.Natl. Acad. Sci. USA. 2013;110:5498–5503. doi: 10.1073/pnas.1219988110. [DOI] [PMC free article] [PubMed] [Google Scholar]
- 79.Darty K., Denise A., Ponty Y. VARNA: interactive drawing and editing of the RNA secondary structure. Bioinformatics. 2009;25:1974–1975. doi: 10.1093/bioinformatics/btp250. [DOI] [PMC free article] [PubMed] [Google Scholar]
- 80.Wang Y., Singh R., Xiang Y., Czaja M.J. Macroautophagy and chaperone-mediated autophagy are required for hepatocyte resistance to oxidant stress. Hepatol. 2010;52:266–277. doi: 10.1002/hep.23645. [DOI] [PMC free article] [PubMed] [Google Scholar]
Associated Data
This section collects any data citations, data availability statements, or supplementary materials included in this article.