

Abstract
‘Salt & Pepper’ syndrome is an autosomal recessive condition characterized by severe intellectual disability, epilepsy, scoliosis, choreoathetosis, dysmorphic facial features and altered dermal pigmentation. High-density SNP array analysis performed on siblings first described with this syndrome detected four shared regions of loss of heterozygosity (LOH). Whole-exome sequencing narrowed the candidate region to chromosome 2p11.2. Sanger sequencing confirmed a homozygous c.994G>A transition (p.E332K) in the ST3GAL5 gene, which encodes for a sialyltransferase also known as GM3 synthase. A different homozygous mutation of this gene has been previously associated with infantile-onset epilepsy syndromes in two other cohorts. The ST3GAL5 enzyme synthesizes ganglioside GM3, a glycosophingolipid enriched in neural tissue, by adding sialic acid to lactosylceramide. Unlike disorders of glycosphingolipid (GSL) degradation, very little is known regarding the molecular and pathophysiologic consequences of altered GSL biosynthesis. Glycolipid analysis confirmed a complete lack of GM3 ganglioside in patient fibroblasts, while microarray analysis of glycosyltransferase mRNAs detected modestly increased expression of ST3GAL5 and greater changes in transcripts encoding enzymes that lie downstream of ST3GAL5 and in other GSL biosynthetic pathways. Comprehensive glycomic analysis of N-linked, O-linked and GSL glycans revealed collateral alterations in response to loss of complex gangliosides in patient fibroblasts and in zebrafish embryos injected with antisense morpholinos that targeted zebrafish st3gal5 expression. Morphant zebrafish embryos also exhibited increased apoptotic cell death in multiple brain regions, emphasizing the importance of GSL expression in normal neural development and function.
INTRODUCTION
The ‘Salt-and-Pepper’ (S&P) syndrome, an autosomal recessive neurocutaneous condition, was originally described in three siblings, two brothers and one sister, with severe intellectual disability, hyper- and hypo-pigmented skin maculae at various locations, dysmorphic facial features, seizures, scoliosis, choreoathetosis, spasticity and abnormal EKG (1). The severe clinical presentation and the unremarkable family history, except for a nephew with autism spectrum disorder, suggested an autosomal recessive form of inheritance. Routine chromosomal and metabolic tests failed to reveal any abnormalities in the patients and array-CGH (competitive genome hybridization) and FRAXA analyses in a male proband were normal. In order to investigate the genetic cause of this condition, we employed a combined approach, involving genome-wide high-density SNP microarray analysis of two affected siblings and whole-exome sequencing of one of these using two of the three affected individuals. Our goal was to identify coding variants that were shared by the affected siblings and then employ bioinformatic prediction tools in order to identify potentially causative changes. The best candidate, validated by the data presented in this manuscript, predicted a mutation in a glycosphingolipid (GSL) biosynthetic enzyme, ST3GAL5.
The ST3GAL5 enzyme generates a GSL known as GM3 ganglioside (sialyl-lactosylceramide) from lactosylceramide (Fig. 1). In turn, GM3 is a substrate for extension and further branching reactions that produce all of the major complex gangliosides in neural tissue (2). Thus, loss of ST3GAL5 activity would be predicted to significantly impact the production and diversity of brain gangliosides, which, as a class, account for more of the total sialic acid content at neural cell surfaces than do glycoprotein glycans (3). Gangliosides contribute to neural cell functions through their direct interactions with carbohydrate binding proteins and through their propensity to partition into specialized membrane domains that indirectly modulate multiple cell signaling activities (4–6). The direct and indirect functions of gangliosides are essential for normal brain function, consistent with intellectual disability arising as a sequela of disrupted GSL biosynthesis. Additionally, however, we currently lack even the simplest appreciation of how the impact of altered GSL biosynthesis might ripple through the whole glycome of any cell or tissue. Unlike nucleic acid and protein synthesis, glycan production and processing are not template driven. Rather, glycolipid and glycoprotein glycan modifications are subject to substantial epigenetic and environmental regulation (7). Thus, patients with S&P syndrome provide novel opportunities to investigate the GSL functions essential for normal neural cell activity and to decipher the glycomic consequences of altered GSL biosynthesis.
Figure 1.
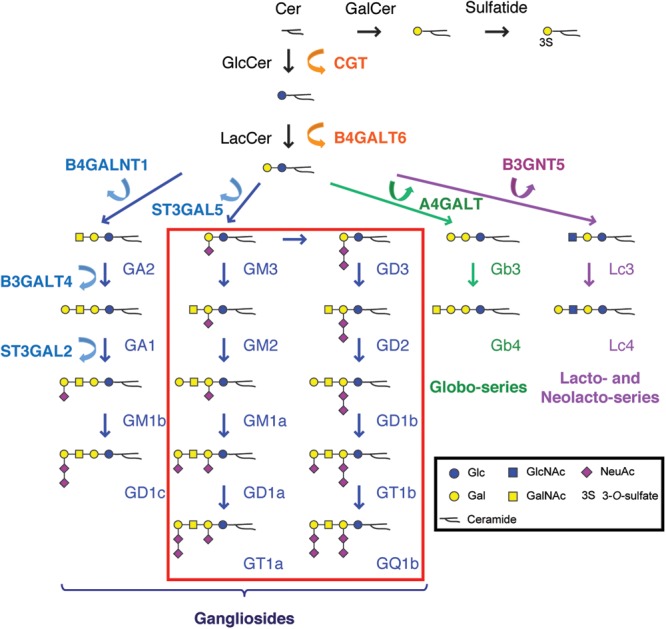
Glycosphingolipid biosynthetic pathways. Mammalian GSL biosynthesis begins with the glycosylation of ceramide that is either galactosylated to form GalCer or glucosylated to form GlcCer. GlcCer is subsequently elongated by the addition of Gal to form LacCer, the substrate for ST3GAL5. Sialylation of LacCer by this enzyme, which is deficient in S&P syndrome, produces the ganglioside GM3, the precursor for formation of all complex gangliosides of the a and b type (boxed in red). S&P syndrome patients lack all of these gangliosides, but are still able to produce the c type gangliosides as well as globo-, lacto- and neolactoseries GSLs. Glycan symbolic representations are consistent with the recommendations of the Glycobiology community as described by Varki, et al. (www.ncbi.nlm.nih.gov/books/NBK1931/figure/ch1.f5/?report=objectonly). CGT, ceramide glucosyltransferase; B4GALT6, β4-galactosyltransferase 6; B4GALNT1, β4-N-acetylgalactaminyltransferase 1; B3GALT4, β3-galactosyltransferase 4; ST3GAL2, α3-sialyltransferase 2; ST3GAL5, α3-sialyltransferase 5 (GM3 synthase); A4-GALT, α4-galactosyltransferase; B3GNT5, β3-N-acetylglucosaminyltransferase 5.
RESULTS
High-density SNP microarray
High-density SNP microarray analysis of the two patients did not identify any regions of copy number variation of clinical significance and all copy number changes detected (>50 Kb) in either patient were present in the Database of Genomic Variants (PMID: 15286789). The overall percentage of homozygous autosomal sequence for III-4 and III-5 (Fig. 2) was both within the normal range (<3.5%) at 2.46 and 2.69% respectively. However, abnormally long stretches of continuous homology (LCSH), exceeding 3 Mb, were noted for each patient (Supplementary Material, Fig. S1). Three regions of LCSH in patient III-4, ∼7.8 Mb of chromosome 2 (79752445-87581115), and two regions on chromosome 6 of ∼11.7 Mb (22406678-34083788) and ∼35.7 Mb (121 072 610–156 786 646), were identified. Two LCSH regions in Patient III-5, ∼31.8 Mb on chromosome 2 (55 794 944–87 581 115) and ∼27.1 Mb of chromosome 6 (129 631 804–156 780 260), were present. Since S&P syndrome appeared to be inherited as an autosomal recessive condition and because it appeared to be very rare, we assumed that the parents were distantly related. Therefore, we focused on the regions of LCSH. Regions of LCSH shared between both patients narrowed the genomic regions of interest to ∼7.8 Mb of chromosome 2 (79752445–87581115, Fig. 3) and ∼27.1 Mb of chromosome 6 (129 631 804–156 780 260).
Figure 2.
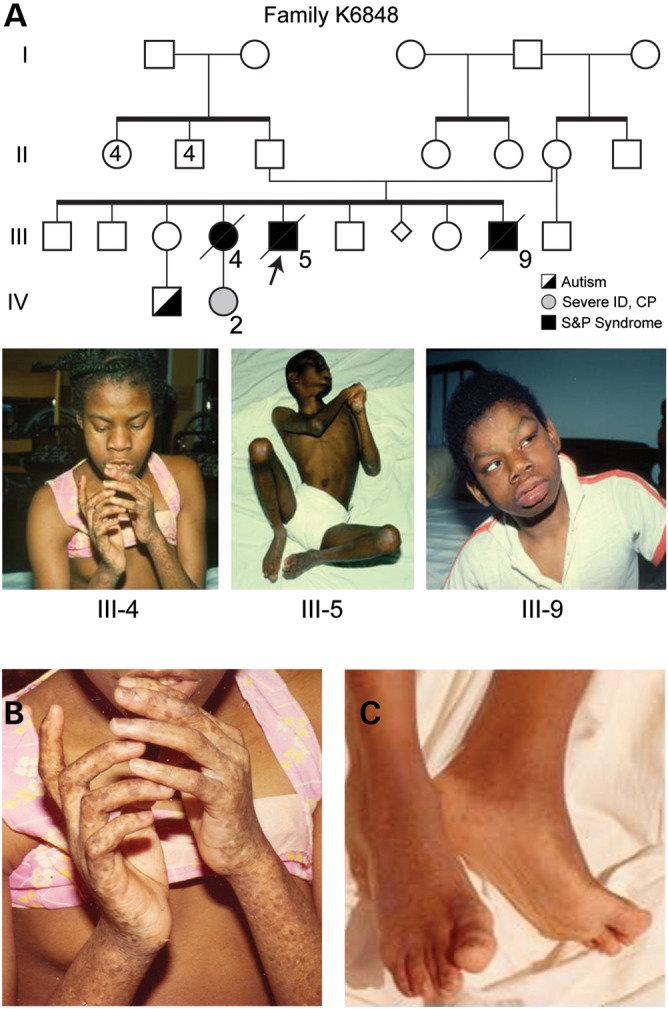
Pedigree and clinical presentation of Family K6848 with Salt and Pepper syndrome. (A) Partial pedigree of Family K6848. The proband, III-5, is indicated by the arrow. Photographs of the three siblings affected with S&P syndrome are shown below the pedigree (ID denotes intellectual deficiency; CP denotes cerebral palsy). (B) Closer view of the hands of Patient III-4 showing pigmentary findings and (C) the feet of III-5 showing hypertonicity.
Figure 3.

The ST3GAL5 mutation in S&P syndrome generates a p.E322K missense mutation within a highly conserved sialyltransferase domain. (A) ST3GAL5, like all other known mammalian sialyltransferases, is a type 2 transmembrane protein with a very small cytosolic domain (TM denotes transmembrane domain). The portion of the protein found within the Golgi lumen possesses a stalk domain that extends the carboxy-terminal, globular catalytic domain away from the Golgi membrane. All sialyltransferases possess four signature domains: the L-motif (long motif, green), the S-motif (short motif, pink), motif 3 (blue) and the VS-motif (very short motif, turquoise). (B) A survey of known ST3GAL5 S-motif sequences is aligned. Numbers indicate the starting residue of the presented sequences. In S&P syndrome, a c.994G>A transition results in an E>K missense mutation (highlighted in red) at a highly conserved residue within the sialyltransferase S-motif. The amino acids defining the conserved S-motif are boxed in pink and amino acid residues conserved across all identified ST3GAL5 proteins are indicated by a dot. The asterisk in the diagram indicates the approximate position of a mutation previously identified in Old Amish and French cohorts that cause a premature translational stop (see Discussion for more details). The accession numbers for the presented ST3GAL5 sequences are as follows: Homo sapiens NP_001035902.1; Pan troglodytes NP_001032378.1; Macaca mulatta NP_001244429.1; Mus musculus NP_035505.2; Gallus gallus NP_001001192.1; Takifugu rubripes XP_003978941.1; Danio rerio AAI64193.1; Felis catus XP_003984278.1. (C and D) The sequences of the wild-type (C) and S&P form (D) of ST3GAL5 were threaded onto the crystal structure of porcine ST3GAL1. The p.E332K mutation disrupts interactions between E332 and three basic residues (K95, R98 and R171). The replacement of the anionic carboxylate of the E residue with the amine of the K residue requires the S&P form of ST3GAL5 to accommodate an additional positive charge within a cluster of basic residues (K95, R98, R171), and, as a result, is predicted to partially unfold the protein.
Whole-exome and Sanger sequencing
Whole-exome sequencing was performed on the proband (III-5). The analysis identified 77 insertions and 109 deletions, but none of these were homozygous (Supplementary Material, Table S1). After filtering by dbSNP build 129 and the HapMap databases, 134 non-synonymous substitutions were identified. With the assumptions of S&P syndrome being a very rare autosomal recessive condition, we excluded heterozygous changes and changes not mapping to the LOH regions shared by the affected siblings. Additionally, since an updated dbSNP build was available, changes reported as SNPs in dbSNP build 137 were excluded along with those predicted to be benign by bioinformatic prediction tools. The one remaining homozygous mutation was a c.994G>A transition in exon 7 of the ST3GAL5 gene, mapping to chromosome 2p11.2, position 86066271–86116157. This alteration results in a missense mutation, p.E332K. The ST3GAL5 gene encodes for a glycosyltransferase, also known as GM3 synthase, which adds sialic acid in α2-3 linkage to lactosylceramide (Galβ4Glcβ1-ceramide) forming the GSL, GM3 ganglioside. Sanger sequencing of exon 7 of the ST3GAL5 gene confirmed the homozygous alteration in Patients III-4 and III-5 (Fig. 3). We screened 561 normal individuals from the same geographic area of the family (South Carolina), of which 216 were African Americans like the patients and failed to detect the ST3GAL5 c.994G>A transition.
Predicted impact of the S&P mutation on ST3GAL5 structure
The vertebrate sialyltransferase family of glycosyltransferases, of which ST3GAL5 is a member, is characterized by specific sequence motif elements. Among these elements are the L-motif, which has been shown to be responsible for binding of the donor nucleotide sugar (CMP-NeuAc) and the S-motif, which has been shown to participate in binding of both the donor and the acceptor (lactosylceramide in the case of ST3GAL5) (8,9). The p.E332K S&P syndrome mutation falls directly within the S-motif, predicting that it might disrupt a functionally important structural element (Fig. 3). We utilized multiple bioinformatic prediction tools to assess the pathogenicity of the identified transition, and these tools consistently returned findings of decreased protein stability, altered solvent accessibility, or likely disease causing (Supplementary Material, Table S2).
To augment this bioinformatic analysis, the wild-type and S&P syndrome ST3GAL5 sequences were threaded onto porcine ST3GAL1, the only available mammalian sialyltransferase whose structure has been solved (10). From this modeling, very large, negative folding free energy changes were calculated using three different force field parameters, consistent with the bioinformatics conclusion that the S&P syndrome mutation strongly destabilizes the protein. Averaging the results, the change in the folding-free energy was calculated to be −88.5 kcal/mol (Supplementary Material, Table S3).
In the modeled wild-type structure, E332 participates in a cluster of electrostatic interactions with neighboring positively charged residues (K95, R98, and R171). The distance between the CD atom of E332 and the NZ atom of K95 is only 4 Å and the distance between the CD atom of E332 and the CZ atom of R98 is 5 Å (Fig. 3). Such a structural arrangement results in the formation of two hydrogen bonds, one between E332 and K95 and the other between E332 and R98. Replacement of E332 with the positively charged amino acid K in the S&P syndrome structure positions an additional positive charge into the center of a ring of positive charges and there is little room for a structural rearrangement that might reduce the unfavorable interactions. Thus, in the energy-minimized structures, it can be seen that K332 pushes away from the side chains of K95, R98 and R171 and now the distance between K332 and R98 is 11 Å (Fig. 3). However, the unfavorable interactions cannot be eliminated and the mutant is predicted to be very unstable and perhaps partially unfolded.
Glycosphingolipid profiles of S&P fibroblasts
Total GSL preparations were resolved by TLC and the GSLs were detected with orcinol/H2SO4 reagent (Fig. 4). Three major GSL bands were detected in control fibroblasts that migrated as expected for two neutral globoseries structures (Gb3, Gb4) and one ganglioside (GM3). The GSL profile of fibroblasts cultured from Patient III-5 was also dominated by bands migrating as Gb3 and Gb4, but no GM3 was detected. The lack of detectable GM3 in III-5 fibroblasts is consistent with complete loss of function of ST3GAL5 activity due to the S&P syndrome mutation. To verify the structural assignments of the major and minor GSLs in control and III-5 fibroblasts, total GSL preparations were permethylated and analyzed by mass spectrometry (NSI-MS and MSn). Due to heterogeneity in the sphingosine and fatty acyl components of their ceramide moieties, GSLs sharing the same glycan head group are detected as a family of peaks within an envelope of masses in full MS (Fig. 5). The relative ratio of the peaks detected within each envelope provides information on the ceramide heterogeneity associated with each GSL. NSI-MS analysis verified that the major GSLs expressed in control fibroblasts are Gb3, Gb4, GM2 and GM3. The same neutral GSLs are detected in fibroblasts cultured from Patient III-5, although the envelope of masses associated with each GSL glycan headgroup indicates that the ceramide composition is shifted toward longer fatty acyl chains. Consistent with the TLC analysis, GM3 and GM2 were undetectable in III-5 fibroblasts. Despite the complete absence of GM3 and GM2 in Patient III-5, a relative increase in the precursor GSL LacCer was not detected. Thus, S&P syndrome fibroblasts do not accumulate the precursor, but instead process it such that extended neutral structures (Gb3 and Gb4 especially) are increased in prevalence. A small amount of GM1b, which is synthesized by ST3GAL2 not ST3GAL5 (Fig. 1), was detected in III-5 fibroblasts (Table 1).
Figure 4.
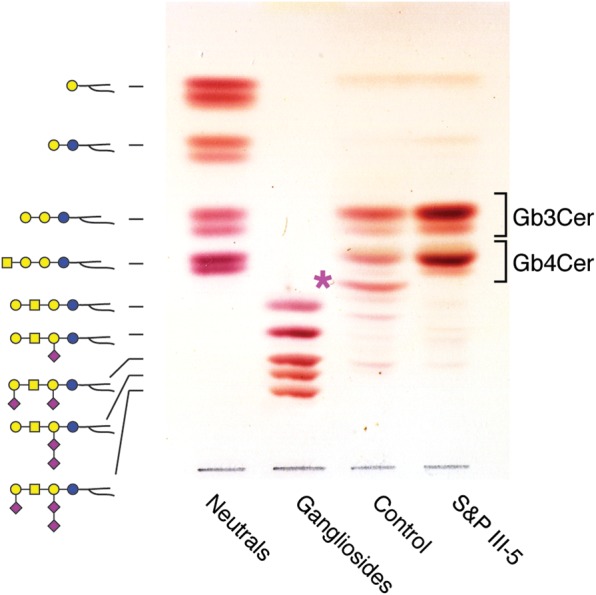
TLC analysis of GSLs extracted from control and S&P patient III-5 fibroblasts. Glycosphingolipid representations on the left indicate the migration positions of standards shown in the Neutral and Ganglioside lanes. The asterisk indicates GM3, which was detected in Control but not in S&P patient III-5 fibroblasts. In the absence of complex ganglioside biosynthesis, the GSL profile of III-5 fibroblast is enriched in globo-series products (Gb3- and Gb4Cer).
Figure 5.
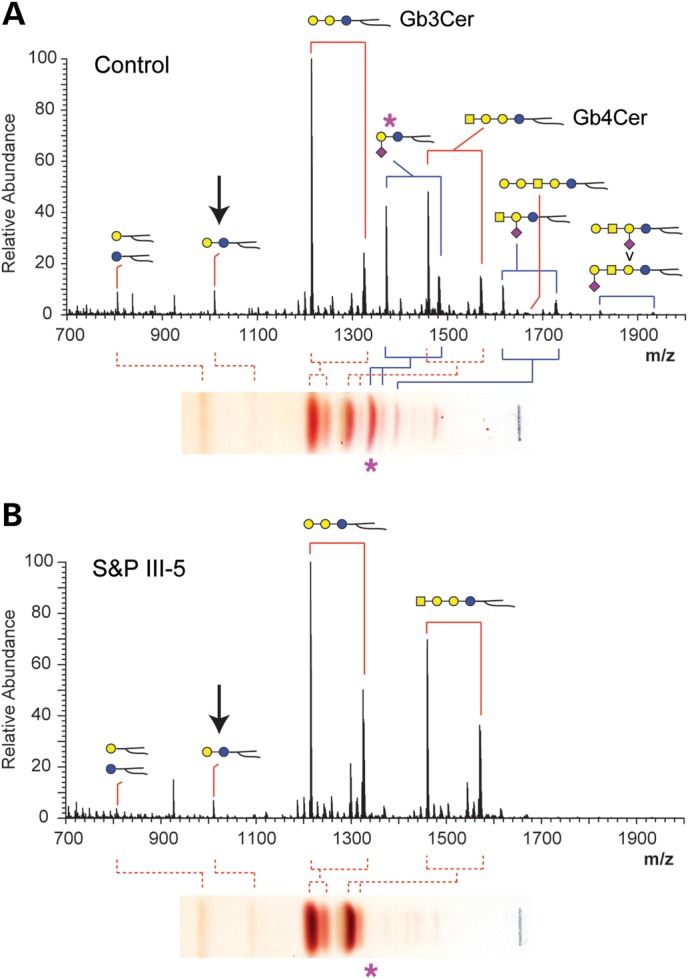
Mass spectrometric analysis of GSLs extracted from control and S&P patient III-5 fibroblasts. (A) Full mass spectrum (MS) of permethylated GSLs extracted from control fibroblasts shows predominance of the neutral Gb3Cer and the ganglioside GM3 (asterisk). The TLC lanes shown in Figure 4 are reproduced turned on their side for reference. Glycosphingolipids are detected as families of structures distinguished by their lipid compositons (red brackets). In some cases, these families overlap with each other (GM3 and Gb4Cer, for example), but individual peaks can be assigned to a specific lipid family based on MS/MS and MSn characterization of the associated glycan structure. The arrow indicates LacCer, the precursor for GM3. (B) Full MS of permethylated GSLs extracted from S&P III-5 fibroblasts shows a complete loss of GM3 and increase in the abundance of Gb4, while the relative abundance of LacCer is unchanged compared with control. The lipid distribution for each of the S&P GSL families is also shifted toward greater abundance of longer chain lipids.
Table 1.
Quantification of fibroblast glycosphingolipids
| Glycosphingolipidb | Percentage of total glycosphingolipid profilea |
|
|---|---|---|
| Control fibroblasts | S&P III-5 Fibroblasts | |
| HexCerc | 2.9 | 1.2 |
| LacCer | 3.0 | 2.2 |
| Gb3 | 42.9 | 56.8 |
| Gb4 | 21.2 | 39.3 |
| Lc3 | 0.1 | <0.1 |
| Lc4 | 0.9 | 0.2 |
| Gal-Lc4d | 0.4 | 0.2 |
| GM1a | 0.3 | ndf |
| GM1b | 0.6 | <0.1g |
| GM2 | 7.4 | Nd |
| GM3 | 19.6 | Nd |
| GD1e | 0.6 | Nd |
| GD3 | 0.2 | Nd |
| Total Neutral | 71.4 | 100.0 |
| Total Acidic | 28.6 | <0.1 |
aThe MS signal intensity measured for each indicated GSL was normalized to the summed intensity for all quantified GSLs.
bStandard GSL nomenclature is used, except where indicated below. Refer to Figure 1 for structural representations.
cHexCer indicates likely mixture of galactosylceramide and glucosylceramide.
dLc4 extended by Gal.
eGD1 is a mixture of GD1a and GD1b.
fnd indicates not detected.
g<0.1 indicates detected by fragmentation but not quantifiable in full MS.
Gene expression microarray
We extracted RNA from fibroblasts harvested from Patient III-5 and designed primers to amplify both the long (418 amino acids) and short (395 amino acids) isoforms of the ST3GAL5 transcripts. The analysis confirmed that both the isoforms were expressed and that the amplified bands matched the expected sizes, indicating that the c.994G>A mutation did not directly affect gene expression or splicing. We performed microarray expression analysis for RNA extracted from Patient III-5 fibroblasts and from 10 normal individual's fibroblasts to assess the expression levels of mRNAs encoding glycosyltransferases relevant to GSL biosynthesis. The transcript level for B4GALT6, the enzyme responsible for producing LacCer, was decreased five-fold (see Fig. 1 for reference and Table 2). For enzymes that utilize LacCer as substrate and thereby initiate the production of three different GSL core structures, the array revealed significantly decreased expression of A4GALT (Globo series, 2.5-fold), insignificant change in B3GNT5 (Lacto series), and slightly increased expression of ST3GAL5 (Ganglio series, 1.4-fold). For enzymes that extend the Ganglio series core, transcription of B4GALNT1 was increased (4.3-fold) and B3GAL4 was decreased (3.3-fold). For enzymes that cap the Ganglio series GSLs by adding sialic acid to the external Gal residue (ST3GAL2 and ST3GAL3) or to another sialic acid residue (ST8SIA1), transcript changes ranged from a 5-fold decrease to nearly a 2-fold increase. Finally, sialyltransferases that add sialic acid to glycoprotein glycans, but not to GSL, also showed a range of changes, from insignificant (ST3GAL1), to increased nearly 3-fold (ST3GAL4) and decreased 5-fold (ST3GAL6).
Table 2.
Relative changes in glycosyltransferase mRNA levels
| Pathway | Enzymea | Fold-Change (S&P/Control)b | P-valuec |
|---|---|---|---|
| LacCer synthesis | B4GALT6 | 0.2 ↓ | 0.001 |
| Globo series initiation | A4GALT | 0.4 ↓ | 0.024 |
| Lacto series initiation | B3GNT5 | 0.5 — | 0.175d |
| Ganglio series initiation | ST3GAL5 | 1.4 ↑ | 0.001 |
| Ganglio series extension and capping | B4GALNT1 | 4.3 ↑ | 0.001 |
| B3GALT4 | 0.3 ↓ | 0.001 | |
| ST3GAL2 | 0.2 ↓ | 0.002 | |
| ST3GAL3 | 1.2 ↑ | 0.032 | |
| ST8SIA1 | 1.8 ↑ | 0.003 | |
| Protein sialylatione | ST3GAL1 | 0.8 — | 0.520d |
| ST3GAL4 | 2.7 ↑ | 0.004 | |
| ST3GAL6 | 0.2 ↓ | 0.001 |
ache activity of the enzymes in GSL biosynthesis is summarized in Figure 1.
bFold-change calculated by dividing the normalized transcript abundance detected in S&P fibroblasts by the normalized transcript abundance detected in control fibroblasts. Arrows indicate a significant increase or decrease (up or down, respectively).
cP-values by Wilcoxon-Rank-Sum test.
dNot significant.
eSialyltransferases which transfer sialic acid preferentially to N-linked and O-linked glycoprotein acceptors, not to GSL.
O-linked and N-linked glycoprotein glycosylation in S&P syndrome fibroblasts
O-linked glycans were released from control and S&P syndrome fibroblast proteins by reductive β-elimination and characterized by NSI-MSn. The profile of major O-linked glycans is shifted toward more highly sialylated forms (structures 6–9) in III-5 at the expense of precursor structures (structures 1, 2, 4; Fig. 6). The relative abundances of sialylated, isobaric glycan pairs (structures 2, 3 and 7, 8) were validated by MS fragmentation. N-linked glycans were released from fibroblast proteins by PNGaseF digestion and characterized by NSI-MS and MSn. Similar to the O-linked glycans, the N-linked glycan profile of III-5 fibroblasts was noticeably shifted toward increased abundance of complex, sialylated structures, with a concomitant decrease in high-mannose precursors (Fig. 7).
Figure 6.
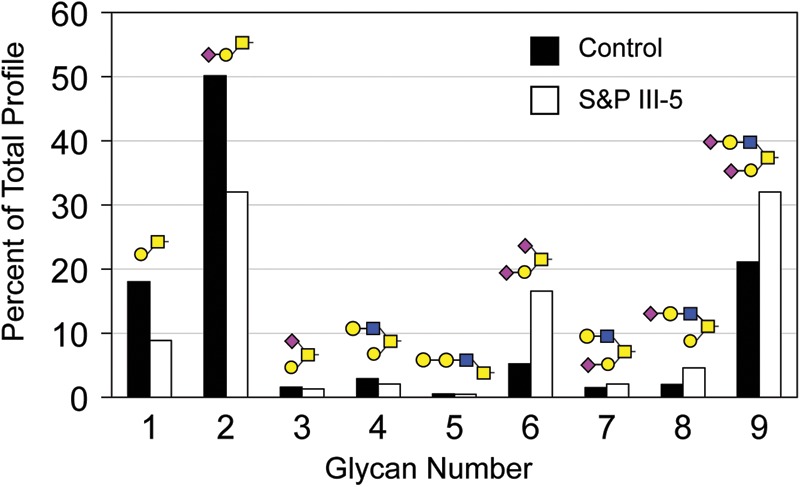
The glycoprotein O-linked glycan profile is enriched for highly sialylated structures in S&P III-5 fibroblasts. After β-elimination and permethylation, the relative abundance of the indicated glycans was measured by MS. In the S&P fibroblasts, the amount of the core 1 disaccharide and its monosialylated derivative (glycans numbered 1 and 2, respectively) are decreased relative to control, while the disialylated form of the same structure (glycan number 6) is increased, indicating potentially compensatory shifts in glycoprotein sialylation as glycolipid sialylation decreases. A similar shift toward greater sialylation is seen on core 2 structures as well (glycans numbered 4, 7, 8 and 9).
Figure 7.

The glycoprotein N-linked glycan profile is enriched for sialylated, complex glycans in S&P III-5 fibroblasts. After release by PNGaseF and permethylation, the relative abundance of the indicated glycans was measured by MS. Complex, sialylated glycans (highlighted in purple) are increased and less processed high mannose structures (highlighted in green) are decreased in comparison with control.
Knockdown of st3gal5 in the zebrafish embryo increases neural apoptosis
In order to test whether loss of ST3GAL5 expression impacts embryonic development, 4 ng (0.5 µm) of a translation-blocking antisense morpholino (MO) targeting st3gal5 mRNA was injected into one-cell stage zebrafish embryos and the gross morphology of wild-type and morphant embryos was analyzed at 3 dpf (days post fertilization). Aside from a slight developmental delay, which is typical following morpholino injection, knockdown of st3gal5 expression did not appear to result in any obvious phenotypes, demonstrating that early developmental processes were not affected in the morphants (Fig. 8). Since alterations in GM3 levels have been suggested to affect the viability and function of cultured neurons (11), acridine orange staining was performed to determine whether increased cell death was occurring in the morphant brain. A consistent increase in the number of acridine orange-positive cells was detected in the mid to hindbrain region of morphant embryos. TUNEL staining of morphants verified that this cell death resulted from apoptosis and also revealed increased cell death among neural crest cells in morphant embryos (data not shown). Overexpression of st3gal5 mRNA in the morphant background effectively rescued the cell death phenotype, indicating that this phenotype does not arise from off-target MO effects but is instead a function of decreased St3gal5 activity. A role for st3gal5 in early stages of embryonic brain development is further supported by previous in situ analyses, which revealed significant st3gal5 transcript abundance throughout the embryonic zebrafish brain (11,12).
Figure 8.

Knockdown of st3gal5, but not overexpression, results in increased neuronal cell death in zebrafish embryos. Zebrafish embryos were injected with either antisense morpholinos against st3gal5, st3gal5 mRNA, or both and were subsequently analyzed for gross morphology and stained with acridine orange to assess cell death in the brain. Gross morphology of 3 dpf embryos was assessed by light microscopy (left column). Acridine orange staining of 3 dpf embryos was assessed by fluorescence microscopy at 50× magnification (middle column) and at 200× magnification (right column) of the head region. Compared with wild-type (WT), acridine orange staining reveals increased cell death in morpholino-injected embryos (ST3GAL5 MO). Cell death was rescued by co-injection of untargeted ST3GAL5 mRNA (ST3GAL5 MO + RNA). Gain-of-function phenotypes were not detected with increased enzyme expression, achieved by injection of st3gal5 mRNA into wild-type embryos (mRNA alone).
Prior work on zebrafish st3gal5 suggested that overexpression of st3gal5 mRNA resulted in neuronal cell death, as well as changes in the expression of several neuronal cell markers (11). To address whether overexpression of normal st3gal5 mRNA resulted in phenotypes, 150 pg of st3gal5 mRNA was injected into control embryos and gross morphology and cell death were analyzed. In contrast to the previous studies of other investigators (11), which involved significantly higher mRNA concentrations, embryos injected with 150 pg of mRNA were indistinguishable from non-injected embryos, indicating that overexpression of st3gal5 mRNA is not, by itself, sufficient to cause increased neuronal cell death. In the previous studies, it is difficult to discern whether higher levels of st3gal5 expression causes cell death or whether high levels of its mRNA is toxic. Furthermore, injection of mRNA, which encoded for the E332K S&P syndrome patient mutation within the zebrafish enzyme, into control embryos failed to result in any phenotypes, providing additional evidence that overexpression of st3gal5 mRNA in both control and mutated forms does not alter embryonic development in zebrafish that possess a normal copy of st3gal5.
The impact of decreased st3gal5 expression on GSL and O-linked glycoprotein glycosylation in zebrafish embryos
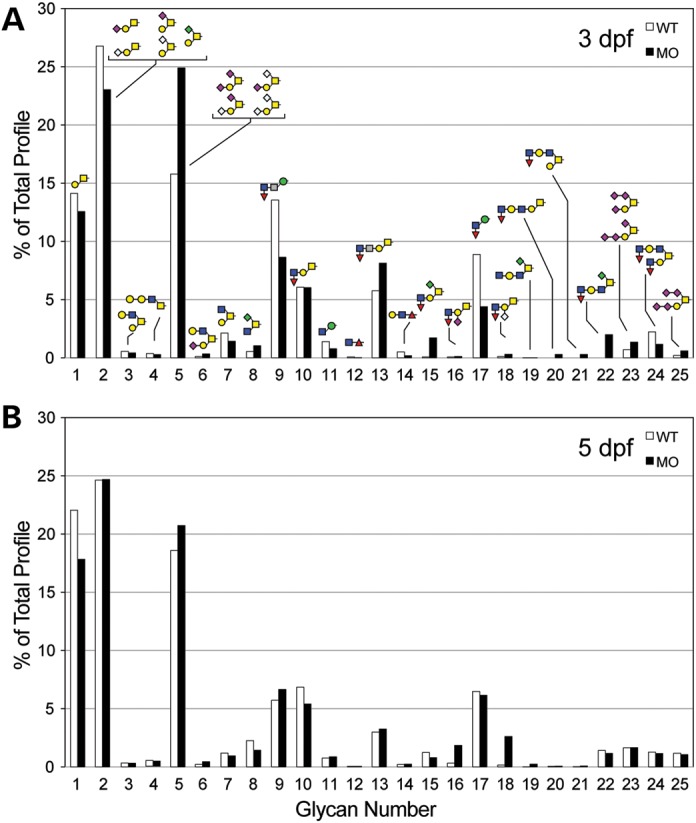
Total GSLs harvested from zebrafish embryos were permethylated and analyzed by NSI-MS. The major GSLs expressed in wild-type (WT) 3 dpf embryos are monohexosylceramide and GM3. Ganglioside expression diversifies during normal development, such that by 5 dpf more complex and multiply sialylated GSLs are detected (Fig. 9). The st3gal5 morphant embryos exhibited reduced expression of GM3 and of the more complex GSLs at 3 and 5 dpf. LacCer, the substrate for St3gal5, accumulated in morphants at both days, an increase that was not detected in the S&P syndrome fibroblast GSL profiles (Figs 9 and 10 and see Table 1). Unlike S&P syndrome fibroblasts, the GSL profile of the zebrafish morphants indicates partial loss of St3gal5 activity, which is supported by the dose-dependent recovery of LacCer and GM3 levels following co-injection of wild-type st3gal5 mRNA (Fig. 10). At 3 dpf, morphants possessed the highest levels of LacCer and lowest levels of GM3, while morphants co-injected with wild-type mRNA exhibited attenuated increases in LacCer and intermediate levels of GM3. Overexpression of st3gal5 achieved by injection of wild-type mRNA into wild-type embryos increased GM3 levels above normal and enhanced the production of the more highly sialylated GSLs GD3 and GT3 that lie biosynthetically downstream of GM3 (Fig. 10). Overexpression of the mutated st3gal5 mRNA did not significantly affect GSL levels, indicating that the S&P form of the enzyme does not possess a dominant negative influence on GSL processing in the presence of endogenous levels of wild-type enzyme.
Figure 9.

Knockdown of st3gal5 decreases GSL complexity in zebrafish embryos. (A) The full MS GSL profile of wild-type (WT) embryos 3 days post fertilization (dpf) is dominated by hexaosylceramide and GM3. (B) Morpholino knockdown of st3gal5 (ST3GAL5 MO) decreases GM3 levels at 3 dpf and increases LacCer, the precursor for GM3. (C) At 5 dpf, wild-type GSL profiles become diversified by the appearance of complex, highly sialylated species. (D) st3gal5 MO embryos at 5 dpf are greatly reduced in GM3 and in all of the more complex sialylated GSLs, while LacCer remains elevated in st3gal5 MO embryos at 5 dpf.
Figure 10.
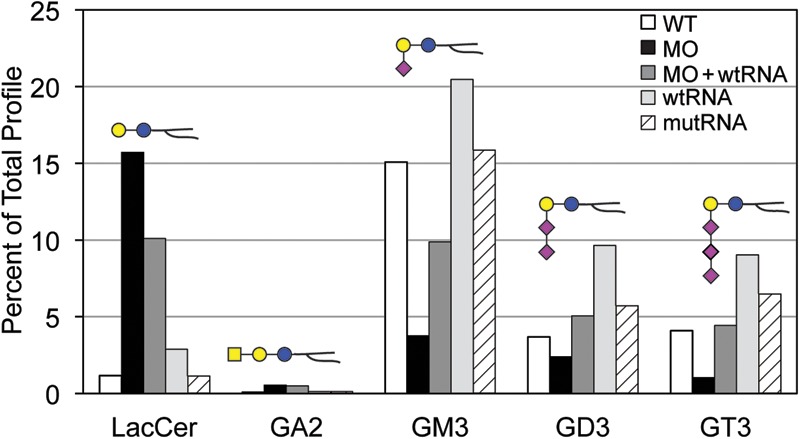
Glycosphingolipid levels respond to st3gal5 dosage in zebrafish embryos. The relative abundances of 5 GSLs that lie along the two branching biosynthetic pathways are shown as detected in 3 dpf zebrafish embryos. LacCer is the precursor for the formation of GA2 and GM3. Knockdown of st3gal5 (MO) reduces GM3 levels, which is expected to decrease the flux of LacCer entering into the formation of GM3, GD3 GT3, and more complex gangliosides. Accordingly, LacCer and GA2 levels are increased in the morphant. The increase in LacCer and the decreases in GM3 as well as the more highly sialylated gangliosides (GD3, GT3) can be titrated toward normal levels by expressing WT st3gal5 in the morpholino background (MO + wtRNA). The production of GM3, and more highly sialylated gangliosides, is further enhanced by expression of wild-type st3gal5 in the WT background (wtRNA). Injection of the S&P mutant RNA (mutRNA) into WT embryos has no effect on GSL production, indicating that the S&P enzyme lacks a dominant negative effect on biosynthesis.
For O-linked glycans built on the core 1 structure (Galβ3GalNAcα-Ser/Thr), expression in morphant embryos was shifted toward greater sialylation (compare structures 2 with 5, 15, 23 and 25) in 3 dpf embryos, but largely reverted to normal by 5 dpf, perhaps reflecting attenuation of the morpholino knockdown (Fig. 11). A similar reduction at 3 dpf and subsequent normalization at 5 dpf were apparent in the increased levels of sialylated O-linked glycans built on the core 3 structure (GlcNAcβ3GalNAcα-Ser/Thr, compare structures 8, 22) (Fig. 11). Multiple forms of sialic acid were detected in both wild-type and morphant zebrafish O-linked and GSL preparations, including N-acetylneuraminic acid (NeuAc), N-glcolylneuraminic acid (NeuGc) and 2-keto-3-deoxynononic acid; changes in glycan sialylation were not restricted to glycans bearing any one type of sialic acid. Thus, as detected in S&P syndrome fibroblasts, the glycoprotein glycan profile of the zebrafish st3gal5 morphant was shifted toward greater sialylation in response to altered GSL biosynthesis.
Figure 11.
The glycoprotein O-linked glycan profile is enriched for highly sialylated structures in zebrafish st3gal5 morphant embryos. (A) O-linked glycans were released by β-elimination from glycoproteins harvested from 3 dpf embryos that were either WT or ST3GAL5 morphants (MO). Following permethylation, glycan profiles were characterized by mass spectrometry. Core 1 disaccharide (glycan number 1), as well as the monosialylated forms of the core 1 disaccharide (glycans numbered 2) were decreased in the morphant, while disialylated and multisialylated core 1 was increased (glycans numbered 5, 23 and 25). (B) At 5 dpf, the shift toward greater O-linked glycan sialylation was attenuated.
DISCUSSION
This report joins three other published studies that describe GM3 synthase mutations in other cohorts, expanding the phenotypic presentation associated with GM3 synthase deficiency (13–15). This work also extends our understanding of the underlying molecular pathology associated with loss of ST3GAL5 by providing a uniquely comprehensive analysis of the glycomic consequences associated with altered glycolipid biosynthesis and by biochemically validating an in vivo model system for investigating the pathology engendered by glycomic changes. The present findings demonstrate that ST3GAL5 loss-of-function results in a multisystem disorder characterized by neurological deficits and cutaneous pigmentation changes (15). Furthermore, definitive alteration in the GSL profile is accompanied by collateral modulation of glycoprotein sialylation in patient fibroblasts and in ST3GAL5-deficient zebrafish embryos. Finally, these glycomic changes drive increased neural apoptosis in the zebrafish brain, suggesting one plausible mechanism for the emergence of intellectual disability in affected patients.
The ST3GAL5 mutation described previously in the Amish and French cohorts generates a protein truncated within the catalytic domain of the enzyme, between the conserved L- and S-motifs. Both of these motifs contribute to the binding of nucleotide sugar donor but only the S-motif has been shown to interact with the LacCer acceptor (8,9,16). Therefore, it is unlikely that the truncated protein binds LacCer, making this precursor freely accessible to glycosyltransferases of other GSL biosynthetic pathways. Consistent with this altered biosynthetic landscape, Fragaki et al. reported significant increases of Gb3 and Gb4 at the expense of a 4-fold decrease of LacCer in fibroblasts from the French cohort (13). In contrast, the S&P syndrome mutation produces a lysine to glutamate substitution in an otherwise intact, but likely disordered, S-motif. While this change is sufficient to render the protein enzymatically inactive, as judged by the complete loss of GM3, it cannot be ruled out that LacCer binding still occurs. Although unproductive for catalysis, this binding may sequester a pool of LacCer away from competing, non-ganglioside GSL biosynthetic pathways, accounting for the less dramatic decrease of LacCer seen in S&P fibroblasts (17,18). While the subtle glycomic alterations detected between these cohorts may arise from real biochemical differences in the stability, activity or targeting of the gene product produced by each variant, they may also reflect the impact of divergent ethnicities on the phenotype, as has been demonstrated for mutant alleles of another human sialyltransferase, ST3GAL3 (19,20).
From the fibroblast analysis reported here and from previous work on the Amish deficiency, a few key elements emerge as guidelines for what to expect in cells of neural origin. First, in all samples derived from these patient populations (plasma and fibroblasts) the lipid portion of the glycolipid profile exhibits a significant shift toward ceramides with increased fatty acid chain length, regardless of which glycan headgroup is attached (13). This shift is also evident in our zebrafish model as well as in a previously published analysis of fibroblast gangliosides harvested from the ST3GAL5 knockout mouse (21). Ceramide remodeling is of interest because fatty acid chain lengths not only determine the biophysical properties of lipid bilayers, but have also been shown to directly modulate protein kinase activation in response to specific signaling stimuli (22,23). Second, our comprehensive glycomic approach revealed the appearance of collateral changes in O-linked and N-linked glycoprotein glycosylation in S&P syndrome fibroblasts. A previous report also identified shifts in the N-linked glycan profile of fibroblasts harvested from ST3GAL5 knockout mice (24). These glycomic changes must arise as a result of induced changes in the glycan processing machinery since ST3GAL5 has no role in glycoprotein sialylation. It is currently unclear whether increased glycoprotein sialylation, especially on O-linked glycan cores, provides some compensation for loss of GM3 ganglioside or whether altered glycoprotein sialylation generates gain-of-function phenotypes that might also contribute to the pathology of ST3GAL5 deficiency.
The collateral changes in glycoprotein glycosylation that we have detected in S&P fibroblasts might arise from alterations in one or more of the biochemical and cellular components known to be essential for glycan biosynthesis and processing (7). These important regulatory components include the maintenance of appropriate donor nucleotide sugar levels in the endoplasmic reticulum and Golgi apparatus, the proper trafficking and localization of glycosyltransferases within the secretory apparatus, the trafficking routes taken by individual target glycoproteins, and the transcription/translation of genes and mRNAs encoding processing enzymes. We directly investigated the mRNA levels for genes encoding for transferases relevant to GSL glycosylation and for a subset of sialyltransferases that modify glycoprotein glycans. From other studies in cultured stem cells and mature tissues, it has become clear that glycosyltransferase transcript levels sometimes correlate and sometimes do not correlate with glycan abundances (25,26). Transcript levels usually correlate well with glycan abundances in wild-type cells or tissues when the transcript encodes for an enzyme that lies at a crucial control point along a biosynthetic pathway. In S&P fibroblasts, transcripts for enzymes that would take LacCer down biosynthetic pathways other than ganglioside formation (toward Globo and Lacto series) are actually decreased while their products are increased, perhaps suggesting a feedback mechanism that functions to limit further production of globo and lacto series GSLs. For the ganglio series pathway, the first two enzymes that commit LacCer toward production of a ganglioside are ST3GAL5 and the GalNAc transferase B4GALNT1, both of which are increased in S&P fibroblasts that lack the product of these enzymes, again consistent with a feedback mechanism that is attempting to divert LacCer flux toward production of missing GSLs. The abundances of other glycosyltransferase transcripts do not obviously fit within such a regulatory model, but, as is true for all of these genes, transcript levels may not always faithfully report protein production. An interesting change is the significant increase in ST3GAL4 mRNA (almost 3-fold), perhaps indicating that the collateral increase in mucin-type O-linked glycan sialylation can be attributed to up-regulation of this enzyme.
Ganglioside GM3 has been implicated as a modulator of signaling through multiple receptor pathways, including EGF, bFGF, TNFα, PDGF, VEGF, and insulin (27–38), as well as through associated downstream effectors, such as MAPK, PI3K/AKT, PTEN, and ZAP70 (39–45). In some instances, GM3 serves to enhance signaling through these pathways. Thus, fibroblasts harvested from Amish ST3GAL5 deficient patients exhibit reduced proliferation in response to EGF (46), consistent with previous work in multiple cell types demonstrating altered EGF receptor signaling upon perturbation of ganglioside complexity (30,31,46,47). However, negative regulatory roles for GM3 have also been identified. For instance, insulin signaling is enhanced in the ST3GAL5 knockout mouse and exogenous GM3 blocks VEGF receptor signaling in endothelial cells during angiogenesis (34,48). The pleiotropic effects associated with altered GM3 expression likely reflect the important function of this ganglioside in forming or stabilizing glycolipid enriched membrane microdomains that serve as raft-like platforms to facilitate signaling through multiple pathways (32,33,45,49,50). But structurally specific interactions between receptor proteins and GM3 ganglioside have also been demonstrated (33). Thus, the effect of GM3 depletion on the function of any given cell type will depend strongly on the specific set of receptors and downstream effectors expressed by that cell (51). Loss of GM3 and more complex gangliosides in S&P syndrome and in the Amish ST3GAL5 deficiency reveal the preeminent sensitivity of human neural cells to altered GSL biosynthesis.
ST3GAL5 knockout mice exhibit enhanced insulin sensitivity, hearing loss due to degeneration of the organ of Corti, neuropsychological impairments and compromised CD4+ T-cell activation (52–56). In comparison, S&P syndrome and Amish ST3GAL5 deficiency patients present with severe epilepsy, multiple sensory disruptions (hearing and vision) and disorders of neural crest cell migration and function (facial dysmorphogenesis and dermal pigmentation, respectively). To date, seizure disorders have not been reported in the mouse model and neither lymphocyte function nor insulin homeostasis have been investigated in human patients. Thus, despite complete loss of the ST3GAL5 gene in the mouse knockout, the human deficiency appears to present with a more severe phenotype. It remains to be determined whether this difference reflects, in humans, a greater need for complex gangliosides or the effects of expressing an altered ST3GAL5 protein compared with a true null in the mouse. For both the S&P syndrome and Amish ST3GAL5 synthase deficiencies, the acquisition of neuronal and neural crest cells through induced pluripotent cell production would significantly advance the goal of understanding the contribution of altered GSL biosynthesis to the pathogenesis of specific cell types.
MATERIALS AND METHODS
Family K6848
Three African-American siblings with abnormal pigmentation and severe intellectual disability were originally evaluated and reported in 1983 (1). The pigmentary changes were described as ‘salt-and-pepper’ due to scattered hyper-and hypo-pigmented macules ranging from 1 to 5 mm on the face, trunk and extremities including the palms and soles. Additional shared features included microcephaly, abnormal facies (midface hypoplasia, prominent lower face), scoliosis, choreoathetosis, spasticity and abnormal EKG. Radiographic examinations indicated decreased bone mineralization.
Individual III-5 (Fig. 2), the proband, weighed 3.6 kg at birth after an uncomplicated pregnancy. By report, he could sit and was starting to crawl at 6 months. Those skills were lost following a febrile illness shortly thereafter. The pigmentary changes were reported to develop after 2 years of age. When seen at 13 years of age, his measured IQ was 4, and he was nonverbal and nonambulatory. No additional cutaneous changes were noted. Histologic examination of a hyperpigmented lesion demonstrated increased pigmentation in the basal layer of the epidermis, consistent with an ephelis or freckle. Prominence of the rete ridges as seen in a lentigo was not noted. Decreased pigment in the basal layer of the epidermis was seen in a hypopigmented lesion. EKG revealed nonspecific conduction changes. He is deceased.
Individual III-4 weighed 4.0 kg at birth after a home delivery. By report, she was not able to sit until 3 years of age. She was nonverbal and nonambulatory, and her measured IQ was 2. Re-evaluation of individual III-4 at 33 years of age noted microcephaly, tremor, ataxia, quadriparesis with incoordination, dyskinesia and spasticity and profound intellectual disability. Serum amino acids and chromosome studies (including fragile site analysis) were normal. An ophthalmology examination was reported to be normal, without evidence of pigmentary changes in the retina. She died at the age of 37.
Individual III-9 weighed 3.6 kg at birth after an uncomplicated pregnancy. All developmental milestones were severely delayed and he was nonverbal and nonambulatory when seen at 12 years of age. He had the additional feature of seizures. Serum amino acids and chromosome analysis, including fragile site analysis, were normal. He is deceased.
Individual IV-2 was born to individual III-4 as a result of a pregnancy by an undetermined family member. She had intrauterine growth retardation at birth, including microcephaly. At 10 years of age, she was reported to have intellectual disability, cerebral palsy, and to be nonambulatory. She was reported to not have pigmentary changes similar to her mother.
The parents of individuals III-4, III-5 and III-9 and five unaffected full siblings did not have similar pigmentary changes, facial features or neurologic deficits. There was no known consanguinity at the time of evaluation of the family.
High-density SNP microarray analysis
Genomic DNA was isolated and purified from lymphocytes using the QIAamp DNA blood mini kit (Qiagen, Valencia, CA, USA). The Affymetrix Genome-Wide Human SNP 6.0 assay was preformed according to the manufacturer's protocol (Affymetrix, Santa Clara, CA, USA) in the Cytogenetics Diagnostic Laboratory at the Greenwood Genetic Center. Briefly, 250 ng DNA was digested with Nsp I or Sty I (New England Biolabs, Ipswich, MA, USA) and ligated to the appropriate adaptors for subsequent PCR amplification (30 cycles; Titanium DNA Amplification Kit; Clontech, #639240). The PCR products were purified using Agencourt AMPure Magnetic Beads (Fisher, # NC9113390), fragmented, labeled and added to the array chips. Hybridization was performed for 16–18 h in the GeneChip® Hybridization Oven 645. The arrays were washed and stained in the GeneChip® Fluidics Station 450 and scanned using an Affymetrix Genome wide SNP 6.0 array protocol (Affymetrix) using the GeneChip® Scanner 3000 7G. Copy number analysis was performed with Affymetric's Genotyping Console 4.0 using the in silico control of 270 HapMap samples.
Copy number and loss of heterozygosity (LOH) analysis were conducted using Genotyping Console software version 4.0. Minimum requirements for copy number segments were set to five probes and 40 kb. For homozygosity mapping and identification of shared regions of LOH, autosomal LOH data were exported and the results were evaluated using Microsoft Excel. The results were based upon reference genome build hg18.
Whole-exome sequencing
The Agilent SureSelect Target Enrichment System capture kit was utilized according to the manufacturer's sequencing protocol. Genomic DNA was randomly fragmented using a Covaris E220 Ultrasonicator (Covaris, Woburn, MA, USA), and the size of the library fragments was mainly distributed between 150 and 200 bp as viewed by gel electrophoresis. Adapters were ligated to both ends of the resulting fragments. The adapter-ligated templates were purified using the Agencourt AMPure SPRI beads and fragments with an insert size of ∼250 bp were excised. Extracted DNA was amplified by a ligation-mediated PCR (LM-PCR), purified and hybridized to the SureSelect Biotinylated RNA Library (BAITS) for enrichment. Hybridized fragments were bound to the strepavidin beads and non-hybridized fragments were washed out after 24 h. Captured LM-PCR products were analyzed on an Agilent 2100 Bioanalyzer to estimate the magnitude of enrichment. Each captured library was then loaded on a Hiseq2000 platform and high-throughput sequencing of the captured library was conducted. Raw image files were processed using the Illumina basecalling Software 1.7 with default parameters and the sequences were generated as 90 bp pair-end reads.
Bioinformatic analyses
An Exome Capture pipeline was used for single nucleotide variation and small insertion or deletion (Indel) detection in human exome sequencing (Supplementary Material, Fig. S2). First, before any reads were mapped, a FASTQ purification process was performed, including adapter removal and elimination of low quality reads. Next, all clean reads were aligned against the reference genome (hg18, build 36) using SOAP2 with parameters that included sequence similarity, pair-end relationships and sequence quality. PCR duplications were removed from SOAP2 output. The SOAP2 output was separated out by chromosome and the alignments were sorted by their mapping sites. SOAPsnp was employed to detect SNPs and these were annotated using suitable criteria. Related statistics data was generated and summarized. Finally, all the qualified data were analyzed for the presence of indels, filtered and annotated. After annotation of the resulting variants, several approaches were applied to identify candidate genes. First, variants were filtered against known SNPs, including dbSNP129 from NCBI, data of 1000 genomes project, 8 hapmap exomes or control samples if available. Second, candidate variants were assumed to be non-synonymous or at splice sites, so neutral changes were removed. Third, only variants which were present in regions of LOH were noted (Supplementary Material, Table S1).
In order to validate the whole-exome sequencing findings, we amplified and sequenced exon 7 of the ST3GAL5 gene using primers designed with Primer 3 Input (http://frodo.wi.mit.edu/primer3/). As a reference, sequences deposited in the Ensembl genome browser were used (http://www.ensembl.org/index.html), according to genome build GRCh37.1. We used the genomic ENSG00000115525 sequence and the transcript ENST00000393808 and ENST00000377332 sequences, encoding for the short (395 amino acids, NP_001035902.1) and long (418 amino acids, NP_003887.3) isoforms of the ST3GAL5 protein, respectively. All substitutions were examined for splice sites that may have been created or deleted, using the Splice Site Calculator (http://192.168.50.223/splicing/maxent.cgi) and the Splice Site Score Calculation (http://rulai.cshl.edu/new_alt_exon_db2/HTML/score.html). These alterations were also analyzed by RESCUE-ESE (http://genes.mit.edu/burgelab/rescue-ese/) to see if the new variant introduced or removed an exon splicing enhancer (ESE) site. ST3GAL5 sequences were compared with homologous genes in the evolutionary lineage by the UCSC genome browser (http://genome.ucsc.edu/), in order to check the conservation rate for each nucleotide variant. All variants identified by whole-exome sequencing were analyzed for their pathogenic potential using bioinformatic resources available at publicly accessible websites (Supplementary Material, Table S2).
Structural modeling and calculation of folding-free energy change
The 3D structure of ST3GAL5 is not available and therefore it was modeled in silico. The sequence of lactosylceramide alpha-2,3-sialyltransferase (gene name ST3GAL5, UniProt identifier ‘SIAT9_HUMAN, Q9UNP4′) was retrieved from the protein knowledgebase UniProtKB (http://www.uniprot.org/). The 3D structure was modeled by the fully automated protein structure homology-modeling server SWISS-MODEL (http://swissmodel.expasy.org/). The model characteristics were as follows: the modeled residue range was set from 95 to 390; the model was based on the crystal structure of mammalian sialyltransferase, Protein Data Bank ID 2WML, Porcine ST3GAL1, (1.90 Å); Sequence Identity 22.62%; E-value 0.00e-1; QMEAN Z-Score -4.64. The wild-type and S&P syndrome structures were both subjected to the TINKER minimization module (‘minimize’ unit in TINKER package with RMS gradient per atom criterion set to 0.01) to energy minimize the structures. After minimization, the total potential energy was calculated with the ‘analyze’ unit in the TINKER package. Three different force field parameters were used independently Amber98, CHARMM27 and OPLS-aa and the results were averaged. Folding-free energy calculations follow the approach we have described previously (Supplementary Material, Table S3) (57,58).
Human gene expression microarrays
The Agilent Whole Human Genome Oligo Microarray, containing over 40 000 human genes and transcripts (59), was used to evaluate gene expression changes in S&P syndrome. Two independent experiments were performed for each fibroblast sample. To maximize the contrast between samples, we implemented a loop experimental design with dye swap (60). Total RNA was isolated using the Agilent Total RNA Isolation Mini Kit (Agilent Technologies, Wilmington, DE, USA). RNA samples were labeled with Cy3 or Cy5 fluorescent dye and hybridized for 17 h, and microarray slides were washed and scanned by an Agilent G2505B microarray scanner. Image processing and fluorescence intensity were interpreted and analyzed by Agilent Feature Extraction (version 9.1).
Preparation of GSL
Fibroblasts (between 1–2 × 10⁶ for control and 1–1.5 × 10⁷ cells for Patient III-5) or dechorionated, manually deyolked zebrafish embryos (150 embryos from 3 dpf and 100 embryos from 5 dpf) were treated with organic solvents to precipitate proteins and extract GSLs as described previously (61). Briefly, cell pellets or zebrafish embryos were Dounce homogenized in 50% methanol on ice, and then ice-cold water (W), methanol (M) and chloroform (C) were added to give a final C/M/W ratio of 4:8:3. The suspension was transferred into a Teflon-lined screw cap glass tube, agitated for 2 h at room temperature and clarified by centrifugation. The supernatant was saved and the resulting pellet was re-extracted three times with fresh C/M/W (4:8:3), and all supernatants were combined as the lipid extract. The final pellets of insoluble materials were dried to yield protein-rich powders that were subsequently used for protein-linked glycan analyses (see below). Lipid extracts were dried under a nitrogen stream and saponified to remove glycerophospholipids (62). Saponification was achieved using 0.5 M KOH in methanol–water (95:5, M/W, v/v) at 37°C for 6 h. Following neutralization with 10% acetic acid on ice, the solution was adjusted to 50% M/W and directly loaded onto a Sep-Pak tC18 cartridge column (Waters, Sep-Pak Vac 1cc, 100 mg resin) equipped with a glass syringe (10 ml) that was previously washed with methanol and pre-equilibrated with distilled water. The initial flow-through from the loading was collected and re-applied to the column to enhance recovery. The loaded column was washed with a total of 30 ml of water. GSLs were then eluted with 3 ml of methanol and dried under a nitrogen stream. Contaminants of free fatty acid resulting from saponification of glycerophospholipids were removed from GSLs by washing the dried GSLs with hexane. Preliminary analyses of control and patient fibroblast GSLs were performed by thin-layer chromatography (TLC) using the following solvent systems: C/M/W (60:35:8) for neutral GSLs; C/M/0.2% CaCl2 (55:45:10) for gangliosides; C/M/W (60:40:10) for GSL mixtures. Orcinol–H2SO4, resorcinol, Dittmer-Lester and Ninhydrin reagents were used for the detection of sugar, sialic acid, phosphate and amine group, respectively.
Release of glycoprotein glycans
O-linked glycans were released from protein powder by reductive β-elimination (63). Protein-rich powder from fibroblasts or zebrafish embryos (2–3 mg) was resuspended in a solution of 100 mm sodium hydroxide and 1 m sodium borohydride, and incubated for 18 h at 45°C. The reaction mixture was neutralized with 10% acetic acid on ice and then loaded onto a column of AG 50W-X8 cation-exchange resin (Bio-Rad) for desalting. The column run-through and a subsequent wash with three bed volumes of 5% acetic acid, both containing released glycans, were combined and lyophilized to dryness. To remove borate from the sample, a solution of 10% acetic acid in methanol was added and the sample was then dried under a stream of nitrogen gas at 37°; this was repeated for a total of five times. The sample was then resuspended in 5% acetic acid and loaded onto a C18 cartridge column (J.T. Baker Co., 100 mg resin) that was previously washed with acetonitrile and pre-equilibrated with 5% acetic acid. Flow-through from the column was collected after loading and the column was then washed with a total of 3 ml of 5% acetic acid. The flow-through and washes were combined and lyophilized.
N-linked glycans were released from tryptic/chymotryptic digests of protein powder by enzymatic digestion with PNGaseF (61). Between 2 and 3 mg of protein-rich powder was resuspended in 200 µl of trypsin buffer (0.1 M Tris–HCl, pH 8.2, containing 1 mm CaCl2) by sonication. After boiling for 5 min and cooling to room temperature, 25 µl of trypsin solution (2 mg/ml in trypsin buffer) and 25 µl of chymotrypsin solution (2 mg/ml in trypsin buffer) were added. Digestion was allowed to proceed for 18 h at 37°C before the mixture was boiled for 5 min. Insoluble material was removed by centrifugation, and the supernatant was removed and dried by vacuum centrifugation. The dried peptide/glycopeptide mixture was resuspended in 250 µl of 5% acetic acid (v/v) and loaded onto a Sep-Pak C18 cartridge column. The cartridge was washed with 10 column volumes of 5% acetic acid. Glycopeptides were eluted stepwise, first with 3 volumes of 20% isopropyl alcohol in 5% acetic acid and then with 3 volumes of 40% isopropyl alcohol in 5% acetic acid. The 20 and 40% isopropyl alcohol steps were pooled and evaporated to dryness. Dried glycopeptides were resuspended in 50 µl of 50 mm sodium phosphate buffer, pH 7.5 for digestion with PNGaseF. Following PNGaseF digestion for 18 h at 37°C, released N-linked glycans were separated from the peptide and enzyme by passage through a Sep-Pak C18 cartridge. The digestion mixture was adjusted to 5% acetic acid and loaded onto the Sep-Pak. The column run-through and an additional wash with three column volumes of 5% acetic acid, containing released glycans, were collected together and evaporated to dryness.
Glycosphingolipid analysis
Nanospray ionization mass spectrometry was performed on permethylated glycolipids. For MS of permethylated glycolipids in a positive ion mode, ∼0.4 nmol of permethylated total glycolipids were dissolved in 50 µl of 1 mm sodium acetate in methanol–water (1:1) for infusion into a linear ion trap mass spectrometer (Orbi-LTQ; Thermo Fisher Scientific, Waltham, MA, USA) using a nanoelectrospray source at a syringe flow rate of 0.40 µl/min and the capillary temperature set to 210°C (61,62,64,65). The instrument was tuned with a mixture of permethylated standard neutral GSLs or a mixture of permethylated gangliosides for positive ion mode. For fragmentation by collision-induced dissociation (CID) in MS/MS and MSn, a normalized collision energy of 30–35% was used.
Detection and relative quantification of the prevalence of individual glycolipids were accomplished using the total ion mapping (TIM) and neutral loss scan (NL scan) functionality of the Xcalibur software package version 2.0 (Thermo Fisher Scientific) as previously described (61). For TIM, the m/z range from 600 to 2000 was automatically scanned in successive 2.8 mass unit windows with a window-to-window overlap of 0.8 mass units, which allowed the naturally occurring isotopes of each glycolipid species to be summed into a single response, thereby increasing detection sensitivity. Most glycolipid components were identified as singly, doubly, and triply charged, sodiated species (M + Na) in positive mode. Peaks for all charge states were summed for quantification. Preliminary analysis demonstrated that the major fragment ions in CID MS/MS scans of glycolipid preparations correspond to the neutral loss of the ceramide moiety, leaving intact glycolipid oligosaccharide ions. Therefore, an MS workflow was defined for NL scans in which the highest intensity peak detected by full MS was subjected to CID fragmentation. If an MS/MS profile contained an ion with m/z equivalent to loss of the most prevalent ceramide moiety, MSn fragmentation was initiated. Following this data-dependent acquisition, the workflow returned to the full MS, excluded the parent ion just fragmented, and chose the peak of next highest intensity for the same MS/MS and MSn analysis.
Analysis of N- and O-linked glycans
Released N- and O-linked glycans were permethylated, dissolved in 1 mm sodium acetate in methanol–water (1:1) for infusion into the mass spectrometer. MS analysis was performed in positive ion mode. Detection and relative quantification of the prevalence of individual N- or O-linked glycans were accomplished by TIM analysis (61,63). For all glycan classes (N-linked, O-linked and GSL), glycan symbolic representations are consistent with the recommendations of the Glycobiology community, as described by Varki, et al. (www.ncbi.nlm.nih.gov/books/NBK1931/figure/ch1.f5/?report=objectonly).
Zebrafish strains and husbandry
Wild-type zebrafish obtained from Fish 2U (Gibsonton, FL) were maintained using standard protocols. Embryos were raised at 28.8°C and staged according to the criteria established by Kimmel (66). In some cases, 0.003% 1-phenyl-2-thiourea (PTU) was added to the growth medium to block pigmentation. Handling and euthanasia of fish for all experiments were carried out in compliance with a protocol approved by the University of Georgia's Institutional Animal Care and Use Committee.
Anti-sense morpholino injection and mRNA rescue of zebrafish embryos
Expression of st3gal5 was inhibited in developing zebrafish embryos using morpholino oligonucleotides (MOs) designed to target the 5′-untranslated region of the zebrafish st3gal5 message (5′-GGTTCCTCAACACCAAGTCCTCGGT). 1 nl of a 500 µm MO solution was injected into one-cell stage embryos, yielding a final concentration of 0.5 µm. This dose was chosen following a titration curve that ranged from 0.25 to 1 µm. Mass spectrometric analysis of 3 and 5 dpf (days post fertilization) embryos injected over this concentration range indicated that the 0.5 µm MO yielded the maximal decrease of GM3 ganglioside. Further, the apoptotic phenotype and biochemical features associated with the 0.5 µm dose were rescued with st3gal5 mRNA. Zebrafish st3gal5 was cloned by RT-PCR using primers designed to a GenBank deposited sequence (NM_199516.2) that had been annotated as the zebrafish st3gal5 ortholog. RNA was isolated from adult zebrafish brain using Trizol reagent (Invitrogen/Life Technologies, Grand Island, NY, USA) and cDNA subsequently generated using iScript cDNA Synthesis Kit (BioRad Laboratories, Hercules, CA, USA). The resulting 1.2 kb PCR product was TOPO TA cloned into pCRII (Invitrogen/Life Technologies) and ultimately sub-cloned by flanking EcoRI sites into pCS2+. The validity and orientation of clones were confirmed by PCR and sequencing. The E332K S&P patient mutation was introduced into a conserved region within the zebrafish st3gal5 with the Quick Change site directed mutagenesis kit (Stratagene, Clara, CA, USA). Capped mRNAs were generated using the Ambion (Invitrogen/Life Technologies) SP6 Message Machine kit and mRNA rescue experiments performed by sequential injection of st3gal5 MO and 150 pg of either WT or mutant st3gal5 mRNA.
Acridine orange and TUNEL staining
Acridine orange (Sigma, St. Louis, MO, USA) was diluted in 0.3× Dannieaus embryo medium to a final concentration of 5 µg/ml. Live 3 dpf embryos previously treated with PTU were dechorionated and placed in this solution for 30 min. They were subsequently washed multiple times over a 1 h period with Dannieaus medium and immediately observed and documented using the GFP optics on an Olympus SZ-16 fluorescent dissecting scope outfitted with Q-capture software and a Retiga 2000R color camera. TUNEL stains were performed using the TMR-Red In Situ Cell Death kit (Roche Applied Science, Indianapolis, IN, USA) with modest modifications to previously described protocols (67). Modifications included two different modes of permeabilization: embryos were treated either for 2 min on ice in a solution of 0.1% sodium citrate and 0.1% Triton X-100 or for 5 min at 37°C with 10 µg/ml proteinase K. Both the protocols yielded the same results. After washing several times with PBS, embryos were incubated with the reaction mixture. Embryos were deyolked and mounted on slides with the Prolong Gold mounting medium and TUNEL staining was assessed using an Olympus FV1000 laser scanning confocal microscope.
SUPPLEMENTARY MATERIAL
FUNDING
This work was supported, in part, by grants from the South Carolina Department of Disabilities and Special Needs (SCDDSN to C.E.S.) and the National Institutes of Health (NIGMS R01GM093937 to E.A. and M.P.; NIGMS P01GM085354 to M.T., R.S., and K.A.). Additionally, the authors acknowledge the support and access to instrumentation provided through grants from the National Center for Research Resources (P41RR018502) and the National Institute of General Medical Sciences (P41GM103490) of the National Institutes of Health.
Supplementary Material
ACKNOWLEDGEMENTS
Whole-exome sequencing was performed at the Beijing Genomics Institute, Shenzhen, China. Dedicated to the memory of Ethan Francis Schwartz (1996–1998), Giuseppe Coloca (1928–2008) and Carmela Romeo (1929–2010).
Conflict of Interest statement. None declared.
REFERENCES
- 1.Saul R.A., Wilkes G., Stevenson R.E. ‘Salt-And-Pepper’ pigmentary changes with severe mental retardation: a new neurocutaneous syndrome? Proc. Greenwood Genet., Ctr. 1983;2:6–9. [Google Scholar]
- 2.Schnaar R.L., Suzuki A., Stanley P. Glycosphingolipids. In: Varki A., Cummings R.D., Esko J.D., Freeze H.H., Stanley P., Bertozzi C.R., Hart G.W., Etzler M.E., editors. Essentials of Glycobiology. 2nd ed. Cold Spring Harbor, NY: 2009. [PubMed] [Google Scholar]
- 3.Schnaar R.L. Glycosphingolipids in cell surface recognition. Glycobiology. 1991;1:477–485. doi: 10.1093/glycob/1.5.477. [DOI] [PubMed] [Google Scholar]
- 4.Hakomori S.I. Cell adhesion/recognition and signal transduction through glycosphingolipid microdomain. Glycoconj. J. 2000;17:143–151. doi: 10.1023/a:1026524820177. [DOI] [PubMed] [Google Scholar]
- 5.Regina Todeschini A., Hakomori S.I. Functional role of glycosphingolipids and gangliosides in control of cell adhesion, motility, and growth, through glycosynaptic microdomains. Biochim. Biophys. Acta. 2008;1780:421–433. doi: 10.1016/j.bbagen.2007.10.008. [DOI] [PMC free article] [PubMed] [Google Scholar]
- 6.Probstmeier R., Pesheva P. I-type lectins in the nervous system. Prog. Neurobiol. 1999;58:163–184. doi: 10.1016/s0301-0082(98)00079-3. [DOI] [PubMed] [Google Scholar]
- 7.Moremen K.W., Tiemeyer M., Nairn A.V. Vertebrate protein glycosylation: diversity, synthesis and function. Nat. Rev. Mol. Cell Biol. 2012;13:448–462. doi: 10.1038/nrm3383. [DOI] [PMC free article] [PubMed] [Google Scholar]
- 8.Audry M., Jeanneau C., Imberty A., Harduin-Lepers A., Delannoy P., Breton C. Current trends in the structure-activity relationships of sialyltransferases. Glycobiology. 2011;21:716–726. doi: 10.1093/glycob/cwq189. [DOI] [PubMed] [Google Scholar]
- 9.Datta A.K., Paulson J.C. The sialyltransferase ‘sialylmotif’ participates in binding the donor substrate CMP-NeuAc. J. Biol. Chem. 1995;270:1497–1500. doi: 10.1074/jbc.270.4.1497. [DOI] [PubMed] [Google Scholar]
- 10.Rao F.V., Rich J.R., Rakic B., Buddai S., Schwartz M.F., Johnson K., Bowe C., Wakarchuk W.W., Defrees S., Withers S.G., Strynadka N.C. Structural insight into mammalian sialyltransferases. Nat. Struct. Mol. Biol. 2009;16:1186–1188. doi: 10.1038/nsmb.1685. [DOI] [PubMed] [Google Scholar]
- 11.Sohn H., Kim Y.S., Kim H.T., Kim C.H., Cho E.W., Kang H.Y., Kim N.S., Ryu S.E., Lee J.H., Ko J.H. Ganglioside GM3 is involved in neuronal cell death. FASEB J. 2006;20:1248–1250. doi: 10.1096/fj.05-4911fje. [DOI] [PubMed] [Google Scholar]
- 12.Chisada S., Yoshimura Y., Sakaguchi K., Uemura S., Go S., Ikeda K., Uchima H., Matsunaga N., Ogura K., Tai T., et al. Zebrafish and mouse alpha2,3-sialyltransferases responsible for synthesizing GM4 ganglioside. J. Biol. Chem. 2009;284:30534–30546. doi: 10.1074/jbc.M109.016188. [DOI] [PMC free article] [PubMed] [Google Scholar]
- 13.Fragaki K., Ait-El-Mkadem S., Chaussenot A., Gire C., Mengual R., Bonesso L., Beneteau M., Ricci J.E., Desquiret-Dumas V., Procaccio, et al. Refractory epilepsy and mitochondrial dysfunction due to GM3 synthase deficiency. Eur. J. Hum. Genet. 2013;21:528–534. doi: 10.1038/ejhg.2012.202. [DOI] [PMC free article] [PubMed] [Google Scholar]
- 14.Simpson M.A., Cross H., Proukakis C., Priestman D.A., Neville D.C., Reinkensmeier G., Wang H., Wiznitzer M., Gurtz K., Verganelaki A., et al. Infantile-onset symptomatic epilepsy syndrome caused by a homozygous loss-of-function mutation of GM3 synthase. Nat. Genet. 2004;36:1225–1229. doi: 10.1038/ng1460. [DOI] [PubMed] [Google Scholar]
- 15.Wang H., Bright A., Xin B., Bockoven J.R., Paller A.S. Cutaneous dyspigmentation in patients with ganglioside GM3 synthase deficiency. Am. J. Med. Genet. A. 2013;161:875–879. doi: 10.1002/ajmg.a.35826. [DOI] [PubMed] [Google Scholar]
- 16.Rakic B., Rao F.V., Freimann K., Wakarchuk W., Strynadka N.C., Withers S.G. Structure-based mutagenic analysis of mechanism and substrate specificity in mammalian glycosyltransferases: porcine ST3Gal-I. Glycobiology. 2013;23:536–545. doi: 10.1093/glycob/cwt001. [DOI] [PubMed] [Google Scholar]
- 17.Maccioni H.J., Quiroga R., Ferrari M.L. Cellular and molecular biology of glycosphingolipid glycosylation. J. Neurochem. 2011;117:589–602. doi: 10.1111/j.1471-4159.2011.07232.x. [DOI] [PubMed] [Google Scholar]
- 18.Maccioni H.J., Quiroga R., Spessott W. Organization of the synthesis of glycolipid oligosaccharides in the Golgi complex. FEBS Lett. 2011;585:1691–1698. doi: 10.1016/j.febslet.2011.03.030. [DOI] [PubMed] [Google Scholar]
- 19.Edvardson S., Baumann A.M., Muhlenhoff M., Stephan O., Kuss A.W., Shaag A., He L., Zenvirt S., Tanzi R., Gerardy-Schahn R., et al. West syndrome caused by ST3Gal-III deficiency. Epilepsia. 2013;54:e24–e27. doi: 10.1111/epi.12050. [DOI] [PubMed] [Google Scholar]
- 20.Hu H., Eggers K., Chen W., Garshasbi M., Motazacker M.M., Wrogemann K., Kahrizi K., Tzschach A., Hosseini M., Bahman I., et al. ST3GAL3 Mutations impair the development of higher cognitive functions. Am. J. Hum. Genet. 2011;89:407–414. doi: 10.1016/j.ajhg.2011.08.008. [DOI] [PMC free article] [PubMed] [Google Scholar]
- 21.Shevchuk N.A., Hathout Y., Epifano O., Su Y., Liu Y., Sutherland M., Ladisch S. Alteration of ganglioside synthesis by GM3 synthase knockout in murine embryonic fibroblasts. Biochim. Biophys. Acta. 2007;1771:1226–1234. doi: 10.1016/j.bbalip.2007.05.008. [DOI] [PubMed] [Google Scholar]
- 22.Li X.M., Momsen M.M., Brockman H.L., Brown R.E. Lactosylceramide: effect of acyl chain structure on phase behavior and molecular packing. Biophys. J. 2002;83:1535–1546. doi: 10.1016/S0006-3495(02)73923-4. [DOI] [PMC free article] [PubMed] [Google Scholar]
- 23.Sonnino S., Prinetti A., Nakayama H., Yangida M., Ogawa H., Iwabuchi K. Role of very long fatty acid-containing glycosphingolipids in membrane organization and cell signaling: the model of lactosylceramide in neutrophils. Glycoconj. J. 2009;26:615–621. doi: 10.1007/s10719-008-9215-8. [DOI] [PubMed] [Google Scholar]
- 24.Nagahori N., Yamashita T., Amano M., Nishimura S. Effect of ganglioside GM3 synthase gene knockout on the glycoprotein N-glycan profile of mouse embryonic fibroblast. Chembiochem. 2013;14:73–82. doi: 10.1002/cbic.201200641. [DOI] [PubMed] [Google Scholar]
- 25.Nairn A.V., York W.S., Harris K., Hall E.M., Pierce J.M., Moremen K.W. Regulation of glycan structures in animal tissues: transcript profiling of glycan-related genes. J. Biol. Chem. 2008;283:17298–17313. doi: 10.1074/jbc.M801964200. [DOI] [PMC free article] [PubMed] [Google Scholar]
- 26.Nairn A.V., Aoki K., dela Rosa M., Porterfield M., Lim J.M., Kulik M., Pierce J.M., Wells L., Dalton S., Tiemeyer M., Moremen K.W. Regulation of glycan structures in murine embryonic stem cells: combined transcript profiling of glycan-related genes and glycan structural analysis. J. Biol. Chem. 2012;287:37835–37856. doi: 10.1074/jbc.M112.405233. [DOI] [PMC free article] [PubMed] [Google Scholar]
- 27.Meuillet E., Cremel G., Dreyfus H., Hicks D. Differential modulation of basic fibroblast and epidermal growth factor receptor activation by ganglioside GM3 in cultured retinal Muller glia. Glia. 1996;17:206–216. doi: 10.1002/(SICI)1098-1136(199607)17:3<206::AID-GLIA3>3.0.CO;2-Z. [DOI] [PubMed] [Google Scholar]
- 28.Hanai N., Nores G.A., MacLeod C., Torres-Mendez C.R., Hakomori S. Ganglioside-mediated modulation of cell growth. Specific effects of GM3 and lyso-GM3 in tyrosine phosphorylation of the epidermal growth factor receptor. J. Biol. Chem. 1988;263:10915–10921. [PubMed] [Google Scholar]
- 29.Meuillet E.J., Mania-Farnell B., George D., Inokuchi J.I., Bremer E.G. Modulation of EGF receptor activity by changes in the GM3 content in a human epidermoid carcinoma cell line, A431. Exp. Cell Res. 2000;256:74–82. doi: 10.1006/excr.1999.4509. [DOI] [PubMed] [Google Scholar]
- 30.Rebbaa A., Hurh J., Yamamoto H., Kersey D.S., Bremer E.G. Ganglioside GM3 inhibition of EGF receptor mediated signal transduction. Glycobiology. 1996;6:399–406. doi: 10.1093/glycob/6.4.399. [DOI] [PubMed] [Google Scholar]
- 31.Song W.X., Vacca M.F., Welti R., Rintoul D.A. Effects of gangliosides GM3 and De-N-acetyl GM3 on epidermal growth factor receptor kinase activity and cell growth. J. Biol. Chem. 1991;266:10174–10181. [PubMed] [Google Scholar]
- 32.Yoon S.J., Nakayama K., Hikita T., Handa K., Hakomori S.I. Epidermal growth factor receptor tyrosine kinase is modulated by GM3 interaction with N-linked GlcNAc termini of the receptor. Proc. Natl Acad. Sci. USA. 2006;103:18987–18991. doi: 10.1073/pnas.0609281103. [DOI] [PMC free article] [PubMed] [Google Scholar]
- 33.Coskun U., Grzybek M., Drechsel D., Simons K. Regulation of human EGF receptor by lipids. Proc. Natl Acad. Sci. USA. 2011;108:9044–9048. doi: 10.1073/pnas.1105666108. [DOI] [PMC free article] [PubMed] [Google Scholar]
- 34.Tagami S., Inokuchi Ji J., Kabayama K., Yoshimura H., Kitamura F., Uemura S., Ogawa C., Ishii A., Saito M., Ohtsuka Y., et al. Ganglioside GM3 participates in the pathological conditions of insulin resistance. J. Biol. Chem. 2002;277:3085–3092. doi: 10.1074/jbc.M103705200. [DOI] [PubMed] [Google Scholar]
- 35.Wang P., Yang X., Wu P., Zhang J., Sato T., Yamagata S., Yamagata T. GM3 Signals regulating TNF-alpha expression are mediated by Rictor and Arhgdib in mouse melanoma B16 cells. Oncology. 2007;73:430–438. doi: 10.1159/000136801. [DOI] [PubMed] [Google Scholar]
- 36.Hynds D.L., Summers M., Van Brocklyn J., O'Dorisio M.S., Yates A.J. Gangliosides inhibit platelet-derived growth factor-stimulated growth, receptor phosphorylation, and dimerization in neuroblastoma SH-SY5Y cells. J. Neurochem. 1995;65:2251–2258. doi: 10.1046/j.1471-4159.1995.65052251.x. [DOI] [PubMed] [Google Scholar]
- 37.Sachinidis A., Kraus R., Seul C., Meyer zu Brickwedde M.K., Schulte K., Ko Y., Hoppe J., Vetter H. Gangliosides GM1, GM2 and GM3 inhibit the platelet-derived growth factor-induced signalling transduction pathway in vascular smooth muscle cells by different mechanisms. Eur. J. Cell Biol. 1996;71:79–88. [PubMed] [Google Scholar]
- 38.Saqr H.E., Walters J.D., Guan Z., Stokes B.T., Yates A.J. Gangliosides inhibit PDGF-induced signal transduction events in U-1242 MG human glioma cells. Neurochem. Res. 1995;20:1389–1395. doi: 10.1007/BF00992515. [DOI] [PubMed] [Google Scholar]
- 39.Hashiramoto A., Mizukami H., Yamashita T. Ganglioside GM3 promotes cell migration by regulating MAPK and c-Fos/AP-1. Oncogene. 2006;25:3948–3955. doi: 10.1038/sj.onc.1209416. [DOI] [PubMed] [Google Scholar]
- 40.Toledo M.S., Suzuki E., Handa K., Hakomori S. Cell growth regulation through GM3-enriched microdomain (glycosynapse) in human lung embryonal fibroblast WI38 and its oncogenic transformant VA13. J. Biol. Chem. 2004;279:34655–34664. doi: 10.1074/jbc.M403857200. [DOI] [PubMed] [Google Scholar]
- 41.Wang P., Wang X., Wu P., Zhang J., Sato T., Yamagata S., Yamagata T. GM3 Upregulation of matrix metalloproteinase-9 possibly through PI3K, AKT, RICTOR, RHOGDI-2, and TNF-A pathways in mouse melanoma B16 cells. Adv. Exp. Med. Biol. 2011;705:335–348. doi: 10.1007/978-1-4419-7877-6_16. [DOI] [PubMed] [Google Scholar]
- 42.Huang X., Li Y., Zhang J., Xu Y., Tian Y., Ma K. Ganglioside GM3 inhibits hepatoma cell motility via down-regulating activity of EGFR and PI3K/AKT signaling pathway. J. Cell. Biochem. 2013;114:1616–1624. doi: 10.1002/jcb.24503. [DOI] [PubMed] [Google Scholar]
- 43.Choi H.J., Chung T.W., Kang S.K., Lee Y.C., Ko J.H., Kim J.G., Kim C.H. Ganglioside GM3 modulates tumor suppressor PTEN-mediated cell cycle progression–transcriptional induction of p21(WAF1) and p27(kip1) by inhibition of PI-3K/AKT pathway. Glycobiology. 2006;16:573–583. doi: 10.1093/glycob/cwj105. [DOI] [PubMed] [Google Scholar]
- 44.Choi H.J., Chung T.W., Kim S.J., Cho S.Y., Lee Y.S., Lee Y.C., Ko J.H., Kim C.H. The AP-2alpha transcription factor is required for the ganglioside GM3-stimulated transcriptional regulation of a PTEN gene. Glycobiology. 2008;18:395–407. doi: 10.1093/glycob/cwn016. [DOI] [PubMed] [Google Scholar]
- 45.Garofalo T., Lenti L., Longo A., Misasi R., Mattei V., Pontieri G.M., Pavan A., Sorice M. Association of GM3 with Zap-70 induced by T cell activation in plasma membrane microdomains: GM3 as a marker of microdomains in human lymphocytes. J. Biol. Chem. 2002;277:11233–11238. doi: 10.1074/jbc.M109601200. [DOI] [PubMed] [Google Scholar]
- 46.Liu Y., Su Y., Wiznitzer M., Epifano O., Ladisch S. Ganglioside depletion and EGF responses of human GM3 synthase-deficient fibroblasts. Glycobiology. 2008;18:593–601. doi: 10.1093/glycob/cwn039. [DOI] [PubMed] [Google Scholar]
- 47.Bremer E.G., Hakomori S., Bowen-Pope D.F., Raines E., Ross R. Ganglioside-mediated modulation of cell growth, growth factor binding, and receptor phosphorylation. J. Biol. Chem. 1984;259:6818–6825. [PubMed] [Google Scholar]
- 48.Chung T.W., Kim S.J., Choi H.J., Kim K.J., Kim M.J., Kim S.H., Lee H.J., Ko J.H., Lee Y.C., Suzuki A., Kim C.H. Ganglioside GM3 inhibits VEGF/VEGFR-2-mediated angiogenesis: direct interaction of GM3 with VEGFR-2. Glycobiology. 2009;19:229–239. doi: 10.1093/glycob/cwn114. [DOI] [PubMed] [Google Scholar]
- 49.Garofalo T., Sorice M., Misasi R., Cinque B., Mattei V., Pontieri G.M., Cifone M.G., Pavan A. Ganglioside GM3 activates ERKs in human lymphocytic cells. J. Lipid Res. 2002;43:971–978. [PubMed] [Google Scholar]
- 50.Sorice M., Longo A., Garofalo T., Mattei V., Misasi R., Pavan A. Role of GM3-enriched microdomains in signal transduction regulation in T lymphocytes. Glycoconj. J. 2004;20:63–70. doi: 10.1023/B:GLYC.0000018018.29488.c6. [DOI] [PubMed] [Google Scholar]
- 51.Molotkovskaya I.M., Kholodenko R.V., Molotkovsky J.G. Influence of gangliosides on the IL-2- and IL-4-dependent cell proliferation. Neurochem. Res. 2002;27:761–770. doi: 10.1023/a:1020248722282. [DOI] [PubMed] [Google Scholar]
- 52.Sheikh K.A., Sun J., Liu Y., Kawai H., Crawford T.O., Proia R.L., Griffin J.W., Schnaar R.L. Mice lacking complex gangliosides develop Wallerian degeneration and myelination defects. Proc. Natl Acad. Sci. USA. 1999;96:7532–7537. doi: 10.1073/pnas.96.13.7532. [DOI] [PMC free article] [PubMed] [Google Scholar]
- 53.Yamashita T., Hashiramoto A., Haluzik M., Mizukami H., Beck S., Norton A., Kono M., Tsuji S., Daniotti J.L., Werth N., et al. Enhanced insulin sensitivity in mice lacking ganglioside GM3. Proc. Natl Acad. Sci. USA. 2003;100:3445–3449. doi: 10.1073/pnas.0635898100. [DOI] [PMC free article] [PubMed] [Google Scholar]
- 54.Yoshikawa M., Go S., Takasaki K., Kakazu Y., Ohashi M., Nagafuku M., Kabayama K., Sekimoto J., Suzuki S., Takaiwa K., et al. Mice lacking ganglioside GM3 synthase exhibit complete hearing loss due to selective degeneration of the organ of Corti. Proc. Natl Acad. Sci. U. S. A. 2009;106:9483–9488. doi: 10.1073/pnas.0903279106. [DOI] [PMC free article] [PubMed] [Google Scholar]
- 55.Niimi K., Nishioka C., Miyamoto T., Takahashi E., Miyoshi I., Itakura C., Yamashita T. Impairment of neuropsychological behaviors in ganglioside GM3-knockout mice. Biochem. Biophys. Res. Commun. 2011;406:524–528. doi: 10.1016/j.bbrc.2011.02.071. [DOI] [PubMed] [Google Scholar]
- 56.Nagafuku M., Okuyama K., Onimaru Y., Suzuki A., Odagiri Y., Yamashita T., Iwasaki K., Fujiwara M., Takayanagi M., Ohno I., et al. CD4 And CD8T cells require different membrane gangliosides for activation. Proc. Natl Acad. Sci. USA. 2012;109:E336–E342. doi: 10.1073/pnas.1114965109. [DOI] [PMC free article] [PubMed] [Google Scholar]
- 57.Zhang Z., Teng S., Wang L., Schwartz C.E., Alexov E. Computational analysis of missense mutations causing Snyder–Robinson syndrome. Hum. Mutat. 2010;31:1043–1049. doi: 10.1002/humu.21310. [DOI] [PMC free article] [PubMed] [Google Scholar]
- 58.Zhang Z., Wang L., Gao Y., Zhang J., Zhenirovskyy M., Alexov E. Predicting folding free energy changes upon single point mutations. Bioinformatics. 2012;28:664–671. doi: 10.1093/bioinformatics/bts005. [DOI] [PMC free article] [PubMed] [Google Scholar]
- 59.Hughes T.R., Mao M., Jones A.R., Burchard J., Marton M.J., Shannon K.W., Lefkowitz S.M., Ziman M., Schelter J.M., Meyer, et al. Expression profiling using microarrays fabricated by an ink-jet oligonucleotide synthesizer. Nat. Biotechnol. 2001;19:342–347. doi: 10.1038/86730. [DOI] [PubMed] [Google Scholar]
- 60.Churchill G.A. Fundamentals of experimental design for cDNA microarrays. Nat. Genet. 2002;32(Suppl):490–495. doi: 10.1038/ng1031. [DOI] [PubMed] [Google Scholar]
- 61.Aoki K., Perlman M., Lim J.M., Cantu R., Wells L., Tiemeyer M. Dynamic developmental elaboration of N-linked glycan complexity in the Drosophila melanogaster embryo. J. Biol. Chem. 2007;282:9127–9142. doi: 10.1074/jbc.M606711200. [DOI] [PubMed] [Google Scholar]
- 62.Nimrichter L., Burdick M.M., Aoki K., Laroy W., Fierro M.A., Hudson S.A., Von Seggern C.E., Cotter R.J., Bochner B.S., Tiemeyer M., et al. E-selectin receptors on human leukocytes. Blood. 2008;112:3744–3752. doi: 10.1182/blood-2008-04-149641. [DOI] [PMC free article] [PubMed] [Google Scholar]
- 63.Aoki K., Porterfield M., Lee S.S., Dong B., Nguyen K., McGlamry K.H., Tiemeyer M. The diversity of O-linked glycans expressed during Drosophila melanogaster development reflects stage- and tissue-specific requirements for cell signaling. J. Biol. Chem. 2008;283:30385–30400. doi: 10.1074/jbc.M804925200. [DOI] [PMC free article] [PubMed] [Google Scholar]
- 64.Anumula K.R., Taylor P.B. A comprehensive procedure for preparation of partially methylated alditol acetates from glycoprotein carbohydrates. Anal. Biochem. 1992;203:101–108. doi: 10.1016/0003-2697(92)90048-c. [DOI] [PubMed] [Google Scholar]
- 65.Vukelic Z., Zamfir A.D., Bindila L., Froesch M., Peter-Katalinic J., Usuki S., Yu R.K. Screening and sequencing of complex sialylated and sulfated glycosphingolipid mixtures by negative ion electrospray fourier transform ion cyclotron resonance mass spectrometry. J. Am. Soc. Mass. Spectrom. 2005;16:571–580. doi: 10.1016/j.jasms.2005.01.013. [DOI] [PubMed] [Google Scholar]
- 66.Kimmel C.B., Ballard W.W., Kimmel S.R., Ullmann B., Schilling T.F. Stages of embryonic development of the zebrafish. Dev. Dyn. 1995;203:253–310. doi: 10.1002/aja.1002030302. [DOI] [PubMed] [Google Scholar]
- 67.Robu M.E., Larson J.D., Nasevicius A., Beiraghi S., Brenner C., Farber S.A., Ekker S.C. P53 activation by knockdown technologies. PLoS Genet. 2007;3:e78. doi: 10.1371/journal.pgen.0030078. [DOI] [PMC free article] [PubMed] [Google Scholar]
Associated Data
This section collects any data citations, data availability statements, or supplementary materials included in this article.