Abstract
Near-infrared spectroscopy (NIRS) is a novel technology for low-cost noninvasive brain imaging suitable for use in virtually all subject and patient populations. Numerous studies of brain functional connectivity using fMRI, and recently NIRS, suggest new tools for the assessment of cognitive functions during task performance and the resting state (RS). We analyzed functional connectivity and its possible hemispheric asymmetry measuring coherence of optical signals at low frequencies (0.01-0.1 Hz) in the prefrontal cortex in 13 right-handed (RH) and 2 left-handed (LH) healthy subjects at rest (4-8 min) using a continuous-wave NIRS instrument CW5 (TechEn, Milford, MA). Two optical probes were placed bilaterally over the inferior frontal gyrus (IFG) and the middle frontal gyrus (MFG) using anatomical landmarks of the 10-20 system. As a result, 28 optical channels (14 for each hemisphere) were recorded for changes in oxygenated (HbO) and de-oxygenated (HbR) hemoglobin. Global physiological signals (respiratory and cardiac) were removed using Principal and Independent Component Analyses. Inter-channel coherences for HbO and HbR signals were calculated using Morlet wavelets along with correlation coefficients. Connectivity matrices showed specific patterns of connectivity which was higher within each anatomical region (IFG and MFG) and between hemispheres (e.g., left IFG <-> right IFG) than between IFG and MFG in the same hemisphere. Laterality indexes were calculated as t-values for the ‘left > right’ comparisons of intrinsic connectivity within each regional group of channels in each subject. Regardless of handedness, the group average laterality indexes were negative thus revealing significantly higher connectivity in the right hemisphere in the majority of RH subjects and in both LH subjects. The analysis of Granger Causality between hemispheres has also shown a greater flow of information from the right to the left hemisphere which may point to an important role of the right hemisphere in the resting state. These data encourage further exploration of the NIRS connectivity and its application for the analysis of hemispheric relationships within the functional architecture of the brain.
Keywords: Near-infrared spectroscopy, Brain hemodynamics, Functional connectivity, Resting state, Prefrontal cortex, Hemispheric asymmetry
1 Introduction
Near-infrared spectroscopy (NIRS) is a novel and promising technology for cost effective and noninvasive brain imaging in research and clinical practice. It has several unique features whose capabilities have not yet been fully explored. Using this technique, one can measure local changes in hemoglobin concentrations within cortical layers and, provided multiple channels are used, proceed to spatial image reconstruction for both oxygenated (HbO) and de-oxygenated forms of hemoglobin (Diffuse Optical Tomography). Thus, NIRS detects hemodynamic modulations as an indirect measure of neuronal activity conceptually similar to the blood oxygen level dependent (BOLD) functional magnetic resonance imaging (fMRI) signal. In addition to low cost and portability, NIRS provides an imaging method with reasonable spatial and excellent temporal resolution (as found in electrophysiological methods such as EEG and MEG) complementary to other imaging methods based on the hemodynamic response (fMRI and positron emission tomography, PET). With the advent of multi-channel and high density optical instruments, it also becomes possible to measure dynamic interactions between brain areas through temporal correlations of NIRS signals and therefore deriving a NIRS-based ‘functional connectivity’ similar to the functional connectivity measured by the fMRI BOLD signal (Friston et al., 1993).
Recent advances in brain functional network analysis provide new tools to study functional architecture of the brain. Evidence is emerging that this architecture is relatively stable during various cognitive tasks as well as the resting state. Numerous fMRI studies have confirmed that resting state networks (RSN) (De Luca et al., 2006) reflect interactions in cognitively relevant functional networks. Recent studies have also demonstrated that NIRS can be used to detect spontaneous hemodynamic fluctuations (Hoshi et al., 1998; Obrig et al., 2000; Toronov et al., 2000) and to assess regional connectivity through functionally relevant correlations within those fluctuations (White et al., 2009; Lu et al., 2010). Here, we explore the feasibility of analyzing RSNs within the left and right prefrontal cortex in the temporal and spectral domains measuring correlation of hemodynamic NIRS signals along with their coherence at low frequencies (0.01-0.1 Hz) in the resting state. In this report, we present preliminary data with the major goal to assess the applicability of noninvasive optical imaging as a tool for hemispheric lateralization of functional connectivity. In this study, we focused on temporal modulations of optical signals measuring correlation and coherence of those modulations within and between the investigated areas to study local and bilateral functional connectivity in the resting state.
2 Materials and methods
2.1 Participants
Thirteen right-handed and two left-handed young adults (six females, age 18-30, mean age 23) took part in the study after signing a consent form approved by the Georgetown University Institutional Review Board. All subjects reported as being in good health, having normal (or corrected to normal) vision and without medications. Before experiments, they undertook a battery of behavioral tests which included measures of IQ (Weschler Abbreviated Scale of Intelligence; the average IQ score 121.7) and handedness. During one or two separate experimental sessions lasting up to 40 min, they performed a rapid target detection task with simultaneous optical and EEG recording of brain activity as described earlier (Medvedev et al., 2010; Medvedev et al., 2011). Before and after the task, two minute segments of brain activity were recorded during the resting state when subjects were asked to sit in the dental chair quietly and relaxed avoiding thinking about anything specifically. For each 2-min segment, first half was recorded when subjects were asked to focus their gaze on the crosshair presented in the middle of a computer monitor (viewing distance of 75 cm) thus minimizing eye movements and the second half was recorded with their eyes closed. As a result, four or eight minutes of the resting state from each subject were taken into further analysis. The results related to task performance have been published elsewhere (Medvedev et al., 2010; Medvedev et al., 2011 and here we present the data related to the resting state.
2.2 Optical Data Collection
Optical signals were recorded using a continuous-wave NIRS instrument CW5 (TechEn, Milford, MA) with two 14 × 8-cm probes, each accommodating 11 optodes with three dual-wavelength (690 and 830 nm) laser sources and eight detectors for each hemisphere. The light sources and detectors of the CW5 instrument were connected to the subject’s head by flexible optical fiber bundles. Their front ends (optodes) were arranged on a supporting plastic base (‘optical probe’) which was placed on the head using anatomical landmarks provided by the international 10-20 system. Two such optical probes were placed bilaterally over the prefrontal areas between locations F3/4-F7/8-C3/4 thus covering the inferior frontal gyrus (IFG) and the middle frontal gyrus (MFG) (Fig 1). As a result, 28 optical channels (14 for each hemisphere) were recorded. During data preprocessing, respiratory and cardiac oscillations were removed using Independent Component Analysis and signals were pass band filtered between 0.01-0.1 Hz to target slow oscillations of the resting state networks.
Fig 1.
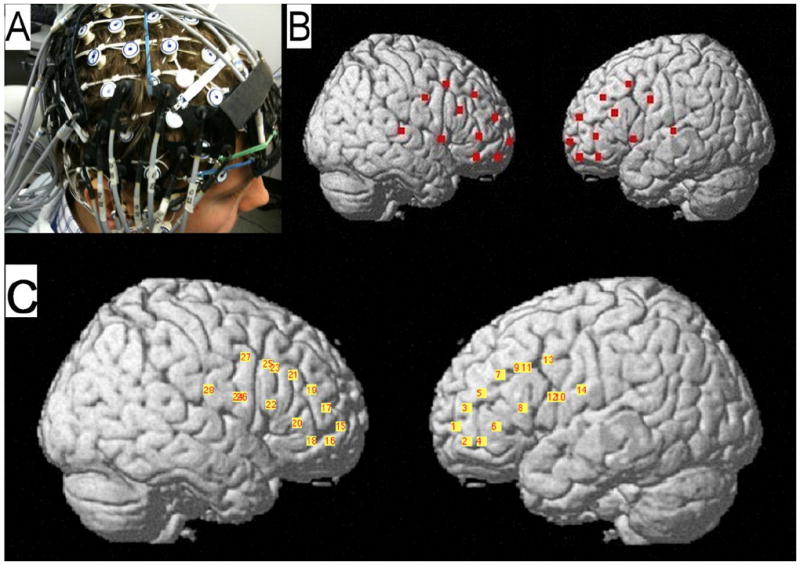
A: Optical probes positioned on top of the EEG sensor net. B: Positions of all optical fibers were digitally co-registered in reference to the standard locations of the 10-20 electrode placement system and then projected on the cortical surface using the NIRS-SPM toolbox (Ye et al., 2009). C: the locations of optical channels (defined as midpoints between the corresponding source and detector for each source-detector pair taken into analysis) and their numbers are shown.
2.3 Optical data analysis
After offline frequency demodulation, optical data were filtered <1 Hz, downsampled to 20 samples per second and stored on the acquisition computer for further analysis. The cutoff frequency of 1 Hz was used to reduce cardiac oscillations present in the optical signal. Independent Component Analysis (ICA) was performed and artifactual components generated by superficial layers (scalp and skull) as well as cardiac and respiratory signals were removed using the approach as described previously (Medvedev et al., 2008). After the ICA procedure, optical signals from all resting periods were combined and used to calculate relative changes in concentration of oxygenated (HbO) and deoxygenated (Hb) hemoglobin using the open-source software HOMer (Photon Migration Laboratory, Massachusetts General Hospital, MA; http://www.nmr.mgh.harvard.edu/PMI/resources/homer/home.htm). Hemodynamic activity for each source-detector pair is referred to as an ‘optical channel’ throughout.
Anatomical localization of optode positions has been described previously (Medvedev et al., 2011) and is briefly reviewed here. The standard locations Cz, C3, F3, F7 and T3 in the left hemisphere (and the corresponding locations in the right hemisphere) from the 10-20 system were determined for each individual subject by taking head measurements before experiments. Then a 128-channel EGI electrode sensor net was placed on subject’s head and the placement of the corresponding electrodes at the 10-20 locations was verified. Optical probes were positioned on top of the electrode net using electrodes C3/4, F3/4, F7/8 and T3/4 as reference points (Fig 1). F3/F4 electrodes have been shown to be located on left/right middle frontal gyrus, between posterior 1/3 and 1/2; while F7/F8 electrodes are located on pars triangularis of left/right inferior frontal gyrus (Kim et al., 2007). Taking this information into account and relating positions of optical fibers to the reference electrode positions, we assumed that source-detector pairs from the lower half of the left probe (i.e., s1-d2, s1-d4, s1-d6, s2-d4, s2-d6, s3-d6, s3-d8) reflect the activity of the left inferior frontal gyrus (IFG) while source-detector pairs from the upper half (i.e., s1-d1, s1-d3, s1-d5, s2-d3, s3-d5, s2-d7, s3-d7) reflect the activity of the left middle frontal gyrus (MFG) (Fig 1). Accordingly, the corresponding source-detector pairs from the lower/upper halves of the right probe were taken as reflecting the activities of the right IFG/MFG, respectively.
The typical frequency band used in the fMRI field to assess functional connectivity is 0.01-0.1 Hz because other bands are contaminated by noise and physiological artifacts such as respiratory- and cardiac-related fluctuations in oxygen supply (Glerean et al., 2012). We therefore bandpass filtered our signals within 0.01-0.1 Hz. We utilized a ‘seed-based’ approach to calculate functional connectivity which is commonly used in the fMRI field and based on correlations between the signal in the ‘seed’ voxel (or over a relatively small group of voxels) and all other voxels (Friston et al., 1993). However, we did not use a specific ‘seed’ channel and calculated correlations between all optical channels pairwise. First, pairwise correlation coefficients were calculated using the preprocessed raw data and the ‘corrcoef’ Matlab function (The Mathworks Inc., Natick, MA). Coefficients of correlation (here referred to as ‘correlations’) were calculated separately for oxy- and deoxygenated hemoglobin thus giving two separate measures of connectivity. Second, time-frequency decomposition of HbO and HbR signals was performed with the Morlet wavelets and power/coherence were also calculated for all pairwise channel combinations. Using original Matlab scripts, we calculated pairwise correlations/coherences between all optical channels in each subject and divided them into the following four groups: 1)-2) unilateral relationships (all pairwise correlations/coherences between channels within the IFG and channels within the MFG, separately for the left (1) and the right (2) hemispheres); and 3)-4) bilateral relationships (between all homologous channels within the left/right IFG (3) and the left/right MFG (4)). All correlations/coherences were subjected to Fisher’s z-transform (making their statistical distributions close to normal distributions).
We also analyzed functional connectivity by Granger causality (GC) applied to the whole time courses of activities in brain structures. Granger causality as a measure of connectivity has important advantages compared to the correlation or coherence methods. GC is a directed measure and provides directionality of connections estimating connections {1 ← 2} and {1 → 2} between structures 1 and 2 separately. The general concept of Granger causality is that signal 1 affects or influences signal 2 if information in the past of signal 1 better predicts signal 2 than the information from the past of signal 2 itself (Seth, 2009). For example, if causality {1 ← 2} is higher than {1 → 2}, this means a stronger functional influence from structure 2 on structure 1 and that the latter is being ‘led’ or ‘influenced’ by the former. Calculation of Granger Causality is based on multivariate autoregressive modeling (AR) of the signal. In the AR framework, the current value of a variable is represented as a linear combination of its own past p values (where p is the model order) plus the past values of all other variables plus additional uncorrelated noise. Using the error minimizing algorithms, the AR model can be solved and the coefficients of all linear combinations derived. From those coefficients, spectra of all variables as well as cross-spectra for all pairs of variables can be calculated. In addition, Granger Causality can be calculated in both temporal and spectral domains. In the latter case, the directed functional influence between signals can be determined at each frequency of interest. For AR modeling to be valid, certain assumptions about the signal such as stationarity should be satisfied. The optimal model order was selected using the Akaike Information Criteria (Akaike, 1974), model stationarity was checked by Augmented Dickey Fuller test and model validity and consistency were verified using the Durbin-Watson test for autocorrelated residuals as implemented in the Granger Causality Matlab toolbox (Seth, 2009) used in this study for all GC calculations.
Group statistical analysis was done by a three-way ANOVA test (p < 0.05) with regions of interest (left and right IFG, left and right MFG), gender and handedness as fixed effects. All statistical comparisons were made with correction for multiple comparisons using Dunn-Sidak’s algorithm Hochberg and Tamhane, 1987.
3 Results
3.1 Functional connectivity matrices
Spectra of hemodynamic signals during the resting state for both HbO and HbR showed a close to linear relationship between the log of spectral power and frequency with two weak peaks at 0.01-0.3 Hz and 0.07-0.1 Hz (Fig 2). This allowed us to consider the whole frequency range 0.01-0.1 Hz as more or less uniform and average coherence values over this range. Coherence values were averaged over frequencies 0.01-0.1 Hz as well as time resulting in coherence-based connectivity matrices for all pairs of optical channels. Similarly, connectivity matrices were generated using correlation coefficients. Both coherence and correlation matrices revealed qualitatively similar patterns of connectivity with clear regional clustering. In particular, connectivity was greater within and between specific areas giving the ‘checkerboard appearance’ to the grand average connectivity matrices (Fig 3). Thus, connectivity was higher within each anatomical region (IFG and MFG) and between homologous areas in both hemispheres (e.g., left IFG <-> right IFG) than between IFG and MFG in the same hemisphere (Fig 3). Because coherence-based connectivity gives similar results to the correlation method, we used coherence matrices for further analysis.
Fig 2.
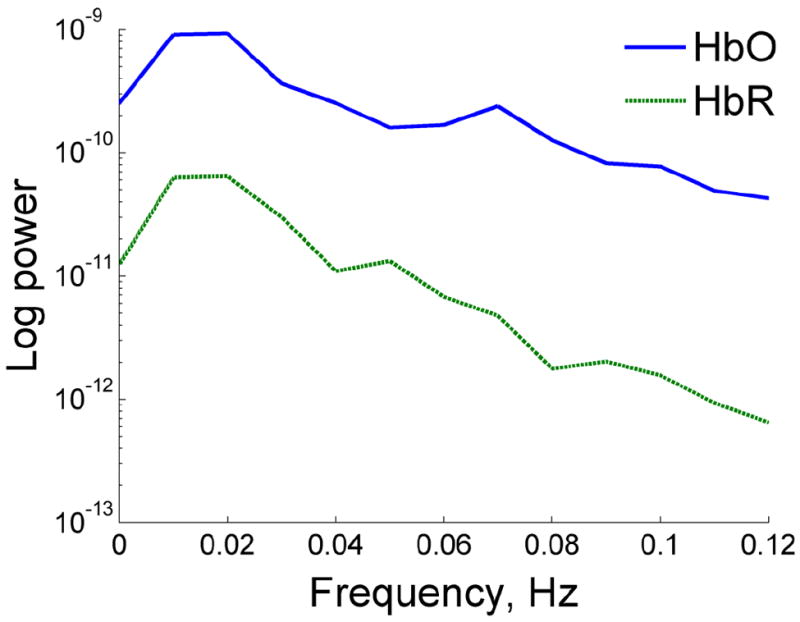
Spectra of hemodynamic activity in the resting state. Note peaks at 0.01-0.04 Hz and 0.07-0.1 Hz.
Fig 3.
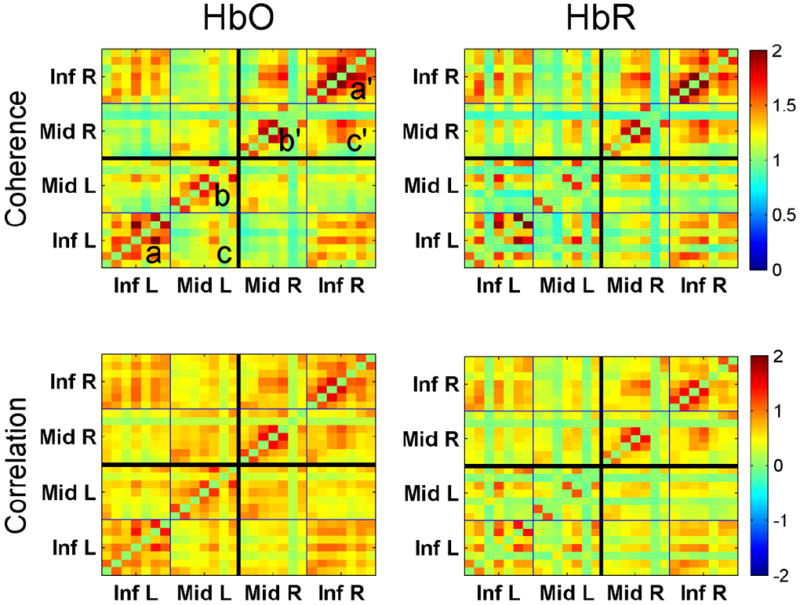
Group average connectivity matrices showing pairwise z-coherences (top panels) and correlations (bottom panels) for all channels. Coherence/correlation between channels v1 and v2 is represented by color at point with x-coordinate = v1 and y-coordinate = v2. Inf L and Inf R are left/right IFG, Mid L and Mid R are left/right MFG. Matrices are symmetrical along the main diagonal from bottom-left to top-right.
3.2 Laterality indices
To take into account regional clustering within connectivity matrices and to collapse data for group-wise statistical comparisons, we calculated regional Laterality Indices (LI) comparing ‘left-versus-right’ average coherence values within clusters using the following approach. The Laterality Indices were calculated as t-values for the ‘left > right’ comparisons for each regional cluster within the connectivity matrix in each subject and then the group analysis was done with ANOVA tests. The following regional clusters and their ‘left > right’ comparisons were considered: (1) ‘connectivity within Inf L’ > ‘connectivity within Inf R’ (cluster a > cluster a’ in Fig 3); (2) ‘connectivity within Mid L’ > ‘connectivity within Mid R’ (cluster b > cluster b’ in Fig 3); and (3) ‘connectivity between Inf L and Mid L’ > ‘connectivity between Inf R and Mid R’ (cluster c > cluster c’ in Fig 3). These three regional Laterality Indices were calculated separately for HbO and HbR thus giving six indices for group comparisons in the right- (RH) and left-handed (LH) groups (Fig 4). The ANOVA revealed significant effects of the regional cluster (F = 5.6, p < 0.0001) and handedness (F = 14.9, p < 0.0002) but no gender effect (F = 2.6, p < 0.1).
Fig 4.
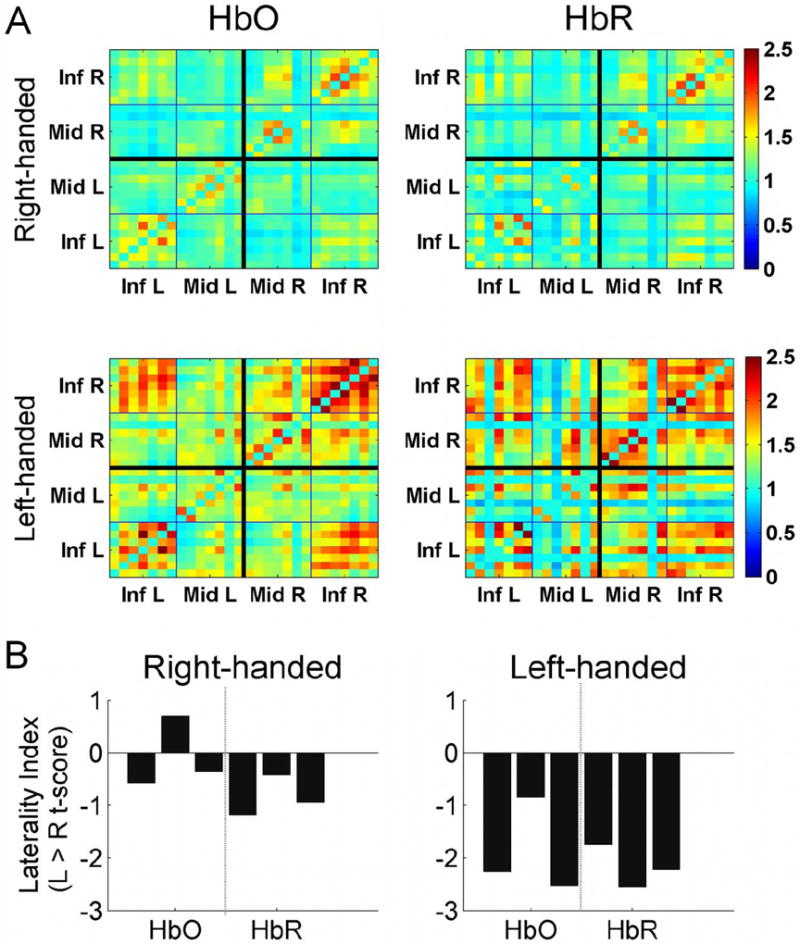
A: Group average connectivity matrices showing pairwise z-coherences for all channels for two groups of subjects (right- and left-handed). Note a stronger connectivity within the right hemisphere (top-right quadrants) in both groups. B: Group-average Laterality Indices (LI = t-values for L > R comparisons for connectivity within and between each anatomical region and each signal, HbO and HbR). Note a relatively weaker, but significant, rightward hemispheric asymmetry of connectivity in the right-handed group (LI < 0 at p < 0.05) and a stronger rightward asymmetry in the left-handed group (LI < 0 at p < 0.001; differences between groups are also significant at p < 0.01).
In the right-handed group, Laterality Indices were somewhat variable with still significantly higher connectivity in the right hemisphere in the majority of RH subjects (posthoc multiple comparison t-test, p < 0.05; Fig 4). Left-handed subjects showed highly negative Laterality Indices thus demonstrating a significantly greater hemispheric asymmetry (p < 0.001) with the dominance of the right hemisphere compared to the RH group (Fig 4).
3.3 Granger Causality
Granger Causality (GC) was specifically analyzed for the relationship between hemispheres. For this analysis, GC values were calculated for each optical channel and its counterpart in the opposite hemisphere (i.e., between homologous areas in the left and right hemispheres). These GC values were then averaged over all 14 optical channels in each hemisphere. Figure 5 represents the GC matrices averaged over all left-right channel pairs for each subject. Note a similar pattern of causality over all frequencies with slightly higher GC values at low frequencies 0.01-0.03 Hz (Fig 5). Such uniformity across frequencies 0.01-0.1 Hz allowed us to average the GC values over the whole frequency band for the group analysis which was done combining all subjects regardless of their handedness.
Fig 5.
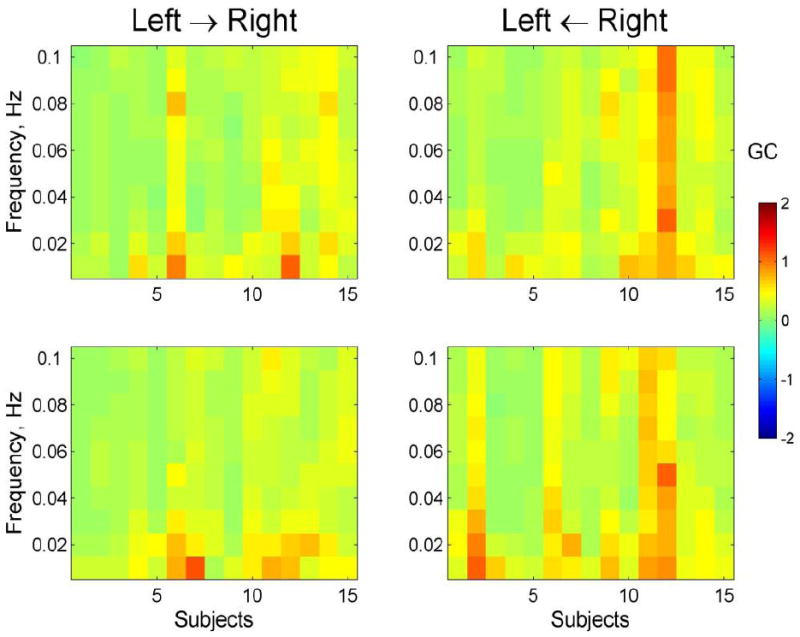
Granger Causality (GC) calculated for interhemispheric relationships (between homologous areas in left and right hemispheres) for frequencies 0.01-0.1 Hz. The graphs represent the GC matrices averaged over all 14 left-right channel pairs for each subject. Panels represent directed Granger causalities namely, from the left hemisphere to the right hemisphere (panels titled ‘Left → Right’) as well as in the opposite direction from the right hemisphere to the left (panels titled ‘Left ← Right’). Granger causality is a directed measure which allows for a separate analysis of how much signal 2 is dependent on signal 1 (1 → 2) as well as how much signal 1 is dependent on signal 2 (1 ← 2). Note a similar pattern of causality over all frequencies with slightly higher GC values at low frequencies 0.01-0.03 Hz.
Despite variations in the ‘left-versus-right’ relationships in individual subjects, the group analysis showed that Granger Causality was greater for the relationship ‘R → L’ than ‘L → R’ (Fig 6). The group difference was significant for oxygenated hemoglobin (paired t-test, p < 0.05) and de-oxygenated hemoglobin showed the same trend.
Fig 6.
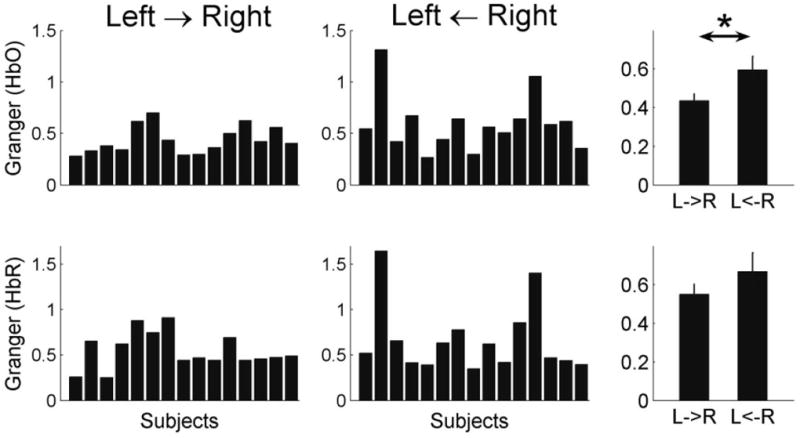
Interhemispheric Granger Causality averaged over all channels and frequencies 0.01-0.1 Hz for each subject. Group averaged values are shown in the right panels. Granger Causality was greater ‘from-the-right-to-the-left’ (i.e., left ← right) than ‘from-the-left-to-the-right’ (i.e., left → right). This difference was significant for the HbO signal (paired t-test, p < 0.05, the top-right panel) while the HbR signal also showed a similar trend.
4 Discussion
The present study used near-infrared spectroscopy to explore the temporal dynamics in the prefrontal cortex during the resting state. The major goal was to demonstrate the capability of optical imaging to delineate regional functional networks and more specifically, to explore the hemispheric lateralization (if any) of prefrontal intrinsic activity during the resting state. We measured connectivity in each hemisphere between inferior and middle frontal gyri (‘unilateral connectivity’) as well as connectivity between homologous structures of both hemispheres (‘bilateral connectivity’). While functional connectivity is commonly studied using fMRI, the studies of functional connectivity based on optical imaging are in their infancy due to limited head coverage in many NIRS instruments and the lack of standardized methods of analysis. Nevertheless, several groups has reported the use of NIRS for the assessment of functional connectivity (Rykhlevskaia et al., 2006; White et al., 2009; Zhang et al., 2010; Hu et al., 2013). The results demonstrate the feasibility of using NIRS for the analysis of resting state functional networks and that the hemodynamic modulations in the resting state as well as connectivity within and between functional networks can be effectively measured by optical methods. NIRS-based connectivity patterns correspond well to the anatomical and functional compartmentalization of the prefrontal cortex (namely, the inferior and middle frontal gyri). Thus, our study makes an important step extending the range of possible applications of the NIRS technology.
The current results demonstrate hemispheric asymmetry of functional connectivity in the resting state. Specifically, functional connectivity appeared to be stronger within the right – compared to the left – prefrontal cortex in both right-handed and left-handed individuals. The finding of the right-hemispheric ‘bias’ of connectivity in the right-handed participants motivated the inclusion of two left-handed subjects in the study. The left-handed subjects showed even greater right-hemispheric bias of connectivity although these data are obviously preliminary and should be confirmed in further experiments. Hemispheric asymmetry is a well established phenomenon and it is usually discussed in the context of specific behavioral (sensory, cognitive and motor) tasks. Its hemodynamic correlate is greater activation of the dominant hemisphere during those tasks usually measured by BOLD fMRI. However, hemispheric asymmetry regarding functional connectivity has not been studied comprehensively and is not well established yet for both active and resting states. We are aware of only a few imaging studies focusing on the laterality of connectivity. One of the first studies where laterality was assessed from intrinsic brain activity during passive fixation (one of the ‘eyes open’ variants of the resting state) has demonstrated that both leftward and rightward regional laterality can be observed across different brain systems depending on multiple factors including gender (Liu et al., 2009). In this study, brain asymmetry was shown to be more pronounced in males than in females. Relevant to our findings, the authors demonstrated that the inferior frontal gyrus was among the brain regions with rightward laterality (Liu et al., 2009). Yan et al. found significantly greater resting state connectivity in the cognitive division of anterior cingulate cortex in the right hemisphere of right-handed participants (Yan et al., 2009). Saenger et al. have studied resting state functional connectivity of the default mode network in both right- and left-handed groups of subjects and found various degrees of asymmetry (either leftward or rightward) in different brain regions (Saenger et al., 2012). Relevant to the current study, they found rightward functional asymmetries in the middle frontal and middle/superior temporal gyri in the right-handed group. Interestingly, asymmetries of functional connectivity were not accompanied by similar hemispheric differences in gray matter volume (measured by voxel-based morphometry) which again emphasizes the informative value of functional connectivity being not identical to the structural connectivity. In a recent study, Tomasi and Volkow have investigated laterality patterns of short-range (implicated in functional specialization) and long-range (implicated in functional integration) connectivity and the gender effects on these laterality patterns using a method of functional connectivity density mapping (Tomasi and Volkow, 2012). They found that short-range connectivity was rightward lateralized in areas around the lateral sulcus, whereas long-range connectivity was rightward lateralized in lateral sulcus and leftward lateralized in inferior prefrontal cortex and angular gyrus. However, males had greater rightward lateralization of brain connectivity in superior temporal (short- and long-range) and inferior frontal cortex. Although we have not found any gender effects on connectivity, our finding of rightward lateralization in the lateral prefrontal cortex is in line with all the studies cited above.
Electrophysiological studies also demonstrate brain functional asymmetry. For example, Thatcher et al. (2007) have explored cortical connectivity using current source correlations derived from the resting state EEG with source imaging LORETA software. The authors showed that, in general, the right hemisphere exhibited higher intrahemispheric source correlations than the left hemisphere. This study confirmed the earlier results based on surface EEG coherence which also found higher right versus left hemispheric coherence (Tucker et al., 1986). Thus, both electrophysiological and brain imaging studies provide converging evidence that functional connectivity is higher in the right hemisphere. These results are consistent with anatomical studies which indicate that the architecture of the left hemisphere favors more local processing within cortical regions whereas the right hemisphere is better wired for the integration of information across distant regions (for review, see Thatcher et al., 2007). Taken together, these data provide the anatomical and functional basis for the existing view that the left hemisphere is more involved in analytical and sequential processing while the right hemisphere is more involved in integration and synthesis of multimodal information (Kinsbourne, 1974).
In addition to the demonstration of higher functional connectivity in the right hemisphere by optical imaging, which is consistent with previous electrophysiological and imaging results, the current study found a ‘leading’ role of the right hemisphere in regard to the left hemisphere, as demonstrated by the higher ‘right-to-left’ Granger Causality (Fig 6). Does this mean that the left hemisphere is more ‘controlled’ by the right hemisphere in the resting state? Although the interpretation of this ‘leadership’ is yet unclear and requires confirmation and further exploration, the finding raises some intriguing questions. First, it should be noted that the resting state, as typically defined in the imaging studies, is somewhat an ambiguous state because the level of alertness is not well controlled. For the resting state, subjects are asked to be relaxed while sitting in the chair and avoid any specific task or focused thinking thus allowing the mind to ‘freely wander’. It is well known, that quite often during this state subjects do fall asleep experiencing brief episodes of nap (most likely, NREM sleep stages 1-2, which was confirmed in the current study by the analysis of concurrently recorded EEG where sleep spindles were occasionally noticed). Does this overlap of the resting state with the initial stages of sleep mean that during sleep-like states the interaction between hemispheres changes in favor of a more proactive role of the right hemisphere? It is tempting to speculate that this ‘leading’ role of the right hemisphere may point to its involvement in information processing thought to be specific to sleep such as post-processing, classifying, re-evaluation and storing of previously acquired information, the processes which eventually lead to the consolidation of new information into long-term memory traces. The right hemisphere may be well suited to such post-processing due to its broader connectivity spanning across different modalities, which may be beneficial for the formation of associative memories. We don’t know yet the relative roles of both hemispheres in those processes but the current finding encourages further studies of the role of both hemispheres and their relationship in different functional states including rest and various stages of sleep.
5 Conclusions
Our results demonstrate that functional connectivity can be measured by optical methods with high temporal resolution. Correlation analysis of optical signals provides sensitive measures of both local and long-distance functional connectivity in the resting state which can be used for lateralization and cortical mapping of brain processes in a variety of clinical applications. The results provide evidence for an important role of the right prefrontal cortex as a leading hub in the resting state. This may be in contrast to the ‘active’ states during specific cognitive tasks requiring activation of the dominant (left) hemisphere. Although our understanding of the brain processes during resting states (including nap and sleep) is still very limited, the current results point to a possible important role of the right hemisphere in these processes. These results encourage further exploration of the NIRS connectivity and its application for the analysis of hemispheric relationships within the functional architecture of the brain.
Highlights.
We measure resting state functional connectivity (RSFC) by optical imaging (NIRS).
Resting state connectivity is stronger in the right versus left prefrontal cortex.
Higher ‘right → left’ Granger Causality indicates a leading role of right hemisphere.
We suggest an important functional role of the right hemisphere in the resting state.
Acknowledgments
The project described was supported by awards R01EB006589 from the National Institute of Biomedical Imaging and Bioengineering, R21RR025786 from the National Center for Research Resources and R21GM103526 from the National Institute of General Medical Sciences. The content is solely the responsibility of the authors and does not necessarily represent the official views of the National Institutes of Health.
Footnotes
Publisher's Disclaimer: This is a PDF file of an unedited manuscript that has been accepted for publication. As a service to our customers we are providing this early version of the manuscript. The manuscript will undergo copyediting, typesetting, and review of the resulting proof before it is published in its final citable form. Please note that during the production process errors may be discovered which could affect the content, and all legal disclaimers that apply to the journal pertain.
References
- Akaike H. A new look at the statistical model identification. IEEE Trans Automatic Control. 1974;AC-19:716–723. [Google Scholar]
- De Luca M, Beckmann CF, De Stefano N, Matthews PM, Smith SM. fMRI resting state networks define distinct modes of long-distance interactions in the human brain. Neuroimage. 2006;29:1359–67. doi: 10.1016/j.neuroimage.2005.08.035. [DOI] [PubMed] [Google Scholar]
- Friston KJ, Frith CD, Liddle PF, Frackowiak RS. Functional connectivity: the principal-component analysis of large (PET) data sets. J Cereb Blood Flow Metab. 1993;13:5–14. doi: 10.1038/jcbfm.1993.4. [DOI] [PubMed] [Google Scholar]
- Glerean E, Salmi J, Lahnakoski JM, Jaaskelainen IP, Sams M. Functional magnetic resonance imaging phase synchronization as a measure of dynamic functional connectivity. Brain Connect. 2012;2:91–101. doi: 10.1089/brain.2011.0068. [DOI] [PMC free article] [PubMed] [Google Scholar]
- Hochberg Y, Tamhane AC. Multiple Comparison Procedures. Wiley; 1987. [Google Scholar]
- Hoshi Y, Kosaka S, Xie Y, Kohri S, Tamura M. Relationship between fluctuations in the cerebral hemoglobin oxygenation state and neuronal activity under resting conditions in man. Neurosci Lett. 1998;245:147–50. doi: 10.1016/s0304-3940(98)00197-9. [DOI] [PubMed] [Google Scholar]
- Hu XS, Hong KS, Ge SS. Reduction of trial-to-trial variability in functional near-infrared spectroscopy signals by accounting for resting-state functional connectivity. J Biomed Opt. 2013;18:17003. doi: 10.1117/1.JBO.18.1.017003. [DOI] [PubMed] [Google Scholar]
- Kim D, Kim SW, Joo EY, Tae WS, Choi SJ, Hong SB. Cortical localization of scalp electrodes on three-dimensional brain surface using frameless stereotactic image guidance system. Neurology Asia. 2007;12(Suppl. 1):84. [Google Scholar]
- Kinsbourne M. Mechanisms of hemisphere interaction in man. In: Kinsbourne M, Smith L, editors. Hemispheric Disconnection and Cerebral Function. Thomas; Springfield, IL: 1974. pp. 71–96. [Google Scholar]
- Liu H, Stufflebeam SM, Sepulcre J, Hedden T, Buckner RL. Evidence from intrinsic activity that asymmetry of the human brain is controlled by multiple factors. Proc Natl Acad Sci U S A. 2009;106:20499–503. doi: 10.1073/pnas.0908073106. [DOI] [PMC free article] [PubMed] [Google Scholar]
- Lu CM, Zhang YJ, Biswal BB, Zang YF, Peng DL, Zhu CZ. Use of fNIRS to assess resting state functional connectivity. J Neurosci Methods. 2010;186:242–9. doi: 10.1016/j.jneumeth.2009.11.010. [DOI] [PubMed] [Google Scholar]
- Medvedev AV, Kainerstorfer J, Borisov SV, Barbour RL, VanMeter J. Event-related fast optical signal in a rapid object recognition task: improving detection by the Independent Component Analysis. Brain Res. 2008;1236:145–158. doi: 10.1016/j.brainres.2008.07.122. http://dx.doi.org/10.1016/j.brainres.2008.07.122. [DOI] [PMC free article] [PubMed] [Google Scholar]
- Medvedev AV, Kainerstorfer JM, Borisov SV, Gandjbakhche AH, VanMeter J. “Seeing” EEG through the skull: imaging prefrontal cortex with fast optical signal. J Biomed Opt. 2010;15:061702. doi: 10.1117/1.3505007. [DOI] [PMC free article] [PubMed] [Google Scholar]
- Medvedev AV, Kainerstorfer JM, Borisov SV, VanMeter J. Functional connectivity in the prefrontal cortex measured by near-infrared spectroscopy during ultra-rapid object recognition. J Biomed Opt. 2011;16:016008. doi: 10.1117/1.3533266. [DOI] [PMC free article] [PubMed] [Google Scholar]
- Obrig H, Neufang M, Wenzel R, Kohl M, Steinbrink J, Einhaupl K, Villringer A. Spontaneous low frequency oscillations of cerebral hemodynamics and metabolism in human adults. Neuroimage. 2000;12:623–39. doi: 10.1006/nimg.2000.0657. [DOI] [PubMed] [Google Scholar]
- Rykhlevskaia E, Fabiani M, Gratton G. Lagged covariance structure models for studying functional connectivity in the brain. Neuroimage. 2006;30:1203–18. doi: 10.1016/j.neuroimage.2005.11.019. [DOI] [PubMed] [Google Scholar]
- Saenger VM, Barrios FA, Martinez-Gudino ML, Alcauter S. Hemispheric asymmetries of functional connectivity and grey matter volume in the default mode network. Neuropsychologia. 2012;50:1308–15. doi: 10.1016/j.neuropsychologia.2012.02.014. [DOI] [PubMed] [Google Scholar]
- Seth AK. A MATLAB toolbox for Granger causal connectivity analysis. J Neurosci Methods. 2009;186:262–73. doi: 10.1016/j.jneumeth.2009.11.020. [DOI] [PubMed] [Google Scholar]
- Thatcher RW, Biver CJ, North D. Spatial-temporal current source correlations and cortical connectivity. Clin EEG Neurosci. 2007;38:35–48. doi: 10.1177/155005940703800109. [DOI] [PubMed] [Google Scholar]
- Tomasi D, Volkow ND. Laterality patterns of brain functional connectivity: gender effects. Cereb Cortex. 2012;22:1455–62. doi: 10.1093/cercor/bhr230. [DOI] [PMC free article] [PubMed] [Google Scholar]
- Toronov V, Franceschini MA, Filiaci M, Fantini S, Wolf M, Michalos A, Gratton E. Near-infrared study of fluctuations in cerebral hemodynamics during rest and motor stimulation: temporal analysis and spatial mapping. Med Phys. 2000;27:801–15. doi: 10.1118/1.598943. [DOI] [PubMed] [Google Scholar]
- Tucker DM, Roth DL, Bair TB. Functional connections among cortical regions: topography of EEG coherence. Electroencephalogr Clin Neurophysiol. 1986;63:242–50. doi: 10.1016/0013-4694(86)90092-1. [DOI] [PubMed] [Google Scholar]
- White BR, Snyder AZ, Cohen AL, Petersen SE, Raichle ME, Schlaggar BL, Culver JP. Resting-state functional connectivity in the human brain revealed with diffuse optical tomography. Neuroimage. 2009;47:148–56. doi: 10.1016/j.neuroimage.2009.03.058. [DOI] [PMC free article] [PubMed] [Google Scholar]
- Yan H, Zuo XN, Wang D, Wang J, Zhu C, Milham MP, Zhang D, Zang Y. Hemispheric asymmetry in cognitive division of anterior cingulate cortex: a resting-state functional connectivity study. Neuroimage. 2009;47:1579–89. doi: 10.1016/j.neuroimage.2009.05.080. [DOI] [PubMed] [Google Scholar]
- Ye JC, Tak S, Jang KE, Jung J, Jang J. NIRS-SPM: statistical parametric mapping for near-infrared spectroscopy. Neuroimage. 2009;44:428–47. doi: 10.1016/j.neuroimage.2008.08.036. [DOI] [PubMed] [Google Scholar]
- Zhang YJ, Lu CM, Biswal BB, Zang YF, Peng DL, Zhu CZ. Detecting resting-state functional connectivity in the language system using functional near-infrared spectroscopy. J Biomed Opt. 2010;15:047003. doi: 10.1117/1.3462973. [DOI] [PubMed] [Google Scholar]


