
Figure 3.
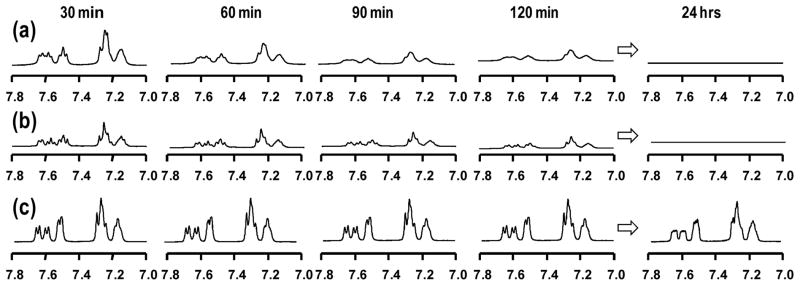
1H NMR spectra of peptides at different gelation time points. The signal in the range of 7.0–7.8 ppm is the aromatic proton signal from tryptophan in each peptide. (a) Gel A (P1 + P2); (b) Gel C (P1 + P4); (c) Gel D (P1 + P5).
Official websites use .gov
A
.gov website belongs to an official
government organization in the United States.
Secure .gov websites use HTTPS
A lock (
) or https:// means you've safely
connected to the .gov website. Share sensitive
information only on official, secure websites.
1H NMR spectra of peptides at different gelation time points. The signal in the range of 7.0–7.8 ppm is the aromatic proton signal from tryptophan in each peptide. (a) Gel A (P1 + P2); (b) Gel C (P1 + P4); (c) Gel D (P1 + P5).