
Figure 4.
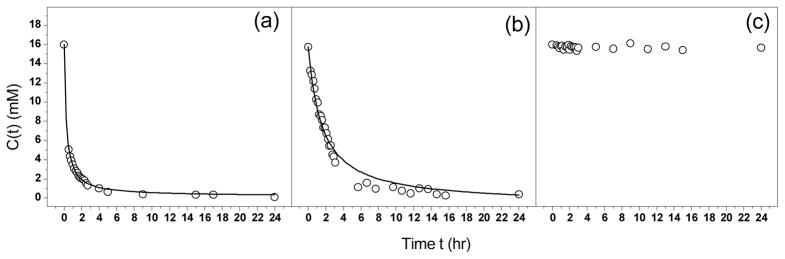
Peptide concentration C(t) vs. time t. (a) Gel A (P1 + P2); (b) Gel C (P1 + P4); (c) Gel D (P1 + P5). The curve in Gel A and Gel C represents fitting experimental data to Eqn. (6). For Gel A, keff = 1.03 mM−1s−1, Cmobile = 0.2mM, and R2 = 0.99. For Gel C, keff = 0.163 mM−1s−1, Cmobile = 0.2mM, and R2 = 0.98. R2 is the goodness of fitting.