Abstract
Heterogeneity is common among protein therapeutics. For example, the so-called acidic species (charge variants) are typically observed when recombinant monoclonal antibodies (mAbs) are analyzed by weak-cation exchange chromatography (WCX). Several protein post-translational modifications have been established as contributors, but still cannot completely account for all heterogeneity. As reported herein, an unexpected modification by methylglyoxal (MGO) was identified, for the first time, in a recombinant monoclonal antibody expressed in Chinese hamster ovary (CHO) cells. Modifications of arginine residues by methylglyoxal lead to two adducts (dihydroxyimidazolidine and hydroimidazolone) with increase of molecular weights of 72 and 54 Daltons, respectively. In addition, the modification by methylglyoxal causes the antibody to elute earlier in the weak cation exchange chromatogram. Consequently, the extent to which an antibody was modified at multiple sites corresponds to the degree of shift in elution time. Furthermore, cell culture parameters also affected the extent of modifications by methylglyoxal, a highly reactive metabolite that can be generated from glucose or lipids or other metabolic pathways. Our findings again highlight the impact that cell culture conditions can have on the product quality of recombinant protein pharmaceuticals.
Recombinant biotherapeutics are associated with an inherently increased level of structural complexity as compared to traditional small molecule drugs. Various protein post-translational modifications (PTM's) have been well documented as major contributors to heterogeneity in recombinant monoclonal antibodies 1-5. Some of these processes occur during fermentation, such as glycosylation and sialic acid incorporation; 6-8 while others can occur through purification, storage and even sample preparation, such as oxidation and disulfide bond scrambling9-10. Yet the known modifications still cannot explain all the variants.
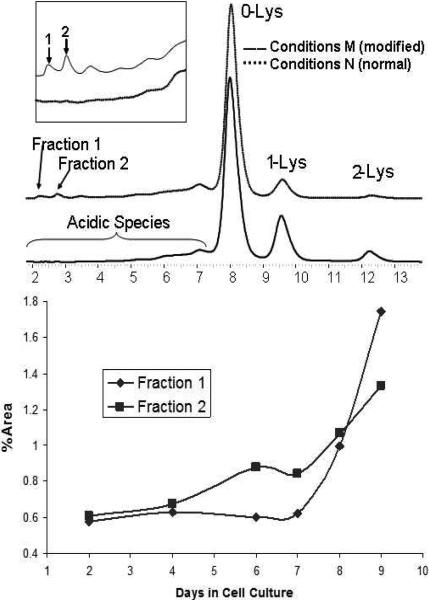
A group of extensively studied charge variants include the so-called acidic species that are observed when recombinant monoclonal antibodies are analyzed by weak-cation exchange (WCX) chromatography, see Figure 1. One major contributing factor is the removal of the C-terminal lysine of the heavy chain by cell-produced carboxypeptidease, reducing the overall positive charge 11; these variants are commonly referred to as Lys-0, Lys-1 and Lys-2 species. C-Terminal amidation 12 is another enzymatic process during fermentation. Spontaneous non-enzymatic transformations include the formation of pyroglutamate (Pyro-Glu) from an N-terminal glutamine (Gln) that removes the positive charge of the free N-terminus 13, and the deamidation of asparagine (Asn) to aspartic (Asp) or isoaspartic acid (isoAsp or isoD) that introduces negatively charged carboxylic acids 14-19. Other modifications without altering the formal charges can shift the retention time of an antibody on weak cation exchange chromatography, likely due to perturbation of local charge and conformation, such as incomplete glycosylation 20 and the presence of free cysteinyl thiols instead of disulfide10, 21. It is worth noting that some modifications are imparted by metabolites, such as glycation by glucose2, 22-23, methionine oxidation by reactive oxygen species (ROS)24, cysteinylation by cysteine 25, and N-homocysteinylation by homocysteine thiolactone26-27. Again, it is interesting to note that although many modifications have been reported; the observed heterogeneity of recombinant monoclonal antibodies on weak cation exchange chromatography still cannot be explained completely, suggesting more modifications are yet to be identified.
Figure 1.
The top panel is a typical WCX chromatogram of the recombinant monoclonal antibody after protein A purification (top and bottom traces were from cell culture M (modified) and N (normal), respectively, at day 9). The peaks labeled as Lys-0, Lys-1 and Lys-2 are antibody isoforms without the C-terminal Lys, with one C-terminal Lys and with two C-terminal Lys on the heavy chains, respectively. Peaks at 2.2 and 2.8 min were observed in antibody expressed in cell culture M and are denoted by Fractions 1 and 2, respectively, which are the focus of this study. The bottom panel shows the time dependence of the formation of these two species.
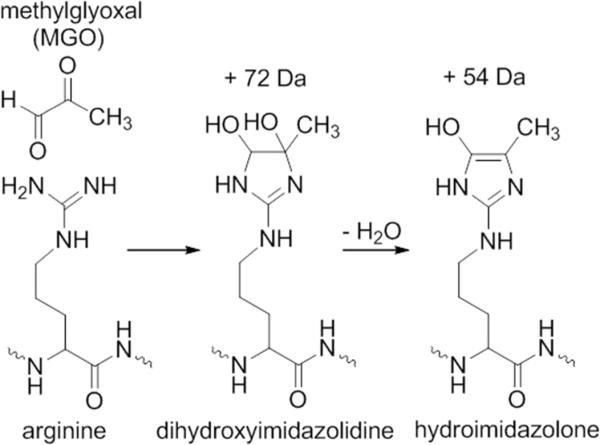
As report herein, we observed two well-defined acidic species under certain cell culture conditions. Detailed analyses have revealed that several arginine (Arg) residues were modified by methylglyoxal (MGO), further confirmed by comparing native antibody treated with authentic MGO. As illustrated in Scheme 1, the resulting dihydroxyimidazolidine and hydroimidazolone adducts increase molecular weights by 54 and 72 Daltons, respectively; these modifications cause the antibody to elute earlier in the weak cation exchange chromatogram. Consequently, the extent to which an antibody was modified at multiple sites corresponds to the degree of shift elution time. While protein modification by MGO is known in biology, our discovery is the first for a recombinant protein product. Furthermore, cell culture parameters also affect the extent of modifications by methylglyoxal, a highly reactive metabolite that can be generated from glucose, lipids or other metabolic pathways.
Scheme 1.
Chemical modification of arginine by methylglyoxal (MGO). The guanidine of the arginine side chain reacts with the dicarbonyls to form a dihydroxyimidazolidine with a mass increase of 72 Da, and the subsequent loss of water leads to a hydroimidazolone with a mass increase of 54 Da.
Materials and Methods
Materials
The recombinant monoclonal antibody was produced by stably transfected Chinese hamster ovary (CHO) cells cultured in a bioreactor and purified at AbbVie Bioresearch Center (Worcester, MA). Dithiothreitol (DTT) was from Sigma (St. Louis, MO). Acetonitrile and trifluoroacetic acid (TFA) were from J.T.Baker (Phillipsburg, NJ). Formic acid (FA) was from EMD (Gibbstown, NJ). Trypsin was from Worthington (Lakewood, NJ). Endoproteinase Lys-C was from Roche (Indianapolis, IN). Methylglyoxal was from MP Biomedicals (Solon, OH). Guanidine-HCl was from Thermo Scientific (Rockford, IL).
Weak cation exchange (WCX) chromatography
The antibody in low salt buffer was loaded onto a ProPac 4 × 250 mm WCX-10 column (Dionex, Sunnyvale, CA) at 94% mobile phase A (10 mM sodium phosphate, pH 7.5) and 6% mobile phase B (10 mM sodium phosphate and 500 mM sodium chloride, pH 5.5) at a flow-rate of 1 mL/min. The percentage of mobile phase B was increased from 6% to 16% over 20 min to elute the antibody monitored by UV absorbance at 280 nm. The column was then washed using 100% mobile phase B and then equilibrated using 6% mobile phase B for 9 minutes between injections. Fractionation was performed across the WCX-10 chromatogram. Distinct peaks were collected as individual fractions. The collected fractions were concentrated using Amicon Ultra-15 centrifugal filter with a molecular weight cut-off of 10 kDa (Millipore, Billerica, MA) and a table-top centrifuge operated at 4 °C.
LC-MS analysis of light and heavy chains of antibody
Light chain and heavy chain of the antibody from different fractions were analyzed using an HPLC (Agilent 1260, Santa Clara, CA) with a reversed phase column (Vydac, C4, 1 × 150 mm i.d., 5M particle size) coupled to a Q-TOF mass spectrometer (Agilent, 6510). Antibody was reduced using DTT (10 mM final concentration). Ten microliters of each sample was loaded at 95% mobile phase A (0.08% formic acid and 0.02% TFA in Milli-Q water) and 5% mobile phase B (0.08% formic acid and 0.02% TFA in acetonitrile) and then eluted using a gradient from 5% mobile phase B to 35% mobile phase B in 20 min. The column was washed using 90% mobile phase B and equilibrated using 5% mobile phase B for 10 min. The flow rate was 50 μL/min and column oven temperature was 60 °C. The mass spectrometer was operated in positive ion mode with a scan range from m/z 600 to 3200. Ion spray voltage was 4500 volts and the source temperature was 350 °C.
Tryptic and Lys-C digestion
Protein factions from WCX were denatured using 6 M guanidine hydrochloride in 100 mM Tris, pH 8.0 and reduced using 10 mM DTT at 37 °C for 30 min. Alkylation was performed using 25 mM iodoacetic acid at 37 °C for 30 min. The samples were buffer exchanged to 10 mM Tris pH 8.0 using NAP-5 columns (GE Healthcare, Piscataway, NJ). The samples were digested either with trypsin or Lys-C at 1:20 (w:w, enzyme:antibody) and incubated at 37 °C for 4 hours.
LC-MS analysis of peptides
A UPLC (Acquity, Waters, Milford, MA) equipped with a UPLC C18 reversed phase column (Waters, 1 × 150 mm i.d., 1.7μ particle size) and a Thermo Scientific LTQ-Orbitrap Velos mass spectrometer (Thermo Fisher, West Palm Beach, FL) were used to analyze peptide samples. Forty μL of each sample was loaded at 98% mobile phase A (0.08% formic acid and 0.02% TFA in Milli-Q water) and 2% mobile phase B (0.08% formic acid and 0.02% TFA in acetonitrile) and then eluted using a gradient from 2% mobile phase B to 35% mobile phase B in 80 min. The column was washed using 90% mobile phase B and equilibrated using 2% mobile phase B for 10 min. The flow rate was 50 μL/min and column oven temperature was 60 °C. The mass spectrometer was operated in positive ion mode with a scan range from m/z 400 to 2000 with alternating collision induced dissociation (CID) and hard collision dissociation (HCD) of the three most intense parent masses. Ion spray voltage was set at 4500 volts and the source temperature was set at 350 °C. The data was were analyzed by searching extracted mass traces of cleaved and subsequently miscleaved tryptic peptides containing peptides with mass increases of 54 and 72 Daltons. The data were also searched against the theoretical primary structure using the Sequest algorithm (Thermo Scientific, West Palm Beach, FL).
Methylglyoxal reaction with monoclonal antibody
Authentic methylglyoxal (MP Biomedical, Solon, OH) was incubated with the isoform of the recombinant monoclonal antibody without C-terminal Lys (denoted as Lys-0), collected from the WCX-10 chromatography. Lys-0 antibody at 1 mg/mL in 10 mM sodium phosphate at pH 7.0 was incubated with 2.8 mM methylglyoxal at 35 °C for 0, 1, 2, 3, 4 and 5 hours. Lys-0 antibody incubated under the same conditions without methylgloxal was used as a control. The samples were analyzed by WCX as described in the previous section. Peaks that appeared in the acidic region of the chromatogram in the sample treated with methylglyoxal for 2 hours were fractionated for further analysis as described for the samples from cell culture, and the data from the MGO spiking fractions and the cell culture fractions were compared.
Global Analysis of MGO Modification
Methylglyoxal can modify arginine, lysine and cysteine residues28-29. To this point, pertinent structures for potential modifications were searched for both manually and with the Sequest Algorithm (Thermo Scientific, West Palm Beach, FL) to understand the degree to which the antibody has been modified. Both lysine and arginine must be considered to result in mis-cleavages when trypsin is used as the digest agent. In contrast, modified cysteine residues will lie within a tryptic peptide, but its reactivity is hampered by the fact that all cysteines in a recombinant monoclonal antibody should be involved in disulfide bonds. Structures considered in the analysis are adducts of arginine (dihydroxyimidazolidine, hydroimidazolone and argpyrimidine), lysine (N-epsilon (1-carboxyethyl) lysine28, and cysteine (carboxyethyl cysteine)28-29.
Quantification of Modified Peptides
Quantification of MGO modified peptides was performed on endoprotease Lys-C generated peptides. Comparison of Lys-C peptides eliminates MGO-induced mis-cleavages allowing for direct quantification between the matching modified and unmodified peptides. These data were generated using the parameters outlined in the LC/MS analysis of peptides section discussed previously. Extracted mass chromatograms corresponding to Lys-C peptides encompassing identified MGO sites from the tryptic mapping experiments were compared for the native peptide and +54 and +72 Dalton increases. The integrated areas of the confirmed extracted ion chromatogram (EIC) peaks of the modified and native Lys-C peptides were used to quantify the percent of methyglyoxal modification at each of the susceptible sites.
Results and Discussion
New acidic species induced by changes in cell culture
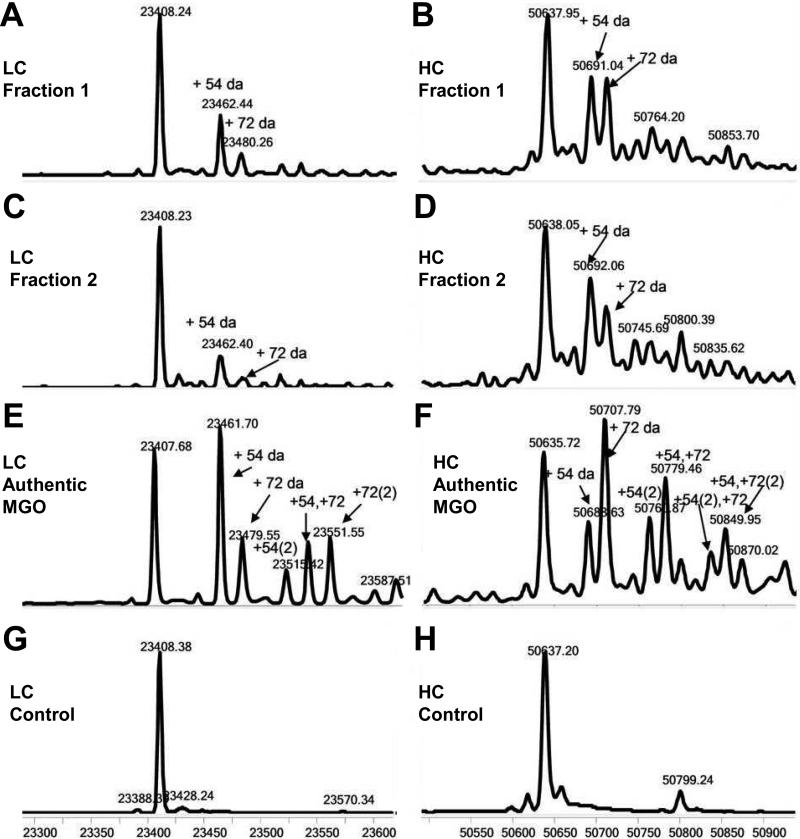
Under culture conditions M (modified), an increase in acidic species occurred during protein expression. In Figure 1, the weak cation exchange chromatogram shows two well-defined peaks with considerable shorter retention time than that of the main peak (Lys-0 isoform), which were absent under conditions N (normal). Although, it was determined later by a spiking study that after reduction, light chain with 2% modification of the 54 Da species can be detected and 5% modification can be unambiguously assigned, fractions were collected to enrich materials with such modifications. Each fraction was reduced to generate heavy chain and light chains, which were analyzed by LC/MS; the resulting mass spectra are shown in Figure 2. The molecular weight of 23408.24 Da for the major peak was in agreement with the theoretical molecular weight of 23408.13 Da for the light chain (LC) based on its amino acid sequence. In addition, two distinct peaks with molecular weights of 23462.44 Da and 23480.26 Da were also observed, corresponding to increases of approximately 54 Da and 72 Da over that for the native light chain. Moreover, a ladder of additional peaks with mass increase of 54 or 72 Da increments, albeit with lower intensity, was also observed, likely due to the same modifications occurring at multiple sites. A similar pattern of modifications was also observed for the heavy chain as shown in Figure 2. The major peak with a molecular weight of 50637.95 Da is in agreement with the theoretical molecular weight (50636.78 Da) of the heavy chain without the C-terminal Lys (Lys-0) and with a core-fucosylated biantenary complex oligosaccharide without the terminal galactose (G0F). Similar to the light chain, two additional peaks with molecular weights of 50692.06 Da and 50709.12 Da were also observed (Fraction 2), which are approximately 54 Da and 72 Da greater than the theoretical molecular weight. Again, the additional ladder of peaks with lower intensity are likely due to the same modification occurring at more than one site.
Figure 2.
Deconvoluted mass spectra of the light chain and heavy chains in fraction 1 (A and B) and fraction 2 (C and D). The theoretical molecular weight of the light chain is 23408.13 Da (observed 23408.24); 23462.44 and 23480.66 Da in Pane A represent increase of mass of 54 and 72 Da, respectively. The theoretical molecular weight of the heavy chain is 50636.78 Da (observed 50637.95); 50691.04 and 50710 Da represent increase of mass of 54 and 72 Da, respectively. In antibody treated by authentic MGO (2.7 mM, 5 h), a series of peaks with incremental mass increase of 54 and/or 72 were observed (see E and F). These additional peaks are absent from the control (G and H).
It is worth noting that these mass changes are not among the reported protein modifications in recombinant monoclonal antibodies. Additionally, searching ABRF Delta Mass database (www.abrf.org/index.cfm/dm.home) of common protein modifications did not yield plausible explanation for the observed mass increases of 54 Da or 72 Da either. Furthermore, it was not initially clear whether these two modifications were related. To elucidate the chemical nature and site of modifications, peptide mapping was carried out first to identify modified peptides.
Localization of the modification sites
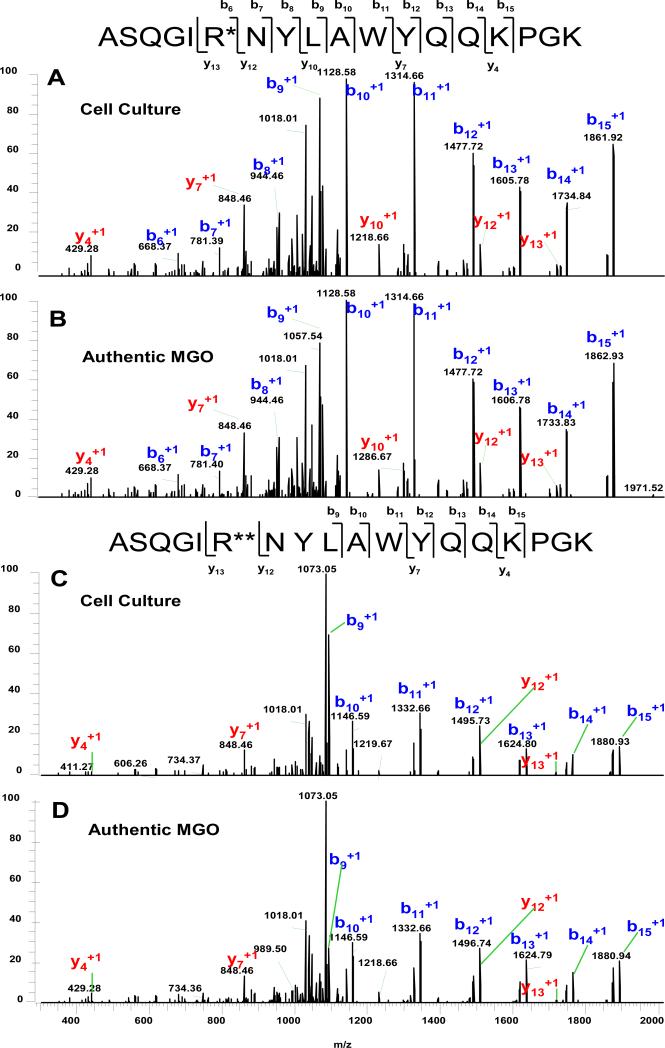
Peptide mapping was performed on fractions 1 and 2 in the weak cation exchange chromatogram. Initially, all theoretical tryptic peptides with mass increase of either 54 Da or 72 Da were manually searched but none were found. We surmised that the modifications might perturb proteolysis; hence, the manual search was expanded to tryptic peptides with one single mis-cleavage at either lysine or arginine, and several such peptides were observed. Two representative MS/MS spectra corresponding to the same peptide with +54 Da and +72 Da mass increase are shown in Figure 3. The internal arginine residue should be cleaved by trypsin but was not, suggesting it was likely modified. MS/MS was performed using an alternating fragmentation activation of CID performed in the ion trap and HCD performed in the collision cell to produce complimentary fragmentation spectra to provide better coverage. The major fragment ions in the spectra are from the b-ion series. A mass increase of 54 Da associated with b6 and b15-ions localized the modification to the first six amino acids that include the only arginine residue in this peptide. In addition to b-ions, several y-ions were also observed. Most important was that while the y12 ion showed the predicted mass of the unmodified peptide fragment, the y13 ion (refer to Figure 3, Pane A) displayed a mass increase of 54 Da thus confirming that the modification was on the arginine. Similarly, for light chain peptide T3 (a doubly charged precursor ion of m/z of 1090.5), a mass increase of 72 Da was associated with both b8 and b15 ions that localized the modification to the first eight amino acids. Again, the observation of y12 ion with the predicted mass and y13 ion with a mass increase of 72 Da confirmed that the modification was on the Arg residue (refer to Figure 3, Pane B).
Figure 3.
Representative MS/MS mass spectra ([1081.5]2+ at 31 min and [1090.5]2+ at 32 min, respectively) of peptides containing Arg residues modified by MGO forming a hydroimidazolone in cell culture (A and C) or from incubation with authentic methylglyoxal forming a dihydroxyimidazolidine (B and D). Modifications that resulted in the molecular weight increases of both 54 Da and 72 Da were localized to Arg based on the MS/MS fragmentation pattern. R* and R** denote the modified arginine by mass increases of 54 Da and 72 Da, respectively.
Deduction of the Structure of the Modification
Chemically reactive, arginine can be modified by a host of biological molecules and chemical reagents, the most common being carbonyls (aldehydes and ketones). The carbonyl-guanidyl adducts are formed via an initial addition mechanism (the mass of the adduct equals the combined mass of the carbonyl and arginyl peptide) and possibly a subsequent condensation (elimination of a water molecule of the initial addition adduct; thus, a further mass decrease of 18 Da). Based on these mechanisms, the molecules that modified arginine in our antibody should have an intact molecular weight of either 54 or 72 (54 +18) Da (for the +54 Da adduct), 72 or 90 (72+18) Da (for the +72 Da adduct). Furthermore, since both adducts were induced by changes in cell culture conditions, we surmised that one or more metabolites were the culprits. The following carbonyl molecules match the mass values: for 54 Da, 2-propynal; for 72 Da, methylglyoxal, malonaldehyde, glycidaldehyde, butanal and butanones; and for 90 Da, glyceraldehyde and dihydroxyacetone (glycerone). Methylglyoxal was our top candidates for the following considerations: (1) being a dicarbonyl, it forms fairly stable adducts with arginine; (2) production of methylglyoxal is known to be dependent on cell culture conditions30-34, reminiscing autoinducer-2 (AI-2, another dicarbonyl metabolite)35-37 and (3) the two adducts shown in Scheme 1 can account for both observed mass increase. A similar approach has been used to identify unknown protein crosslinking in an antibody38.
Incubation with Authentic MGO to generate reference
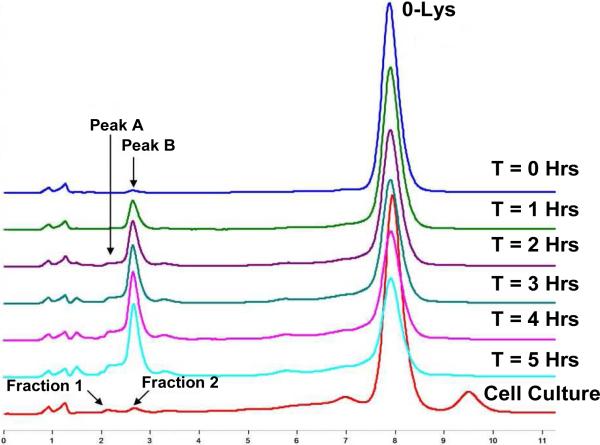
In order to confirm that the modification of the monoclonal antibody in cell culture was indeed by MGO, Lys-0 antibody shown in Figure 1 was isolated using weak cation exchange fractionation and was subsequently incubated with authentic MGO at 35 °C; then, the reaction products were analyzed by weak cation exchange chromatography. As shown in Figure 4, peaks corresponding to fractions 1 and 2 in the weak cation exchange chromatogram (labeled as Peaks A and B, respectively) increased with the prolonged incubation. In comparison, incubation of the Lys-0 fraction without MGO under the same conditions for the entire 5 hours did not result in any observable changes in peak profile (data not shown). Peaks A and B (Figure 4) were collected from the sample incubated for 2 hours using weak cation exchange chromatography and the samples were analyzed by LC-MS in the same manner as for the samples from cell culture. As shown in Figure 2 (panes E and F), peaks with molecular weights of 23462 Da and 23480 Da correspond to molecular weight increases of 54 Da and 72 Da, respectively, compared to theoretical molecular weight of 23408 Da for the light chain. Similarly, peaks with molecular weights of 50691 Da and 50709 Da with molecular weight increases of 54 Da and 72 Da, respectively, as compared to theoretical molecular weight of 50637 Da for the unmodified heavy chain were also observed. Additional ladders of peaks with increments of 54 and/or 72 Da were also observed, as for the samples from cell culture. Similar to other PTM's, formation of the initial MGO-adducts may alter protein conformation and dynamics, thus altering the kinetics of modifications at other sites. As a result, the formation of different adducts are interdependent, as indicated by the adduct distribution.
Figure 4.
WCX chromatogram of a purified Lys-0 antibody incubated with and without authentic MGO (2.8 mM at 35 °C) for various durations as labeled. The bottom trace shows the chromatogram of the antibody generated from cell culture. Acidic peaks derived from incubation with authentic MGO are labeled as Peak A and Peak B, respectively. The retention times of these peaks are in good agreement with Fraction 1 and Fraction 2 displayed in the bottom trace which are the subject of this study.
Comparison of the in vitro references and the cell culture samples
The peptide maps of the fractionated acidic species from the MGO spike in phosphate buffer and the corresponding cell culture acidic fractions were compared by LC/MS/MS. Modified tryptic peptides from both samples exhibit comparable retention times within the normal range of variation from run to run, e.g., 31.5 minutes and 32.3 minutes for 1081.5 [M+2H]2+ corresponding to the peptide with a mass increase of 54 Da and 1090.5 [M+2H]2+ corresponding to the peptide with a mass increase of 72 Da, respectively. In addition, MS/MS analyses indicated that the modification for both samples can be localized to the same arginine residues in both the cell culture derived antibody and the MGO stressed 0-Lys samples.
The MS/MS fragmentation patterns of the spectra from the antibody spiked with MGO in aqueous buffer and antibody modified during cell culture are shown in Figure 3 and are nearly identical; e.g., both spectra exhibit many b ions as well as some key y ions that allow conclusive localization of the modification as MGO-modified arginine.
Global Analysis of Modifications by MGO
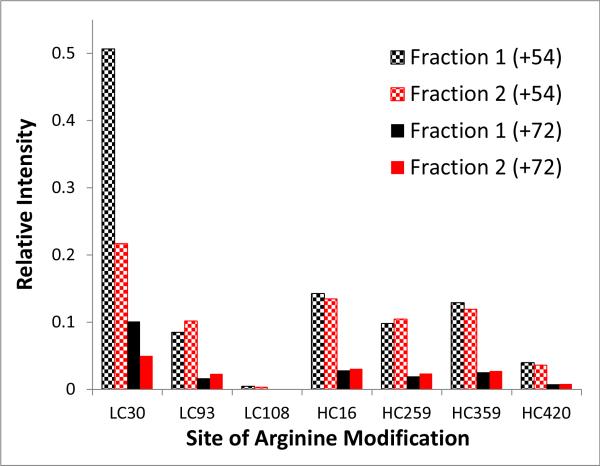
After MGO was confirmed to be responsible for the modifications at the site described above, the entire primary structure of the antibody was assessed for both the dihydroxyimidazolidine (+72 Da) and the hydroimidazolone (+54 Da) adducts. Several sites in both variable and conserved domains were identified. All modified peptides exhibited the modification at arginine residues and subsequently resulted in mis-cleavages. The distribution was quantitated based on endoprotease Lys-C digest analyzed by LC/MS/MS peptide mapping. Lys-C was chosen for it only cleaves at lysine but not at arginine or MGO-modified arginines, so peptide counterparts with and without MGO-modifications can be directly compared. The distribution and peak intensity of the modified arginine-containing peptides (both the +54 and +72 Da adduct) are shown in Figure 5. The differences are evident and likely to affect the elution behavior seen in the WCX chromatography.
Figure 5.
Peak intensity of all methylglyoxal-modified peptides generated by Lys-C digestion of fraction 1 (black) and fraction 2 (red), which are normalized to the peak intensity of the corresponding native (unmodified) peptides. The checkered bars represent the +54 Da adduct and the solid bars represent the +72 Da adduct.
MGO may also react with lysine resulting in Nε-(carboxyethyl)lysine with a mass increase of 72 Da39, but the reaction is considerably slower and the product much less stable than with arginine. A thorough examination for MGO modifications on lysine residues did not result in any matches, indicating the MGO modification is selective toward arginine under our conditions.
The majority of the modifications occur at the CDR region, which is more flexible than the other parts of the antibody. Arg30 of the light chain is particularly solvent accessible. These factors may contribute to its propensity for modification. Certainly, specific interactions with other residues, local environment and other factors may be involved as well 40-41.
Effects of MGO Modification on Charge
When an ionizable amino acid is chemically modified, its pKa value may be significantly perturbed. Using the Advanced Chemistry Development pKa prediction program accessed through SciFinder, the following values were obtained: guanidinium (12.55, experimental value), dihydroxyimidazolidine (7.13 +/− 0.6, calculated) and hydroimidazolone (6.93 +/− 0.4, calculated)42. The lower pKa values imparted by MGO modifications 43 translate to more acidic species, consistent with an earlier elution by weak cation exchange chromatography. Additionally, the steric bulkiness conferred by MGO modifications may also interfere with the stationary phase interaction and reduce the binding strength. Conformational changes are another possible contributor to changes in chromatographic behavior. To this point, we compared the charge envelopes of both modified and unmodified heavy and light chains obtained by mass spectrometry with respect to charge distribution44-45. No apparent differences were seen (data not shown), suggesting no major alteration in high-order structures.
Relevance to other Contributing Factors to Acidic Species
The observation of acidic species formation over time and at elevated pH and temperature is fairly well understood. Several studies have shown that asparagine deamidation to aspartate and isoaspartate introduces an additional negative charge on proteins 14-19, 46-47. The observation of an increase in acidic species occurring as the cell culture progresses appears to be due to something other than an increase in deamidation as all the samples underwent equivalent storage and the altered chromatograms differ from those generated in forced deamidation. Previously, some studies have shown that the introduction of a glycated lysine residue in a protein can result in an acidic shift seen in weak cation exchange chromatography by perturbing the charge on the protonated primary amine23. In many cases, however, these known modifications cannot fully explain all the acidic species. Our findings suggest that arginine modification by MGO should be considered.
Formation of MGO as a New Critical Attribute for Cell Culture
Complicated metabolic pathways for methylglyoxal exist in CHO cells. MGO can be formed enzymatically or non-enzymatically from glucose, e.g., the ene-diol intermediate of dihydroxyacetone phosphate (DHAP)30, 32, 48-49. Not surprisingly, many reports of protein modifications by methylglyoxal come from research related to diabetes in which blood glucose levels are elevated; and MGO may be involved in the formation of advanced glycation end products (AGEs). In addition, because of the high reactivity and toxicity of MGO, dedicated catabolic mechanisms also exist 48-51. Previous studies highlighted that cells have biochemical pathways to effectively remove methylglyoxal32. The glyoxalase pathway is a glutathione-mediated process which converts methylglyoxal to D-lactate by the glyoxylase I and glyoxylase II enzymes. In addition, MGO can be reduced to propanediol through the NADPH-dependant aldose reductase pathway. Indeed, Chaplen and coworkers have observed that methylglyoxal can accumulate in CHO cell cultures due to perturbed regulation in MGO metabolism30-34, 40.
Under our N (normal) and M (modified) conditions, no detectable differences in glucose levels were observed; but presumably, other difference did result in the accumulation of methylglyoxal. Changes in the flux of the glyoxalase pathway may be the cause of this unexpected appearance of methylglyoxal in the modified conditions. To the best of our knowledge, this is the first report of such a modification taking place in a CHO cell expression of a recombinant monoclonal antibody, affecting the quality of the protein products.
It is also important to consider that MGO not only affects the protein product being expressed, but also broadly affects many proteins in the host cells and possibly their biological functions. At the cellular level, vigor, viability, cell density and protein production yield may also be negatively affected. Conversely, elevated MGO formation also reflects a change in metabolic flex of competing pathways30, 32-33, 48-49, 51-53. In summary, MGO can be considered a biomarker of a less than optimal cell culture.
Conclusions
Triggered by changes in cell culture media, a new modification of a recombinant monoclonal antibody by methylglyoxal (MGO) was identified by a combination of weak cation exchange chromatography, peptide mapping and mass spectrometry. Modification by MGO, e.g., the corresponding mass increase of 54 Da and 72 Da for the arginine derivatives, should be considered when assessing heterogeneity in recombinant proteins. In addition, our finding serves as a reminder that other unreported modifications are likely to exist in protein pharmaceuticals. Furthermore, the results demonstrate the critical role of cell culture conditions and downstream processes in controlling product quality.
Supplementary Material
Acknowledgement
The authors thank Gary Welch, Li Malmberg, George Avgerinos and Ralph Lambalot for their support. This activity is partially supported by a grant from NIH NIGMS (R01GM101396 to ZSZ). This is contribution number 1034 from the Barnett Institute.
AbbVie disclosures:
The design, study conduct, and financial support for the study was provided by AbbVie (formerly the proprietary pharmaceutical division of Abbott Laboratories, now an independent biopharma company). AbbVie participated in the interpretation of data, review, and approval of the publication; all authors contributed to the development of the publication and maintained control over the final content. CC, KG, WL and CR are AbbVie employees. HL is a former employee of AbbVie. ZSZ serves as a PhD advisor to CC and has received AbbVie support for this role.
References
- 1.Awdeh ZL, Williamson AR, Askonas BA. Biochem J. 1970;116:241–8. doi: 10.1042/bj1160241. [DOI] [PMC free article] [PubMed] [Google Scholar]
- 2.Liu H, Gaza-Bulseco G, Faldu D, Chumsae C, Sun J. J. Pharm. Sci. 2008;97:2426–2447. doi: 10.1002/jps.21180. [DOI] [PubMed] [Google Scholar]
- 3.Vlasak J, Ionescu R. Curr. Pharm. Biotechnol. 2008;9:468–481. doi: 10.2174/138920108786786402. [DOI] [PubMed] [Google Scholar]
- 4.Manning M, Chou D, Murphy B, Payne R, Katayama D. Pharm. Res. 2010;27:544–575. doi: 10.1007/s11095-009-0045-6. DOI: 10.1007/s11095-009-0045-6. [DOI] [PubMed] [Google Scholar]
- 5.Walsh G. Post-translational Modification of Protein Biopharmaceuticals. Wiley; 2009. [DOI] [PubMed] [Google Scholar]
- 6.Mizuochi T, Taniguchi T, Shimizu A, Kobata A. J Immunol. 1982;129:2016–20. [PubMed] [Google Scholar]
- 7.Parekh RB, Dwek RA, Sutton BJ, Fernandes DL, Leung A, Stanworth D, Rademacher TW, Mizuochi T, Taniguchi T, Matsuta K, et al. Nature. 1985;316:452–7. doi: 10.1038/316452a0. [DOI] [PubMed] [Google Scholar]
- 8.Jefferis R. Biotechnol. Progr. 2005;21:11–16. doi: 10.1021/bp040016j. DOI: 10.1021/bp040016j. [DOI] [PubMed] [Google Scholar]
- 9.Wang Z, Rejtar T, Zhou ZS, Karger BL. Rapid Commun. Mass Spectrom. 2010;24:267–275. doi: 10.1002/rcm.4383. DOI: 10.1002/rcm.4383. [DOI] [PMC free article] [PubMed] [Google Scholar]
- 10.Zhang T, Zhang J, Hewitt D, Tran B, Gao X, Qiu ZJ, Tejada M, Gazzano-Santoro H, Kao Y-H. Anal. Chem. 2012;84:7112–7123. doi: 10.1021/ac301426h. DOI: 10.1021/ac301426h. [DOI] [PubMed] [Google Scholar]
- 11.Reed JH. J. Chromatogr. A. 1995;705:129–134. [Google Scholar]
- 12.Johnson KA, Paisley-Flango K, Tangarone BS, Porter TJ, Rouse JC. Anal. Biochem. 2007;360:75–83. doi: 10.1016/j.ab.2006.10.012. [DOI] [PubMed] [Google Scholar]
- 13.Moorhouse KG, Nashabeh W, Deveney J, Bjork NS, Mulkerrin MG, Ryskamp T. J. Pharm. Biomed. Anal. 1997;16:593–603. doi: 10.1016/s0731-7085(97)00178-7. [DOI] [PubMed] [Google Scholar]
- 14.Harris RJ, Kabakoff B, Macchi FD, Shen FJ, Kwong M, Andya JD, Shire SJ, Bjork N, Totpal K, Chen AB. Journal of Chromatography B: Biomedical Sciences and Applications. 2001;752:233–245. doi: 10.1016/s0378-4347(00)00548-x. [DOI] [PubMed] [Google Scholar]
- 15.Huang L, Lu J, Wroblewski VJ, Beals JM, Riggin RM. Anal. Chem. 2005;77:1432–1439. doi: 10.1021/ac0494174. [DOI] [PubMed] [Google Scholar]
- 16.Alfaro JF, Gillies LA, Sun HG, Dai S, Zang T, Klaene JJ, Kim BJ, Lowenson JD, Clarke SG, Karger BL, Zhou ZS. Anal. Chem. 2008;80:3882–3889. doi: 10.1021/ac800251q. DOI: 10.1021/ac800251q. [DOI] [PubMed] [Google Scholar]
- 17.Ni W, Dai S, Karger BL, Zhou ZS. Anal. Chem. 2010;82:7485–7491. doi: 10.1021/ac101806e. DOI: 10.1021/ac101806e. [DOI] [PMC free article] [PubMed] [Google Scholar]
- 18.Liu M, Cheetham J, Cauchon N, Ostovic J, Ni W, Ren D, Zhou ZS. Anal. Chem. 2011;84:1056–1062. doi: 10.1021/ac202652z. DOI: 10.1021/ac202652z. [DOI] [PubMed] [Google Scholar]
- 19.Dai S, Ni W, Patananan AN, Clarke SG, Karger BL, Zhou ZS. Anal. Chem. 2013;85:2423–2430. doi: 10.1021/ac303428h. DOI: 10.1021/ac303428h. [DOI] [PMC free article] [PubMed] [Google Scholar]
- 20.Gaza-Bulseco G, Bulseco A, Chumsae C, Liu H. J Chromatogr B Analyt Technol Biomed Life Sci. 2008;862:155–60. doi: 10.1016/j.jchromb.2007.12.001. Epub 2007 Dec 8. [DOI] [PubMed] [Google Scholar]
- 21.Ouellette D, Alessandri L, Chin A, Grinnell C, Tarcsa E, Radziejewski C, Correia I. Anal. Biochem. 2010;397:37. doi: 10.1016/j.ab.2009.09.027. [DOI] [PubMed] [Google Scholar]
- 22.Zhang B, Yang Y, Yuk I, Pai R, McKay P, Eigenbrot C, Dennis M, Katta V, Francissen KC. Anal. Chem. 2008;80:2379–2390. doi: 10.1021/ac701810q. [DOI] [PubMed] [Google Scholar]
- 23.Quan C, Alcala E, Petkovska I, Matthews D, Canova-Davis E, Taticek R, Ma S. Anal. Biochem. 2008;373:179–191. doi: 10.1016/j.ab.2007.09.027. [DOI] [PubMed] [Google Scholar]
- 24.Chumsae C, Gaza-Bulseco G, Liu H. Anal. Chem. 2009;81:6449–6457. doi: 10.1021/ac900815z. [DOI] [PubMed] [Google Scholar]
- 25.Ren D, Pipes G, Xiao G, Kleemann GR, Bondarenko PV, Treuheit MJ, Gadgil HS. J. Chromatogr. A. 2008;1179:198–204. doi: 10.1016/j.chroma.2007.11.088. DOI: 10.1016/j.chroma.2007.11.088. [DOI] [PubMed] [Google Scholar]
- 26.Zang T, Dai S, Chen D, Lee BWK, Liu S, Karger BL, Zhou ZS. Anal. Chem. 2009;81:9065–9071. doi: 10.1021/ac9017132. DOI: 10.1021/ac9017132. [DOI] [PMC free article] [PubMed] [Google Scholar]
- 27.Jakubowski H. Biomedicine & Pharmacotherapy. 2001;55:443–447. doi: 10.1016/s0753-3322(01)00085-3. DOI: 10.1016/s0753-3322(01)00085-3. [DOI] [PubMed] [Google Scholar]
- 28.Ahmed N, Thornalley PJ. Ann. N.Y. Acad. Sci. 2005;1043:260–266. doi: 10.1196/annals.1333.031. DOI: 10.1196/annals.1333.031. [DOI] [PubMed] [Google Scholar]
- 29.Mostafa A, Randell E, Vasdev S, Gill V, Han Y, Gadag V, Raouf A, El Said H. Mol. Cell. Biochem. 2007;302:35–42. doi: 10.1007/s11010-007-9422-9. DOI: 10.1007/s11010-007-9422-9. [DOI] [PubMed] [Google Scholar]
- 30.Kingkeohoi S, Chaplen FR. Cytotechnology. 2005;48:1–13. doi: 10.1007/s10616-005-1920-6. DOI: 10.1007/s10616-005-1920-6. [DOI] [PMC free article] [PubMed] [Google Scholar]
- 31.Chaplen FR, Fahl W, Cameron D. Cytotechnology. 1996;22:33–42. doi: 10.1007/BF00353922. DOI: 10.1007/bf00353922. [DOI] [PubMed] [Google Scholar]
- 32.Chaplen FWR, Fahl WE, Cameron DC. Proceedings of the National Academy of Sciences. 1998;95:5533–5538. doi: 10.1073/pnas.95.10.5533. [DOI] [PMC free article] [PubMed] [Google Scholar]
- 33.Chaplen FR. Cytotechnology. 1998;26:173–183. doi: 10.1023/A:1007953628840. DOI: 10.1023/a:1007953628840. [DOI] [PMC free article] [PubMed] [Google Scholar]
- 34.Van Herreweghe F, Mao J, Chaplen FWR, Grooten J, Gevaert K, Vandekerckhove J, Vancompernolle K. Proceedings of the National Academy of Sciences. 2002;99:949–954. doi: 10.1073/pnas.012432399. DOI: 10.1073/pnas.012432399. [DOI] [PMC free article] [PubMed] [Google Scholar]
- 35.Alfaro JF, Zhang T, Wynn DP, Karschner EL, Zhou ZS. Org. Lett. 2004;6:3043–3046. doi: 10.1021/ol049182i. DOI: 10.1021/ol049182i. [DOI] [PubMed] [Google Scholar]
- 36.Zhao G, Wan W, Mansouri S, Alfaro JF, Bassler BL, Cornell KA, Zhou ZS. Bioorg. Med. Chem. Lett. 2003;13:3897–3900. doi: 10.1016/j.bmcl.2003.09.015. DOI: http://dx.doi.org/10.1016/j.bmcl.2003.09.015. [DOI] [PubMed] [Google Scholar]
- 37.Biastoff S, Teuber M, Zhou Z, Dräger B. Planta Med. 2006;72:1136. doi: 10.1055/s-2006-947191. [DOI] [PubMed] [Google Scholar]
- 38.Liu M, Zhang Z, Zang T, Spahr C, Cheetham J, Ren D, Zhou ZS. Anal. Chem. 2013 doi: 10.1021/ac400666p. DOI: 10.1021/ac400666p. [DOI] [PMC free article] [PubMed] [Google Scholar]
- 39.Ahmed MU, Brinkmann Frye E, Degenhardt TP, Thorpe SR, Baynes JW. Biochem. J. 1997;324:565–570. doi: 10.1042/bj3240565. [DOI] [PMC free article] [PubMed] [Google Scholar]
- 40.Zhou ZS, Flohr A, Hilvert D. The Journal of Organic Chemistry. 1999;64:8334–8341. doi: 10.1021/jo991299a. DOI: 10.1021/jo991299a. [DOI] [PubMed] [Google Scholar]
- 41.Zhou ZS, Jiang N, Hilvert D. J. Am. Chem. Soc. 1997;119:3623–3624. DOI: 10.1021/ja963748j. [Google Scholar]
- 42.Gauthier MA, Klok H-A. Biomacromolecules. 2011;12:482–493. doi: 10.1021/bm101272g. DOI: 10.1021/bm101272g. [DOI] [PubMed] [Google Scholar]
- 43.Ahmed N, Dobler D, Dean M, Thornalley PJ. J. Biol. Chem. 2005;280:5724–5732. doi: 10.1074/jbc.M410973200. DOI: 10.1074/jbc.M410973200. [DOI] [PubMed] [Google Scholar]
- 44.Dobo A, Kaltashov IA. Anal. Chem. 2001;73:4763–4773. doi: 10.1021/ac010713f. DOI: 10.1021/ac010713f. [DOI] [PubMed] [Google Scholar]
- 45.Watt S, Sheil M, Beck J, Prosselkov P, Otting G, Dixon N. J. Am. Soc. Mass. Spectrom. 2007;18:1605–1611. doi: 10.1016/j.jasms.2007.06.004. DOI: 10.1016/j.jasms.2007.06.004. [DOI] [PubMed] [Google Scholar]
- 46.Perkins M, Theiler R, Lunte S, Jeschke M. Pharm. Res. 2000;17:1110–1117. doi: 10.1023/a:1026461830617. [DOI] [PubMed] [Google Scholar]
- 47.Chelius D, Rehder DS, Bondarenko PV. Anal. Chem. 2005;77:6004–6011. doi: 10.1021/ac050672d. [DOI] [PubMed] [Google Scholar]
- 48.Ahmed N, Thornalley PJ. Diabetes, Obesity and Metabolism. 2007;9:233–245. doi: 10.1111/j.1463-1326.2006.00595.x. DOI: 10.1111/j.1463-1326.2006.00595.x. [DOI] [PubMed] [Google Scholar]
- 49.Rabbani N, Thornalley PJ. Semin. Cell Dev. Biol. 2011;22:309–317. doi: 10.1016/j.semcdb.2011.02.015. DOI: http://dx.doi.org/10.1016/j.semcdb.2011.02.015. [DOI] [PubMed] [Google Scholar]
- 50.Hipkiss A. Biogerontology. 2012;13:633–636. doi: 10.1007/s10522-012-9401-8. DOI: 10.1007/s10522-012-9401-8. [DOI] [PubMed] [Google Scholar]
- 51.Saxena RK, Anand P, Saran S, Isar J, Agarwal L. Indian J. Microbiol. 2010;50:2–11. doi: 10.1007/s12088-010-0017-x. DOI: 10.1007/s12088-010-0017-x. [DOI] [PMC free article] [PubMed] [Google Scholar]
- 52.Matthews RG, Smith AE, Zhou ZS, Taurog RE, Bandarian V, Evans JC, Ludwig M. Helv. Chim. Acta. 2003;86:3939–3954. DOI: 10.1002/hlca.200390329. [Google Scholar]
- 53.Jack M, Wright D. Translational Research. 2012;159:355–365. doi: 10.1016/j.trsl.2011.12.004. DOI: http://dx.doi.org/10.1016/j.trsl.2011.12.004. [DOI] [PMC free article] [PubMed] [Google Scholar]
Associated Data
This section collects any data citations, data availability statements, or supplementary materials included in this article.


