

Version Changes
Updated. Changes from Version 1
I would like to thank Dr. Vandenberg for his comments and suggestions. We have submitted a new version of this article with a revised discussion section in which we take his suggestions into account.
Abstract
Background: The pore-forming subunit of the cardiac sodium channel, Na v1.5, has been previously found to be mutated in genetically determined arrhythmias. Na v1.5 associates with many proteins that regulate its function and cellular localisation. In order to identify more in situ Na v1.5 interacting proteins, genetically-modified mice with a high-affinity epitope in the sequence of Na v1.5 can be generated.
Methods: In this short study, we (1) compared the biophysical properties of the sodium current (I Na) generated by the mouse Na v1.5 (mNa v1.5) and human Na v1.5 (hNa v1.5) constructs that were expressed in HEK293 cells, and (2) investigated the possible alterations of the biophysical properties of the human Na v1.5 construct that was modified with specific epitopes.
Results: The biophysical properties of mNa v1.5 were similar to the human homolog. Addition of epitopes either up-stream of the N-terminus of hNa v1.5 or in the extracellular loop between the S5 and S6 transmembrane segments of domain 1, significantly decreased the amount of I Na and slightly altered its biophysical properties. Adding green fluorescent protein (GFP) to the N-terminus did not modify any of the measured biophysical properties of hNa v1.5.
Conclusions: These findings have to be taken into account when planning to generate genetically-modified mouse models that harbour specific epitopes in the gene encoding mNa v1.5.
Keywords: Cardiac sodium channel, Nav1.5, HEK293 cells, electrophysiology
Introduction
The voltage-gated cardiac sodium channel Na v1.5 is responsible for the initial phase of the cardiac action potential and plays a central role in cardiac impulse propagation 1. Its role in human disorders has been underlined by the findings of several hundred mutations in its gene, SCN5A, that are linked to inherited cardiac electrical disorders such as congenital long QT syndrome and Brugada syndrome 2. In recent years, it has been demonstrated that Na v1.5 interacts with and is regulated by different proteins (recently reviewed by Shy et al. 3). Many of these interacting proteins were also found to be mutated in patients with genetically-determined cardiac arrhythmias 4. The generation of genetically-modified mouse models, harbouring mutations in the Scn5a gene, has proven to be a very informative approach to investigate the various human phenotypes that are linked to the genetic variants of this gene 5. Since Na v1.5 interacts with many proteins during its life cycle in cardiac cells, it would be of great interest to generate a mouse model that permits the biochemical purification of Na v1.5 with high efficiency, hence allowing the co-purification of interacting proteins. The identity of these co-purified proteins may then be determined by using mass spectrometry-based technologies. In order to do this, one needs to first generate a knock-in mouse model, where a high-affinity epitope would be added to the mouse Scn5a gene that codes for Na v1.5.
The goals of this short study were (1) to compare the biophysical properties of the sodium current (I Na) generated by mouse Na v1.5 and human Na v1.5 constructs expressed in HEK293 cells, and (2) to investigate the possible alterations of the biophysical properties of human Na v1.5 constructs that were modified with specific epitopes. We used the common fluorescent GFP and YFP proteins as epitopes, which provide the advantage of being detectable without the use of antibodies. However, these tags can only be added to the N- and C-termini, which are both intracellular in Na v1.5, and which are thus, not easily accessible. Therefore, we additionally chose the FLAG-epitope (Sigma-Aldrich), which consists of a short sequence that can be inserted into the extracellular loops of Na v1.5. The results of these studies will have to be taken into account when planning the generation of a mouse line bearing an epitope-tagged Na v1.5 channel.
Methods
Transfection and culture of HEK293 cells
HEK293 cells (Robert S Kass laboratory, Columbia University, New York) were transfected by Lipofectamine LTX (Invitrogen) according to the manufacturer‘s instructions. The plasmids used were the 2019 amino acid isoform of the mouse voltage-gated sodium channel (pcDNA3-mNa v1.5; a gift from Thomas Zimmer, University of Jena, Germany 6), human Na v1.5 (pcDNA3.1-hNa v1.5), and three differently tagged hNa v1.5 (pcDNA3.1-hNa v1.5-GFP-N-terminal, pEYFP-hNa v1.5, and pcDNA3.1-FLAG(299/300)-hNa v1.5). The FLAG-tag is an eight amino acid-long epitope (DYKDDDDK) that was inserted previously (by Robert S Kass laboratory) into the extracellular loop linking the transmembrane segments S5 to S6 of domain I, between the residues Leu-299 and Val-300; GFP and YFP were previously added by T. Zimmer to the N-terminal 7. For wild-type and tagged hNa v1.5, 1 µg of one of the listed plasmids, 1 µg of empty pcDNA3.1 (Invitrogen), and 0.4 µg of DNA coding for CD8 (Robert S Kass laboratory) were used for transfection. In order to measure currents of comparable size, 0.01–1 µg of mNa v1.5 was co-transfected with 1 µg of empty pcDNA3.1, and 0.4 µg of DNA coding for CD8. Transfected HEK293 cells were then grown in Dulbecco's modified Eagle's medium (DMEM) (Gibco) with 10% calf serum (Gibco), 0.2% glutamine (Sigma), and 20 mg/ml gentamycin (Gibco), and incubated at 37°C with 95%O 2/5%CO 2.
Cellular electrophysiology
All experiments were performed in the whole-cell voltage-clamp mode. The extracellular solution contained (in mM): 50 NaCl, 80 NMDG-Cl, 5 CsCl, 2 CaCl 2, 1.2 MgCl 2, 10 HEPES, 5 Glucose, adjusted to pH 7.4 with CsOH, and with an osmolality of 280–290 mOsm. The internal solution consisted of (in mM): 70 CsAsp, 60 CsCl, 1 CaCl 2, 1 MgCl 2, 10 HEPES; 11 Cs 2EGTA, 5 Na 2ATP, adjusted to pH 7.2 with CsOH, and with an osmolality of 297 mOsm. Recordings were performed at room temperature (20–22°C) using a VE-2 amplifier (Alembic Instruments, Montreal, Canada). Data was acquired by Clampex 10.2 (Axon Instruments, Union City, Canada). Membrane resistance was ≥ 1 GΩ and access resistance ≤ 6.1 MΩ. Transfected cells were recognized by the addition of 1 µl/ml Dynabeads CD8 (Invitrogen) into the extracellular solution. Current-voltage (I/V) curves` were assessed by depolarising cells from a holding potential of -100 mV to voltages of between -80 and 40 mV during 20 ms. Steady-state inactivation properties were measured by the following protocol: the cells were kept at a holding potential of -100 mV and then hyper- and depolarised during 500 ms to voltages of between -120 and 0 mV in steps of 5 mV, followed by 20 ms at the voltage that elicited the maximal response during the I/V-protocol. Voltage-dependent activation was read either from the I/V- or the steady-state inactivation-protocol. To characterise the recovery from inactivation, the cells were depolarised from a holding potential of -100 mV for 100 ms, repolarised to -100 mV at a recovery time of 0.25–3000 ms, and depolarised again for 25 ms. By varying the time of the first depolarisation step from 3 to 3000 ms followed by 25 ms of repolarisation, the onset of slow inactivation was determined (see insets of Figure 2 and Figure 4).
Data analyses and statistics
Peak values for all protocols were detected and measured by Clampfit 10.2 and I/V-relationships were fitted using KaleidaGraph 3.5 (Synergy Software, Reading, USA). Values were normalised to membrane capacitance. The following formula was used to fit I/V-curves and to calculate reversal potentials: I Na = (G max(V-V rev,Na))/(1+e V-V0.5/K) with I Na = sodium current in pA, G max = max. conductance = 60 Ω -1, V rev,Na = reversal potential = 40 mV, K = (-zδF)/FR = equilibrium constant = -5, V 0.5 = voltage for 50% of maximum current = -20 mV. Activation and inactivation curves were fitted with the Boltzmann equation f 0 = 1/(1+ e V-V0.5/K) with f 0 = fraction of open channels/total available channels. Statistical analyses were performed using two-tailed Student's t-tests. A p value <0.05 was considered statistically significant.
Results
Electrophysiological properties of human and mouse Na v1.5 are comparable
To compare the biophysical properties of the cardiac sodium channel Na v1.5 from the human (hNa v1.5) or the mouse sequence (mNa v1.5), we measured the electrophysiological properties of hNa v1.5 and mNa v1.5, transiently expressed in HEK293 cells. Representative I Na recordings are shown in Figure 1. The responses to all applied protocols revealed similar characteristics for both channels, except for the reversal potential and the slope of steady-state inactivation ( Figure 2 and Table 1). The peak currents from the I/V-protocol were at -15 mV for both channels ( Figure 2A). Furthermore, activation and inactivation of 50% of the channels occurred for both channels at ~-28 mV and ~-71 mV, respectively. In addition, the slopes of the activation curve were comparable for both channels (6.00 mV/e-fold in human and 6.24 mV/e-fold in mouse). Significant differences could be detected in the reversal potential V rev (51.0 mV and 56.6 mV, P<0.01) and in the slope of the inactivation curve (5.95 mV/e-fold and 6.67 mV/e-fold, P<0.01) ( Figure 2B). In addition, mNa v1.5 had a tendency to recover faster from inactivation ( Figure 2C). The fraction of channels entering into a slow inactivation state was similar for both channel types ( Figure 2D).
Figure 1. Representative I Na recordings following the current voltage (I/V)-protocol described in the Methods.

( A) Voltage-dependent currents measured for hNa v1.5 expressed in a HEK293 cell. ( B) Data from the same protocol for mNa v1.5.
Figure 2. Electrophysiological properties of human and mouse Na v1.5.
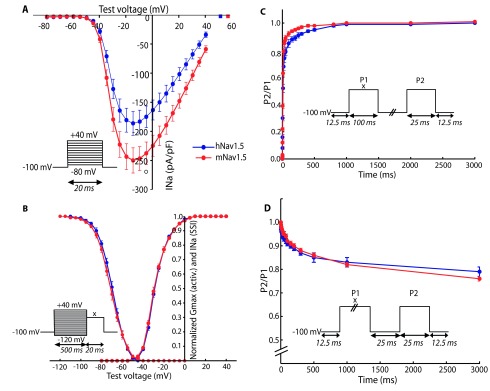
The voltage-clamp protocols used are shown in the corresponding insets. For B–D, the voltage x was adjusted to the voltage that elicited maximum current during the current voltage (I/V)-protocol (-10 to -30 mV). ( A) I/V-protocol for assessment of reversal potentials. Peak currents were measured for both channels at -15 mV. Calculated reversal potentials are marked with square data points. ( B) Voltage-dependence of activation and steady-state inactivation (SSI). The data was fitted with the Boltzmann formula. Only the slope of the inactivation curve differs between mouse and human sodium channels (shallower in mNa v1.5). ( C) Recovery from inactivation. The duration between the depolarising steps was varied from 0.25 to 3000 ms. mNa v1.5 had a slight tendency to recover faster than hNa v1.5. ( D) Onset of slow inactivation. The duration of the first step was varied from 0.25 to 3000 ms. The relative number of channels entering slow inactivation is similar for both types. ( A–B) n(hNa v1.5) = 22, n(mNa v1.5) = 17. ( C–D) n(hNa v1.5) = 9, n(mNa v1.5) = 7. **P<0.01 obtained by two-tailed Student's t-tests; error bars indicate standard errors.
Table 1. Summarized properties of human and mouse Na v1.5.
Data was obtained with current voltage (I/V)- and steady-state inactivation protocols. Mean values and standard errors are shown. **P<0.01 obtained by two-tailed Student's t-tests.
| hNa v1.5 | mNa v1.5 | ||
|---|---|---|---|
| mean ± sem | mean ± sem | ||
| I/V | V rev (mV) | 51.0 ± 0.9 | **56.6 ± 0.8 |
| Activation | V 1/2 (mV) | -27.8 ± 0.5 | -28.2 ± 0.7 |
| Slope (mV/e-fold) | 6.00 ± 0.17 | 6.24 ± 0.16 | |
| Inactivation | V 1/2 (mV) | -70.0 ± 1.0 | -71.7 ± 1.1 |
| Slope (mV/e-fold) | 5.95 ± 0.12 | **6.67 ± 0.19 | |
| Cell capacitance | pF | 16.0 ± 1.2 | 14.2 ± 0.7 |
| I max | pA/pF | -185 ± 21 | -249 ± 22 |
| n | 22 | 17 | |
For each channel type the cells are numbered starting from 1. For the sake of similar conditions (cells from the same passage, recordings on the same day, same solution aliquots), new cells have been recorded for the tag study. There are two sheets per channel type: one with data from the current voltage (I/V) activation, together with the steady-state inactivation (SSI) protocol; and a second one with data obtained with the onset of slow inactivation (OSI) and the recovery from inactivation (RFI) protocol. For some cells, only some of the protocols have been applied (thus non-continuous cell numbering in some OSI/RFI sheets). All measured voltages are given in mV; cell capacitance was measured in pF. Note that the cells transfected with untagged hNav1.5 used for comparison with mNav1.5 are not the same as in the study with different tags. See Figure 2 and 4 for information about the applied protocols.
FLAG-tag inserted at the L299/V300 site alters voltage-dependent activation of hNa v1.5
The second set of experiments addressed the effects of adding epitopes to Na v1.5 on its biophysical properties. To do this, we assessed the influence of these epitopes on I Na by expressing differently tagged hNa v1.5 in HEK293 cells and performing whole-cell voltage-clamp experiments similar to those described above. YFP- and GFP-tags were added to the N-terminus; the FLAG-tag was inserted into the extracellular loop linking S5 to S6 of domain I, between residues Leu-299 and Val-300. Representative I Na recordings for all transfected constructs are shown in Figure 3 and the data is summarised in Table 2. With the exception of the GFP-tagged construct, tagging of hNa v1.5 led to a significant decrease in peak current I max ( Figure 4A) compared to the control WT hNa v1.5 (FLAG: 57 pA/pF with P<0.01, YFP: 120 pA/pF with P<0.05, WT hNa v1.5: 240 pA/pF). Adding GFP did not affect any of the biophysical properties of the human sodium channel, while a shallower activation slope (6.87 vs. 5.91 mV/e-fold, P<0.05, Figure 4B and Table 2) was observed for the YFP-tagged channel. The most pronounced effects were observed for the FLAG-tagged hNa v1.5. The activation slope was significantly shallower (6.96 vs. 5.91 mV/e-fold, Figure 4B and Table 2), indicating that the activation of this channel is less sensitive to voltage changes. In addition, the V 1/2 of activation was shifted towards more positive voltages by about 5 mV, with -23.9 mV in FLAG-hNa v1.5, compared to -28.9 mV in untagged hNa v1.5. Finally, the reversal potential was decreased in the FLAG-hNa v1.5 (FLAG 39.3 mV and untagged 51.8 mV, Figure 4B). Recovery from inactivation ( Figure 4C) and onset of slow inactivation ( Figure 4D) were comparable for all channels.
Figure 3. Representative sodium current (I Na) recordings.

( A) Voltage-dependent currents measured for hNa v1.5 expressed in a HEK293 cell. The same data for ( B) FLAG-hNa v1.5 ( C) YFP-hNa v1.5, and ( D) GFP-hNa v1.5.
Table 2. Summarized properties of wild-type and tagged hNa v1.5.
Data was obtained with current-voltage (I/V)-, and steady-state inactivation protocols. Mean values and standard errors are shown. *P<0.05, **P<0.01 obtained by two-tailed Student's t-tests (all statistics were calculated with untagged hNa v1.5 channel as a reference).
| hNa v1.5 | FLAG-hNa v1.5 | YFP-hNa v1.5 | GFP-hNa v1.5 | ||
|---|---|---|---|---|---|
| mean ± sem | mean ± sem | mean ± sem | mean ± sem | ||
| I/V | V rev (mV) | 51.8 ± 0.9 | **39.3 ± 2.2 | 49.1 ± 1.5 | 53.8 ± 1.9 |
| Activation | V 1/2 (mV) | -28.9 ± 0.6 | **-23.9 ± 0.5 | -27.5 ± 1.1 | -29.8 ± 1.1 |
| Slope (mV/e-fold) | 5.91 ± 0.17 | **6.96 ± 0.14 | *6.87 ± 0.27 | 5.40 ± 0.36 | |
| Inactivation | V 1/2 (mV) | -70.6 ± 1.2 | -70.0 ± 1.1 | -71.2 ± 1.4 | -68.9 ± 1.2 |
| Slope (mV/e-fold) | 5.95 ± 0.24 | 5.33 ± 0.15 | 5.69 ± 0.19 | 6.37 ± 0.19 | |
| Cell capacitance | pF | 14.4 ± 1.6 | 16.3 ± 1.1 | 14.5 ± 0.9 | 14.0 ± 0.8 |
| I max | pA/pF | 240 ± 36 | **57 ± 11 | *120 ± 17 | 214 ± 33 |
| n | 7 | 11 | 11 | 8 | |
Figure 4. Electrophysiological properties of untagged and tagged hNa v1.5.
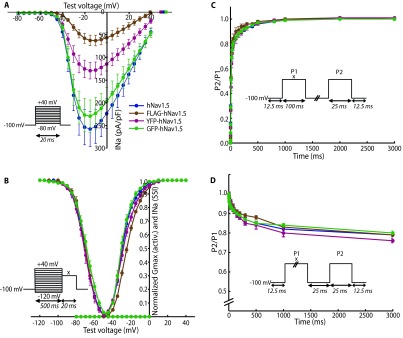
The voltage-clamp protocols used are shown in the corresponding insets. For B–D, the voltage x was adjusted to the voltage that elicited maximum current during the current voltage (I/V)-protocol. ( A) I/V-protocol for assessment of reversal potentials. Tagging with N-terminal YFP and FLAG (L299/V300) significantly decreases peak currents. Calculated reversal potentials are marked with square data points. ( B) Voltage-dependence of activation and steady-state inactivation. The data was fitted with the Boltzmann formula. The activation slope of FLAG- and YFP-tagged channels is shallower compared to the untagged hNa v1.5. V 1/2 is shifted by 5 mV for FLAG-hNa v1.5. ( C) Recovery from inactivation. The duration between the depolarising steps was varied from 0.25 to 3000 ms. No differences between the different channels could be detected. ( D) Onset of slow inactivation. The duration of the first step was varied from 0.25 to 3000 ms. The relative number of channels entering slow inactivation is similar for all four channel types. ( A–B): n(untagged) = 7, n(FLAG) = 11, n(YFP) = 11, n(GFP) = 8. ( C): n(untagged) = 12, n(FLAG) = 5, n(YFP) = 11, n(GFP) = 8. ( D): n(untagged) = 10, n(FLAG) = 8, n(YFP) = 10, n(GFP) = 8. **P<0.01 obtained by two-tailed Student's t-tests; error bars indicate standard errors.
For each channel type the cells are numbered starting from 1. For the sake of similar conditions (cells from the same passage, recordings on the same day, same solution aliquots), new cells have been recorded for the tag study. There are two sheets per channel type: one with data from the current voltage (I/V) activation, together with the steady-state inactivation (SSI) protocol; and a second one with data obtained with the onset of slow inactivation (OSI) and the recovery from inactivation (RFI) protocol. For some cells, only some of the protocols have been applied (thus non-continuous cell numbering in some OSI/RFI sheets). All measured voltages are given in mV; cell capacitance was measured in pF. Note that the cells transfected with untagged hNav1.5 used for comparison with mNav1.5 are not the same as in the study with different tags. See Figure 2 and 4 for information about the applied protocols.
Discussion
The present study demonstrates (1) that the biophysical properties of mouse Na v1.5 are essentially similar to the human homolog when expressed in HEK293 cells, and (2) that adding epitopes either upstream of the N-terminus of human Na v1.5 or in one of the extracellular loops reduces the amount of I Na and alters some of its biophysical properties. Interestingly, GFP in the N-terminus was the only epitope that did not modify any of the measured biophysical properties of hNa v1.5. The most pronounced effects could be observed by the insertion of the FLAG-tag in an extracellular loop. In this construct, not only was the amount of I Na drastically decreased, but also the activation properties of the sodium channel were altered. The smaller changes found in the properties of YFP-hNa v1.5 might be partially linked to the different vector used for this epitope, especially since no alterations could be observed for GFP-hNa v1.5.
The limitations of studying mutant Na v1.5 channels in mammalian cells have been demonstrated in two recent studies. First, Mohler and colleagues 8 observed that the Brugada syndrome causing mutant p.E1053K Na v1.5 channel did not display any trafficking defect in HEK293 cells, while it failed to traffic to the intercalated discs when expressed in rat ventricular cells. Second, the Na v1.5 p.D1275N variant, found in patients with dilated cardiomyopathy and various arrhythmias and conduction disease, was also found to display reduced expression in knocked-in mouse cardiac tissue and defective expression at the lateral membrane of ventricular myocytes 9. However, when expressed in chinese ovary cells, the p.D1275N variant had properties that were undistinguishable from wt channels. These observations demonstrate that, while useful to study their intrinsic biophysical properties, the mammalian cells that are used as expression systems have clear limitations when studying the trafficking properties of ion channels. Generation of genetically-modified animal models is one of the most powerful, albeit time-consuming, approaches.
However the findings of the present study have to be taken into account when planning to generate such mouse models that harbour specific epitopes in the mouse Na v1.5 gene. Different combinations of epitopes and insertion sites might reveal better candidates for in-vivo approaches. Furthermore, additional studies should be performed in HEK293 cells co-expressing other subunits and regulating proteins, and in native cardiomyocytes in order to assess the effects of added epitopes on the interactions with these proteins.
Acknowledgments
We would like to thank D. Shy for her helpful comments on this manuscript.
Funding Statement
This work was supported by a grant from the Swiss National Science Foundation to HA (310030B_135693).
The funders had no role in study design, data collection and analysis, decision to publish, or preparation of the manuscript.
v2; ref status: indexed
References
- 1.Kleber AG, Rudy Y: Basic Mechanisms of Cardiac Impulse Propagation and Associated Arrhythmias. Physiol Rev. 2004;84(2):431–88. 10.1152/physrev.00025.2003 [DOI] [PubMed] [Google Scholar]
- 2.Wilde AA, Brugada R: Phenotypical Manifestations of Mutations in the Genes Encoding Subunits of the Cardiac Sodium Channel. Circ Res. 2011;108(7):884–97. 10.1161/CIRCRESAHA.110.238469 [DOI] [PubMed] [Google Scholar]
- 3.Shy D, Gillet L, Abriel H: Cardiac Sodium Channel Nav1.5 Distribution in Myocytes via Interacting Proteins: The Multiple Pool Model. Biochim Biophys Acta. 2013;1833(4):886–94. 10.1016/j.bbamcr.2012.10.026 [DOI] [PubMed] [Google Scholar]
- 4.Abriel H: Cardiac sodium channel Na(v)1.5 and interacting proteins: Physiology and pathophysiology. J Mol Cell Cardiol. 2010;48(1):2–11. 10.1016/j.yjmcc.2009.08.025 [DOI] [PubMed] [Google Scholar]
- 5.Derangeon M, Montnach J, Baro I, et al. : Mouse Models of SCN5A-Related Cardiac Arrhythmias. Front Physiol. 2012;3:210. 10.3389/fphys.2012.00210 [DOI] [PMC free article] [PubMed] [Google Scholar]
- 6.Zimmer T, Bollensdorff C, Haufe V, et al. : Mouse heart Na+ channels: primary structure and function of two isoforms and alternatively spliced variants. Am J Physiol Heart Circ Physiol. 2002;282(3):H1007–H1017. [DOI] [PubMed] [Google Scholar]
- 7.Zimmer T, Biskup C, Dugarmaa S, et al. : Functional expression of GFP-linked human heart sodium channel (hH1) and subcellular localization of the a subunit in HEK293 cells and dog cardiac myocytes. J Membr Biol. 2002;186(1):1–12. 10.1007/s00232-001-0130-1 [DOI] [PubMed] [Google Scholar]
- 8.Mohler PJ, Rivolta I, Napolitano C, et al. : Nav1.5 E1053K mutation causing Brugada syndrome blocks binding to ankyrin-G and expression of Nav1.5 on the surface of cardiomyocytes. Proc Natl Acad Sci U S A. 2004;101(50):17533–8. 10.1073/pnas.0403711101 [DOI] [PMC free article] [PubMed] [Google Scholar]
- 9.Watanabe H, Yang T, Stroud DM, et al. : Striking In Vivo Phenotype of a Disease-Associated Human SCN5A Mutation Producing Minimal Changes in Vitro. Circulation. 2011;124(9):1001–11. 10.1161/CIRCULATIONAHA.110.987248 [DOI] [PMC free article] [PubMed] [Google Scholar]