

Abstract
Purpose
We hypothesized that vertical blockade of VEGF signaling by combining bevacizumab with sorafenib in recurrent glioblastoma (rGBM) patients would result in a synergistic therapeutic effect. We also investigated whether VEGF, VEGFR2, and HIF-1α single nucleotide polymorphisms (SNPs), circulating biomarkers of angiogenesis and Magnetic Resonance (MR) imaging markers, such as apparent diffusion coefficient (ADC), correlated with treatment efficacy and/or toxicity.
Patients/Methods
Patients received bevacizumab (5 mg/kg every 2 weeks) with sorafenib (200 mg bid, weekly, days 1-5) (Group A), but due to toxicity the starting sorafenib dose was subsequently modified to 200 mg qd (Group B).
Results
54 patients were enrolled: 19 patients in Group A and 35 in Group B. Objective response rate was 18.5% with median duration of 6.7 mo (range 0.5-24.1 mo). Six-month progression free survival (PFS6) was 20.4% (11/54), and median OS was 5.6 months (95% CI 4.7 – 8.2); outcome was similar between the two dose groups. We identified single nucleotide polymorphisms in the VEGF and VEGFR2 promoter regions which were associated with PFS6 (p<0.022). Among molecular markers of angiogenesis, a higher log2 baseline level of stromal cell derived factor-1 was associated with PFS6 success (p=0.04). The circulating endothelial cell log2-fold decreased during treatment with subsequent increase at disease progression (p=0.022). Imaging analysis demonstrated a trend associating ADC-L with poor outcome.
Conclusions
The bevacizumab/sorafenib combination did not improve outcome of recurrent GBM patients versus historic bevacizumab treated controls. Biologic markers of response and resistance to bevacizumab in gliomas were identified which merit prospective validation.
Keywords: bevacizumab, sorafenib, recurrent glioblastoma
Introduction
Glioblastoma (GBM) is the most common glioma histology and has a dismal prognosis with a median survival of 16 to 18 months, despite multimodality treatment (1). When GBM recurs, available treatment options have a limited impact on outcome.
Glioblastoma is characterized by a microenvironment of intense angiogenesis, contributing to tumor growth and progression (2-4). Inhibition of angiogenesis ligand (e.g., vascular endothelial growth factor; VEGF) or receptor (e.g., VEGFR) signaling in recurrent glioma patients has resulted in clinical benefit (5-7). The anti-VEGF antibody bevacizumab (Avastin) received FDA accelerated approval in 2009 for treatment of recurrent GBM on the basis of sustained imaging responses. Despite PFS prolongation, bevacizumab's impact on overall survival remains undefined. Novel approaches to build on bevacizumab efficacy, possibly exploiting multiple targets in the angiogenesis cascade or preventing the development of resistance to bevacizumab warrant further investigation.
Sorafenib is a small molecule inhibiting the kinase activity of Raf, VEGFR2 (the main VEGF receptor in GBM), VEGFR3, c-kit, and PDGFR-β. Both VEGFR2 and PDGFR-β play a key role in driving angiogenesis, and aberrant activation of Ras signaling is a common finding in glioblastoma (8). Sorafenib has shown preclinical and modest early clinical activity against GBM (9); the single agent maximum tolerated dose for patients not on enzyme inducing anticonvulsants was 600 mg bid.
The rationale for testing the bevacizumab/sorafenib combination in recurrent glioblastoma was its potential to block angiogenesis at the ligand and receptor level simultaneously, thus creating therapeutic synergy. Two previously completed phase I trials had established the phase II dose of this regimen (10, 11). Objective responses were observed in heavily pretreated solid tumors including ovarian and renal cell carcinoma patients.
The goal of this phase II trial was to assess the clinical activity of the bevacizumab/sorafenib combination in GBM, as measured by six-month progression free survival (PFS6), and to evaluate its safety and adverse effects in this patient population. We also sought to examine the relationship between genetic polymorphisms and circulating biomarkers of vascular response and clinical outcome, to assess the potential utility of MR imaging markers in predicting outcome, and to assess the impact of treatment on patients' quality of life.
Methods
Patient Eligibility
Eligible patients were ≥ 18 years of age and had histologic confirmation of grade 4 astrocytoma at initial diagnosis or recurrence. They were required to be on a stable dose of corticosteroids or no corticosteroids for ≥ 1 week before baseline imaging, to have had their last chemotherapy treatment ≥ 4 weeks before study entry (≥ 6 weeks for nitrosoureas) and to be ≥12 weeks from completion of RT. Patients were also required to have an ECOG performance score of 0 to 2; and adequate hematologic, hepatic and renal function. All patients were required to sign the respective IRB approved consent form prior to enrollment.
Exclusion criteria included inadequately controlled hypertension, prior anti-angiogenic therapy, more than one chemotherapy regimen for progressive disease, evidence of bleeding diathesis, coagulopathy or therapeutic anticoagulation with warfarin, history of myocardial infarction or unstable angina ≤ 6 months prior to registration, surgery ≤ 28 days before registration, history of stroke or transient ischemic attack ≤ 6 months prior to registration or evidence of CNS hemorrhage on baseline CT or MRI. Patients requiring enzyme inducing anti-epileptics drugs for seizure control were not eligible, given their impact on sorafenib metabolism.
Study treatment
Patients initially received sorafenib 200 mg bid for 5/7 days per week and bevacizumab 5 mg/kg IV every two weeks (cycle length = 14 days). Sorafenib dose escalation to 200 mg bid (7/7 days) was allowed if no grade 3 or 4 toxicity was observed in cycle 1. After the trial met a prespecified interim toxicity stopping rule following accrual of the first 19 patients, the protocol was amended to decrease the starting dose of sorafenib to 200 mg daily while keeping the bevacizumab dose unaltered.
Definition of response
Neuroimaging with magnetic resonance imaging was performed at baseline, before the third treatment cycle, and every fourth cycle thereafter. RANO criteria were used to determine response and progression (12). Scans were centrally reviewed at completion of the study by a neuroradiologist (TK). In order to calculate the apparent diffusion coefficient (ADC), regions of interest were manually traced around all contrast-enhancing tumors, excluding areas of necrosis and hemorrhage, on baseline scans and on follow-up scans through two months' time using Analyze software (Biomedical Imaging Resource, Mayo Clinic, Rochester, MN). ADC statistics were calculated for these regions of interest, employing an ADC histogram approach, in 31 patients (13).
Evaluation of Quality of Life
Study patients completed the FACT-Br (Functional Assessment for Cancer Therapy – Brain) at baseline and every other cycle.
Correlative analysis
a. Analysis of circulating endothelial cells (CECs)
Analysis of CECs was performed at baseline, Cycle 1 Day 3 (± 1 day), prior to treatment Cycle 2, prior to treatment Cycles 3, 5, 7, 9, 11 and 13 and at disease progression, withdrawal or removal. Whole blood samples were collected in Vacutainer EDTA tubes, refrigerated and shipped the same day as collected by Priority Overnight Service with a cold pack to the reference library. CECs were counted as previously described (14, 15); analysis was performed ≤ 48 hours from sample collection.
b. Analysis of circulating biomarkers of angiogenesis
Measurement of angiogenic proteins in plasma was performed at baseline, Cycle 1 Day 3 (± 1 day), prior to treatment cycle 2, prior to treatment Cycle 3, and prior to treatment cycles 5, 7, 9, 11 and 13. Blood was collected in EDTA-containing vacutainers, processed into plasma aliquots and frozen at −80°C. Frozen plasma samples were shipped overnight in dry ice to the NCCTG Biospecimen Bank. To reduce inter-assay variability, plasma samples were delivered to the reference laboratory for analyses after the last patient specimen was received. Plasma levels of bFGF, SDF-1α, HGF, soluble c-kit, Ang-2 and P1GF were determined using ELISA (R&D Systems) as per the manufacturer's instructions.
c. VEGF, VEGFR2 and HIF-1α SNP analysis
The following 14 SNPs were analyzed: VEGF rs699947, rs1005230, rs833061, rs1570360, rs2010963, rs25648, rs3025039, and rs10434; VEGFR2 rs2071559, rs2305948, rs1870377 and rs2219471; and HIF-1α rs11549465 and rs11549467. DNA was extracted at baseline from whole blood collected in 10 mL EDTA tubes. Genotyping was performed in the Genotyping Shared Resource, Mayo Clinic, Rochester, MN, using TaqMan® Drug Metabolism Genotyping Assays (Applied Biosystems, Foster City, CA) or direct sequencing.
Statistical design
This was a one stage phase II, three outcome design (16). Fifty three patients provided 90% power to detect a six-month progression free survival (PFS6) difference of 30% vs. 45%, with an alpha error of 0.10. Survival and time to progression curves were compared via the logrank test; Cox proportional hazard models were used to assess the relationship between time-to-event endpoints and outcome.
Information on prescribed corticosteroid amounts for each cycle was collected and expressed as dexamethasone equivalent doses. The amount of change from baseline was calculated as fold change (dose received during the cycle divided by the baseline dose). Changes from baseline to cycles 1-12 were analyzed via t-test; linear mixed effects models were used to analyze the linear cycle to cycle slope.
For the quality of life data analysis, patients were considered distressed if the score on a FACT-Br subscale or total was ≤ 50. Absolute change from baseline values was calculated and changes over time were evaluated using t-tests and repeated measures linear mixed effect regression models.
To analyze the SNP data, Fisher's Exact tests were used to determine genotype association with the primary endpoint (PFS6) or the most common grade 3+ adverse events. Adjustments for multiple testing were made using the false discovery rate as per Benjamini (17). Kaplan-Meier and Cox proportional hazard models were used to compare outcome between genotype subgroups.
Unequal variance two sample and paired t-tests were performed to compare values between patient outcome groups and serial CEC measurements within a patient. Linear regression models were used to assess associations between circulating biomarkers of angiogenesis and patient outcomes.
For analysis of MR imaging data, two-mixture generalized lambda distributions were used to model the apparent diffusion coefficient (ADC) histogram data, as described by Pope et al (13, 18).
Results
Patient characteristics
Patient characteristics are summarized in table 1; 54 patients were accrued on the study, 19 in the starting dose level, (Group A, sorafenib 200 mg bid for 5/7 days, bevacizumab 5 mg/kg every 2 weeks) and 35 patients in the amended dose schedule (Group B, sorafenib 200 mg qd, bevacizumab 5 mg/kg every two weeks).
Table 1. Patient characteristics.
| All Patients | Group A | Group B | ||
|---|---|---|---|---|
| N = 54 | N = 19 | N = 35 | ||
| Age | Median (range) | 55 (25-76) | 54 (25 – 68) | 55 (28 – 76) |
| PS | 0 1 2 |
15 (28%) 31 (57%) 8 (15%) |
3 (16%) 12 (63%) 4 (21%) |
12 (63%) 19 (54%) 4 (12%) |
| Steroids | Yes | 36 (67%) | 15 (79%) | 21 (60%) |
| No. of chemo regimens for recurrent disease 1 0 |
48 (89%) 6 (11%) |
14 (74%) 5 (26%) |
34 (97%) 1 (3%) |
|
Efficacy analysis
The study did not meet its primary endpoint. Progression free survival (PFS) at 6 months for all study patients was 20.4% (11/54 patients) with a median progression free survival of 2.9 mo (95% CI: 2.3-3.6) and median overall survival 5.6 mo (95% CI: 4.7-8.2). Efficacy outcomes according to sorafenib dose are summarized in table 2. There was no significant difference in PFS or overall survival between the two sorafenib dose cohorts. Objective response rate for all study patients was 18.5% (10/54), with median duration of 6.8 mo. Overall response rate appeared to be higher at the highest sorafenib dose cohort, but the difference did not reach statistical significance. Analysis of ADC histograms (13, 18, 19), showed a trend suggesting an association between low ADC-L (ADC of the lower curve: mean ADC of the lower distribution) and poor outcome (p=0.088); there was no association between baseline ADC or ADC changes from baseline to week 4 and outcome, however.
Table 2. Efficacy Outcomes.
| Group A (N=19) | Group B (N=35) | |
|---|---|---|
| Median Follow-up (range) | 5.6 mo (0.76 – 27.7) | 5.6 (1.4 – 22.7) |
| Response | 6 (32%) | 4 (11%) |
| Stable Disease | 12 (63%) median duration 1.4 mo | 22 (63%) median duration 2.0 mo |
| PFS6 | 5 (26%) | 6 (17%) |
| PFS Median (95% CI) | 3.61 mo (1.84, 5.95) | 2.66 mo (2.07, 3.25) |
| OS Median (95% CI) | 5.58 mo (4.11, 8.48) | 5.62 mo (3.22, 8.67) |
Toxicity
Toxicity was graded according to the National Cancer Institute Common Terminology Criteria version 3.0. Following accrual of the first 19 patients, the trial met the prespecified interim toxicity stopping rule with 3/19 patients experiencing grade 4 non-hematologic toxicity and a 42% treatment discontinuation rate. Decrease of the starting sorafenib dose resulted in improved treatment tolerance. Overall, most common grade 3/4 toxicities were fatigue (13/54, 24%), hypertension (8/54, 15%), and hypophosphatemia (7/54, 13%) (Fig 1). Supplementary table 1 summarizes the most common grade 3/4 toxicities per dose group. Sorafenib dose significantly impacted treatment tolerance: 26.3% (5/19 patients) went off study due to toxicity and 15.7% (3/19) due to treatment refusal in group A versus 14.3% (5/35 patients) and 5.7% (2/35) respectively in group B.
Figure 1.

Most commonly observed treatment-related toxicities.
Quality of Life and Steroid Use Assessment
All 54 patients had FACT-Br questionnaires completed at baseline. Forty-six patients had at least 1 questionnaire, 31 patients had at least 2 questionnaires and 20 patients had at least 3 questionnaires completed during treatment. Patients who were distressed at baseline did not have an increased hazard rate for PFS or OS. Two of the subscales (Physical Well Being and Social/Family Well Being) decreased from baseline to completion of cycles 2 (p = 0.054 and 0.016, respectively) and 4 (p=0.016 and p=0.055, respectively), as well as in the linear mixed effect model (p≤ 0.0001 and p=0.026, respectively). Overall, these data indicate that treatment with bevacizumab/sorafenib did not improve the quality of life in recurrent GBM patients, possibly due to regimen associated toxicity.
There was a 40% reduction in steroid use during cycle 1 and 30% dose reduction in cycle 2; these changes approached but did not reach statistical significance (p=0.057 and p=0.0052 respectively). The linear mixed effects model results similarly indicate strong evidence of a per cycle decrease from the baseline dose levels of corticosteroids, with an average 15.4% dose decrease per cycle slope (p-value=1.15 × 10¹¹).
Correlative analysis
a. Circulating endothelial cell (CEC)
Circulating endothelial cell analysis was performed in 49/54 patients. Median baseline CEC were 83.3 (mean 136; range 6.5 to 594 cells/mL). There was no correlation between baseline CEC values and PFS6 (p=0.19). The CEC log2-fold change from baseline decreased during treatment reaching significance at cycles 2, 7, 9 and 11 (p=0.03, 0.047, 0.004, and 0.005 respectively, Figure 2A); there was subsequent significant increase in patients who were removed from the study due to progression as compared to other reasons (p=0.022, t-test, Figure 2b).
Figure 2.
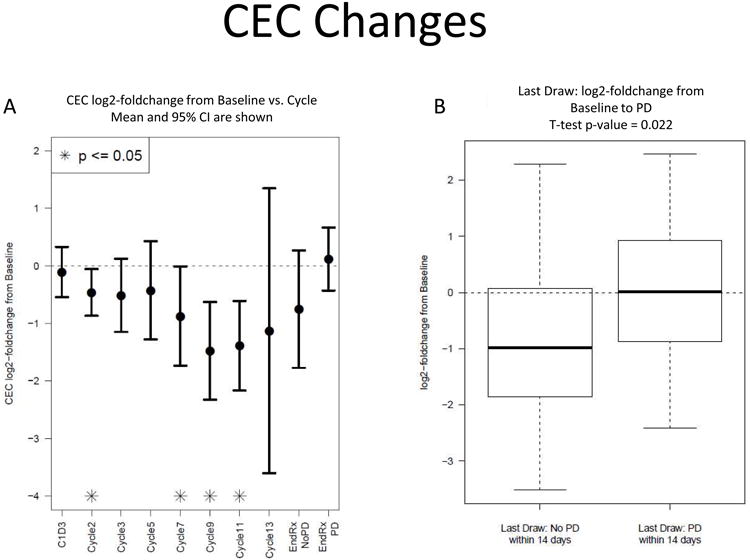
(A) Circulating endothelial cells expressed as log2-fold change from baseline decreased during treatment reaching significance at cycles 2, 7, 9 and 11, and increased prior to progression (B).
b. Circulating biomarkers of angiogenesis
The circulating biomarkers Ang-2, bFGF, HGF, PlGF, SDF-1α and soluble c-kit were measured at baseline and during treatment (see methods). A larger log2 baseline level of SDF-1α and a log2-fold, change in Ang-2 or soluble c-kit at cycle 1 day 3 were associated with PFS6 success (p=0.04, p=0.036, and 0.027, respectively).
c. Analysis of VEGF, VEGFR2, and HIF-1α single nucleotide polymorphisms (SNPs)
SNP analysis was performed in all 54 patients. This analysis and genotype frequencies are summarized in Supplementary table 2; SNP relationships with toxicity and outcome are summarized in table 3. In summary, PFS6 success was altered in recurrent GBM patients with mutant alleles in the VEGF promoter: PFS6 success increased for mutant rs699947 and rs833061 and PFS6 success decreased for mutant rs1005230 and rs1570360, and VEGFR2 promoter: PFS6 success increased for heterozygous rs2071559. Furthermore, increased incidence of ≥ grade 3 fatigue and hypertension was observed in patients with heterozygous alleles in the VEGF promoter (rs1005230, rs699947, and rs833061), and decreased incidence of ≥ grade 3 fatigue in patients with heterozygous alleles in the VEGF 3′UTR (rs10434). There was no association between the SNPs analyzed and sorafenib induced hand-foot syndrome. Our data represents the first evidence that VEGF and VEGFR2 genetic polymorphisms could predict outcome in GBM patients treated with bevacizumab.
Table 3. SNP Relationships with Outcome and Toxicity.
| SNP (n=54) | 6 month PFS (p value1) | Fatigue (p value1) | Hypertension (p value1) | Skin reaction (p value1) |
|---|---|---|---|---|
| rs699947 | 0.011* | 0.022* | 0.006* | 0.085 |
| rs1005230 | 0.011* | 0.022* | 0.006* | 0.085 |
| rs833061 | 0.013* | 0.014* | 0.010* | 0.071 |
| rs1570360 | 0.004* | 0.072 | 0.153 | 0.227 |
| rs2010963 | 0.055 | 0.114 | 0.233 | 0.084 |
| rs25648 | 0.145 | 0.065 | 0.154 | 0.103 |
| rs3025039 | 0.324 | 0.286 | 0.322 | 0.215 |
| rs10434 | 0.100 | 0.025* | 0.123 | 0.166 |
| rs2305948 | 0.324 | 0.286 | 0.341 | 0.429 |
| rs2071559 | 0.025* | 0.052 | 0.085 | 0.168 |
| rs1870377 | 0.098 | 0.093 | 0.152 | 0.055 |
| rs2219471 | 0.107 | 0.082 | 0.188 | 0.268 |
| rs11549465 | 0.157 | 0.438 | 0.516 | 0.670 |
Fisher's Exact Test p-value
statistical significance
False Discovery Rate for the 12 p-values < 0.05 is 11% (method of Benjamini and Hochberg)
Discussion
We showed that the sorafenib/bevacizumab combination has clinical activity in recurrent GBM, but at the previously recommended phase II dose of sorafenib (200 mg bid, weekly, days 1-5) and bevacizumab (5 mg/kg every two weeks) is associated with toxicity, necessitating a decrease in sorafenib starting dose. Response rate, PFS6, and overall survival outcome in patients treated with this combination appear inferior as compared to previously reported outcomes with single agent bevacizumab in prospective or retrospective series (6, 7, 20). This could be reflective of the patient population in our study, treated in community-based NCCTG centers (21), as compared to tertiary academic centers in which previously published outcome data were based. For example, our patients had worse performance scores and a higher percentage was on corticosteroids at study entry as compared to other trials (6, 7). Further supporting this possibility, the PFS6 of single agent bevacizumab treated patients in the recently reported European BELOB (22) and Australian CABARET trials (23) ranged from 16% to 24%, consistent with the results of our study. It is unlikely that the inferior outcome in our study can be attributed to the lower bevacizumab dose (5 mg/kg q 2 wk), as compared to the standard dose of 10 mg/kg q 2 wk, approved for GBM treatment. A bevacizumab dose of 5 mg/kg was employed in the first proof or principle demonstration of bevacizumab activity in recurrent glioma patients (24) and has been subsequently used in other patient series (25, 26) with comparable outcomes, consistent with data in other malignancies such as colorectal cancer (27). Nevertheless, the negative impact of the sorafenib/bevacizumab combination therapy on tumor biology cannot completely be excluded.
In preclinical studies, sorafenib has resulted in antiglioma activity in vitro and in vivo in orthotopic GBM models (9). Notwithstanding, this has only translated into modest single agent activity in recurrent glioma patients (28). The rationale for the sorafenib/bevacizumab combination strategy in this study was the vertical inhibition of the VEGF/VEGFR axis, a key driver in glioma angiogenesis by combining bevacizumab mediated VEGF ligand blockade with sorafenib mediated receptor blockade. Our clinical results do not support the efficacy of this strategy as compared to single agent bevacizumab, likely due to the limited sorafenib penetration to the CNS, its modest single agent efficacy even in higher doses (2) and the toxicity of the combination. In general, and despite the potential therapeutic promise, combining anti-VEGFR tyrosine kinases with bevacizumab has been challenging and associated with significant toxicity frequently necessitating significant dose reductions as compared to single agent doses (11, 29, 30). Of note, sorafenib/bevacizumab combination doses previously reported to be well tolerated in other solid tumors such as ovarian cancer and renal cell carcinoma (11, 29, 30) still resulted in unacceptable toxicity in glioma patients treated in our study. Combination of other more potent and specific VEGFR tyrosine kinase inhibitors such as sunitinib with bevacizumab has also been shown to be unsafe with long-term follow up revealing the development of microangiopathic hemolytic anemia, renal insufficiency and neurologic toxicity (31). These data indicate that vertical blockade of the VEFR/VEGFR axis in GBM can be toxic when currently available agents are employed and alternative strategies should be considered in order to build on bevacizumab efficacy.
Because antiangiogenic drugs interact with non-malignant endothelial cells and the tumor microenvironment, the genetic background of the patient may play a major role determining the efficacy of these drugs spanning across different tumor types. Along these lines, the analysis of VEGF, VEGFR2 and HIF-1α SNPs as predictors of outcome in our trial was intriguing. Specifically, increased PFS6 successes were observed in GBM patients with mutant alleles in the VEGF promoter (rs699947 and rs833061) and VEGFR2 heterozygous promoter (rs2071559). It is of note that the VEGFA polymorphism rs699947 has been associated with overall survival in metastatic breast cancer patients receiving paclitaxel/bevacizumab and the VEGFR2 polymorphism rs833061 was associated with progression-free survival and overall survival in colorectal cancer patients treated with first-line FOLFIRI with bevacizumab (32-34). The pharmacogenomics data generated in our trial represents the first attempt to associate genotypic difference with outcome in glioma patients treated with bevacizumab; we are in the process of further validating them in the ongoing Alliance trials N0872 and N1174. If confirmed, they could facilitate selection of patients who may benefit from treatment with bevacizumab in the recurrent disease setting. These polymorphisms could also have an impact on benefit realized from bevacizumab use in the upfront setting.
There was no correlation between baseline circulating endothelial cell counts or other circulating markers of angiogenesis such as Ang-2, bFGF, P1GF, SDF-1α and PFS6 in recurrent GBM patients treated with bevacizumab/sorafenib; this could have been impacted by the observed toxicity which resulted in early treatment discontinuation in 14.3%/26.3% of the patients (groups A and B respectively) and influenced by the lower bevacizumab dose employed in our study. Nevertheless, monitoring the differences in CEC log2-fold change from baseline during this treatment combination may predict progression and potentially provides insights to mechanisms of bevacizumab resistance. Circulating endothelial cells express high levels of the endoglin receptor CD105 and the re-emergence of these cells in association with progression, as in our trial, supports the hypothesis that these cells might mediate the development of secondary resistance. We are currently exploiting strategies combining bevacizumab with the anti-CD105 antibody TRC105 in order to block this potential escape mechanism: a randomized phase II trial of this combination is ongoing (Alliance N1174).
In addition to genotyping and measurement of cellular and molecular markers of angiogenesis, we did investigate imaging markers as possible predictors of response to treatment. In contrast to previously reported data on the predictive value of the apparent diffusion coefficient histogram analysis (18, 19), baseline ADC and change from baseline at week 4 were not associated with outcomes. In agreement with these same previous studies, however, our study did demonstrate a trend associating a low ADC-L with poor outcome (p=0.088). The fact that this association did not reach statistical significance could be due to the smaller sample size in our study.
In summary, the combination of bevacizumab and sorafenib does not appear to have increased activity versus single agent bevacizumab in recurrent GBM patients and this combination is associated with increased toxicity. However, a number of interesting biologic observations including pharmacogenomic analysis and analysis of circulating endothelial cells in this study merits further prospective evaluation and can be used to build future combinatorial strategies in recurrent GBM patients.
Supplementary Material
Statement of Translational Relevance.
This phase II trial of bevacizumab in combination with sorafenib tests the concept of vertical blockade of VEGF signaling in recurrent glioblastoma by combining ligand and receptor inhibition. Bevacizumab is an approved agent for treatment of glioblastoma; its clinical benefit is short-lived, however, in the majority of patients. Identifying predictive markers of response and understanding mechanisms of resistance can contribute to the development of more effective bevacizumab-based regimens. In this trial we performed extensive correlative analysis to investigate single nucleotide polymorphisms that could predict clinical benefit, as well as circulating biomarkers of angiogenesis, including circulating endothelial cells, and MR imaging markers. To our knowledge, this is the first trial of bevacizumab in recurrent GBM to prospectively report on angiogenesis biomarkers during treatment course and assess genotype associations with outcome. Our findings and mechanistic insights are currently being validated in ongoing randomized phase II trials in recurrent GBM patients.
Footnotes
This study was conducted as a collaborative trial of the North Central Cancer Treatment Group and Mayo Clinic and was supported in part by Public Health Service grants CA-25224, CA-37404, CA-35090, CA-63848, CA-35269, CA-52352, CA-60276, CA-37417, CA-35267, CA-35103, CA-35431, and CA-63849 from the National Cancer Institute, Department of Health and Human Services. The content is solely the responsibility of the authors and does not necessarily represent the views of the National Cancer Institute or the National Institute of Health.
Additional participating institutions include: Rapid City Regional Oncology Group, Rapid City, SD 59709 (Mark T. Schroeder, M.D.); CentraCare Clinic, St. Cloud, MN 56301 (Donald Jurgens, M.D.); Cedar Rapids Oncology Project CCOP, Cedar Rapids, IA 52403 (Martin Wiesenfeld, M.D.); Michigan Cancer Research Consortium, Ann Arbor, MI 48106 (Philip J. Stella, M.D.); Sioux Community Cancer Consortium, Sioux Falls, SD 57105 (Miroslaw Mazurczak, M.D.); Wichita Community Clinical Oncology Program, Wichita, KS 67214-3882 (Shaker R. Dakhil, M.D.); Hematology & Oncology of Dayton, Inc, Dayton, OH 45415 (Howard M. Gross, M.D.); Duluth CCOP, Duluth, MN 55805 (Daniel A. Nikcevich, M.D.); St. Vincent Regional Cancer Center CCOP, Green Bay, WI 54303 (Anthony J. Jaslowski, M.D.); Meritcare Hospital CCOP, Fargo, ND 53122 (Preston D. Steen, M.D.); Columbia River Oncology Program, Portland, OR 97225 (Alison K. Conlin, M.D.); Siouxland Hematology-Oncology Associates, Sioux City, IA 51105 (Donald B. Wender, M.D.); Missouri Valley Cancer Consortium, Omaha, NE 68106 (Gamini S. Soori, M.D.)
Conflicts of Interest: Dr. Jan Buckner has a consultant relationship to disclose with Genentech which is uncompensated. Dr. Patrick Flynn has been paid directly honoraria from Genentech and Bayer.
References
- 1.Stupp R, Pavlidis N, Jelic S. ESMO Minimum Clinical Recommendations for diagnosis, treatment and follow-up of malignant glioma. Ann Oncol. 2005;16(1):i64–5. doi: 10.1093/annonc/mdi834. [DOI] [PubMed] [Google Scholar]
- 2.Fischer I, Gagner JP, Law M, Newcomb EW, Zagzag D. Angiogenesis in gliomas: biology and molecular pathophysiology. Brain Pathol. 2005;15:297–310. doi: 10.1111/j.1750-3639.2005.tb00115.x. [DOI] [PMC free article] [PubMed] [Google Scholar]
- 3.Kargiotis O, Rao JS, Kyritsis AP. Mechanisms of angiogenesis in gliomas. J Neurooncol. 2006;78:281–93. doi: 10.1007/s11060-005-9097-6. [DOI] [PubMed] [Google Scholar]
- 4.Jain RK, di Tomaso E, Duda DG, Loeffler JS, Sorensen AG, Batchelor TT. Angiogenesis in brain tumours. Nat Rev Neurosci. 2007;8:610–22. doi: 10.1038/nrn2175. [DOI] [PubMed] [Google Scholar]
- 5.Batchelor TT, Sorensen AG, di Tomaso E, Zhang WT, Duda DG, Cohen KS, et al. AZD2171, a pan-VEGF receptor tyrosine kinase inhibitor, normalizes tumor vasculature and alleviates edema in glioblastoma patients. Cancer Cell. 2007;11:83–95. doi: 10.1016/j.ccr.2006.11.021. [DOI] [PMC free article] [PubMed] [Google Scholar]
- 6.Friedman HS, Prados MD, Wen PY, Mikkelsen T, Schiff D, Abrey LE, et al. Bevacizumab alone and in combination with irinotecan in recurrent glioblastoma. J Clin Oncol. 2009;27:4733–40. doi: 10.1200/JCO.2008.19.8721. [DOI] [PubMed] [Google Scholar]
- 7.Kreisl TN, Kim L, Moore K, Duic P, Royce C, Stroud I, et al. Phase II trial of single-agent bevacizumab followed by bevacizumab plus irinotecan at tumor progression in recurrent glioblastoma. J Clin Oncol. 2009;27:740–5. doi: 10.1200/JCO.2008.16.3055. [DOI] [PMC free article] [PubMed] [Google Scholar]
- 8.Knobbe CB, Reifenberger J, Reifenberger G. Mutation analysis of the Ras pathway genes NRAS, HRAS, KRAS and BRAF in glioblastomas. Acta Neuropathol. 2004;108:467–70. doi: 10.1007/s00401-004-0929-9. [DOI] [PubMed] [Google Scholar]
- 9.Siegelin MD, Raskett CM, Gilbert CA, Ross AH, Altieri DC. Sorafenib exerts anti-glioma activity in vitro and in vivo. Neurosci Lett. 2010;478:165–70. doi: 10.1016/j.neulet.2010.05.009. [DOI] [PMC free article] [PubMed] [Google Scholar]
- 10.Azad NS, Posadas EM, Kwitkowski VE. Increased efficacy and toxicity with combination anti-VEGF therapy using sorafenib and bevacizumab (abstract 3004) Proc Am Soc Clin Oncol. 2006;24:121s. [Google Scholar]
- 11.Sosman JA, Flaherty KT, Atkins MB. A phase I/II trial of sorafenib (S) with bevacizumab (B) in metastatic renal cell cancer (mRCC) patients (pts) (abstract 3031) Proc Am Soc Clin Oncol. 2006;24:18s. [Google Scholar]
- 12.Wen PY, Macdonald DR, Reardon DA, Cloughesy TF, Sorensen AG, Galanis E. Updated response assessment criteria for high-grade gliomas: response assessment in neuro-oncology working group. J Clin Oncol. 2010;28:1963–72. doi: 10.1200/JCO.2009.26.3541. [DOI] [PubMed] [Google Scholar]
- 13.Pope WB, Kim HJ, Huo J, Alger J, Brown MS, Gjertson D, et al. Recurrent glioblastoma multiforme: ADC histogram analysis predicts response to bevacizumab treatment. Radiology. 2009;252:182–9. doi: 10.1148/radiol.2521081534. [DOI] [PubMed] [Google Scholar]
- 14.Mancuso P, Burlini A, Pruneri G, Goldhirsch A, Martinelli G, Bertolini F. Resting and activated endothelial cells are increased in the peripheral blood of cancer patients. Blood. 2001;97:3658–61. doi: 10.1182/blood.v97.11.3658. [DOI] [PubMed] [Google Scholar]
- 15.Khan, Solomon, McCoy Detection of Circulating Endothelial Cells and Endothelial progenitor Cells by Flow Cytometry. Cytometry Part B (Clinical Cytometry) 2005;64B:1–8. doi: 10.1002/cyto.b.20040. [DOI] [PubMed] [Google Scholar]
- 16.Sargent DJ, Chan V, Goldberg RM. A three-outcome design for phase II clinical trials. Control Clin Trials. 2001;22:117–25. doi: 10.1016/s0197-2456(00)00115-x. [DOI] [PubMed] [Google Scholar]
- 17.Benjamini Y, Hochberg Y. Controlling the false discovery rate: a practical and powerful approach to multiple testing. J R Statist Soc B. 1995;57:289–300. [Google Scholar]
- 18.Pope WB, Qiao XJ, Kim HJ, Lai A, Nghiemphu P, Xue X, et al. Apparent diffusion coefficient histogram analysis stratifies progression-free and overall survival in patients with recurrent GBM treated with bevacizumab: a multi-center study. J Neurooncol. 2012;108:491–8. doi: 10.1007/s11060-012-0847-y. [DOI] [PMC free article] [PubMed] [Google Scholar]
- 19.Ellingson BM, Cloughesy TF, Lai A, Mischel PS, Nghiemphu PL, Lalezari S, et al. Graded functional diffusion map-defined characteristics of apparent diffusion coefficients predict overall survival in recurrent glioblastoma treated with bevacizumab. Neuro Oncol. 2011;13:1151–61. doi: 10.1093/neuonc/nor079. [DOI] [PMC free article] [PubMed] [Google Scholar]
- 20.Nghiemphu PL, Liu W, Lee Y, Than T, Graham C, Lai A, et al. Bevacizumab and chemotherapy for recurrent glioblastoma: a single-institution experience. Neurology. 2009;72:1217–22. doi: 10.1212/01.wnl.0000345668.03039.90. [DOI] [PMC free article] [PubMed] [Google Scholar]
- 21.Wu W, Lamborn KR, Buckner JC, Novotny PJ, Chang SM, O'Fallon JR, et al. Joint NCCTG and NABTC prognostic factors analysis for high-grade recurrent glioma. Neuro Oncol. 2010;12:164–72. doi: 10.1093/neuonc/nop019. [DOI] [PMC free article] [PubMed] [Google Scholar]
- 22.Taal W, Oosterkamp HM, Walenkamp AME, Victor Beerepoot L, Hanse M, Buter J, et al. A randomized phase II study of bevacizumab versus bevacizumab plus lomustine versus lomustine single agent in recurrent glioblastoma: The Dutch BELOB study. J Clin Oncol. 2013;31:114s. [Google Scholar]
- 23.Maree Field K, Simes J, Wheeler H, Hovey EJ, Nowak AK, Cher L, et al. A randomized phase II study of carboplatin and bevacizumab in recurrent glioblastoma multiforme (CABARET) J Clin Oncol. 2013;31:118s. [Google Scholar]
- 24.Stark-Vance V. Bevacizumab and CPT-11 in the treatment of relapsed malignant glioma [abstract 369] Neuro Oncol. 2005;7 [Google Scholar]
- 25.Lorgis V, Maura G, Coppa G, Hassani K, Taillandier L, Chauffert B, et al. Relation between bevacizumab dose intensity and high-grade glioma survival: a retrospective study in two large cohorts. J Neurooncol. 2012;107:351–8. doi: 10.1007/s11060-011-0748-5. [DOI] [PubMed] [Google Scholar]
- 26.Raval S, Hwang S, Dorsett L. Bevacizumab and irinotecan in patients (pts) with recurrent glioblastoma multiforme (GBM). J Clin Oncol; ASCO Annual Meeting Proceedings Part I; 2007; p. 2078. [Google Scholar]
- 27.Kabbinavar F, Hurwitz HI, Fehrenbacher L, Meropol NJ, Novotny WF, Lieberman G, et al. Phase II, randomized trial comparing bevacizumab plus fluorouracil (FU)/leucovorin (LV) with FU/LV alone in patients with metastatic colorectal cancer. J Clin Oncol. 2003;21:60–5. doi: 10.1200/JCO.2003.10.066. [DOI] [PubMed] [Google Scholar]
- 28.Nabors LB, Supko JG, Rosenfeld M, Chamberlain M, Phuphanich S, Batchelor T, et al. Phase I trial of sorafenib in patients with recurrent or progressive malignant glioma. Neuro Oncol. 2011;13:1324–30. doi: 10.1093/neuonc/nor145. [DOI] [PMC free article] [PubMed] [Google Scholar]
- 29.Azad NS, Posadas EM, Kwitkowski VE, Steinberg SM, Jain L, Annunziata CM, et al. Combination targeted therapy with sorafenib and bevacizumab results in enhanced toxicity and antitumor activity. J Clin Oncol. 2008;26:3709–14. doi: 10.1200/JCO.2007.10.8332. [DOI] [PMC free article] [PubMed] [Google Scholar]
- 30.Lee JM, Sarosy GA, Annunziata CM, Azad N, Minasian L, Kotz H, et al. Combination therapy: intermittent sorafenib with bevacizumab yields activity and decreased toxicity. Br J Cancer. 2010;102:495–9. doi: 10.1038/sj.bjc.6605514. [DOI] [PMC free article] [PubMed] [Google Scholar]
- 31.Feldman DR, Ginsberg MS, Baum M, Flombaum C, Hassoun H, Velasco S, et al. Phase I trial of bevacizumab plus sunitinib in patients with metastatic renal cell carcinoma. J Clin Oncol. 2008;26 doi: 10.1200/JCO.2008.19.0108. abstr 5100. [DOI] [PMC free article] [PubMed] [Google Scholar]
- 32.Schneider BP, Wang M, Radovich M, Sledge GW, Badve S, Thor A, et al. Association of vascular endothelial growth factor and vascular endothelial growth factor receptor-2 genetic polymorphisms with outcome in a trial of paclitaxel compared with paclitaxel plus bevacizumab in advanced breast cancer: ECOG 2100. J Clin Oncol. 2008;26:4672–8. doi: 10.1200/JCO.2008.16.1612. [DOI] [PMC free article] [PubMed] [Google Scholar]
- 33.Loupakis F, Ruzzo A, Salvatore L, Cremolini C, Masi G, Frumento P, et al. Retrospective exploratory analysis of VEGF polymorphisms in the prediction of benefit from first-line FOLFIRI plus bevacizumab in metastatic colorectal cancer. BMC Cancer. 2011;11:247. doi: 10.1186/1471-2407-11-247. [DOI] [PMC free article] [PubMed] [Google Scholar]
- 34.Jain L, Sissung TM, Danesi R, Kohn EC, Dahut WL, Kummar S, et al. Hypertension and hand-foot skin reactions related to VEGFR2 genotype and improved clinical outcome following bevacizumab and sorafenib. J Exp Clin Cancer Res. 2010;29:95. doi: 10.1186/1756-9966-29-95. [DOI] [PMC free article] [PubMed] [Google Scholar]
Associated Data
This section collects any data citations, data availability statements, or supplementary materials included in this article.