Abstract
Context:
Pathologists grade follicular lymphoma (FL) cases by selecting 10, random high power fields (HPFs), counting the number of centroblasts (CBs) in these HPFs under the microscope and then calculating the average CB count for the whole slide. Previous studies have demonstrated that there is high inter-reader variability among pathologists using this methodology in grading.
Aims:
The objective of this study was to explore if newly available digital reading technologies can reduce inter-reader variability.
Settings and Design:
In this study, we considered three different reading conditions (RCs) in grading FL: (1) Conventional (glass-slide based) to establish the baseline, (2) digital whole slide viewing, (3) digital whole slide viewing with selected HPFs. Six board-certified pathologists from five different institutions read 17 FL slides in these three different RCs.
Results:
Although there was relative poor consensus in conventional reading, with lack of consensus in 41.2% of cases, which was similar to previously reported studies; we found that digital reading with pre-selected fields improved the inter-reader agreement, with only 5.9% lacking consensus among pathologists.
Conclusions:
Digital whole slide RC resulted in the worst concordance among pathologists while digital whole slide reading selected HPFs improved the concordance. Further studies are underway to determine if this performance can be sustained with a larger dataset and our automated HPF and CB detection algorithms can be employed to further improve the concordance.
Keywords: Centroblast, follicular lymphoma, inter-reader variability, whole-slide images
INTRODUCTION
Follicular lymphoma (FL) is the second most common B-cell lymphoma affecting adults in the Western world.[1] FL is characterized by a highly variable clinical course that ranges from stable, indolent lymphoma that may subsequently progress to a more aggressive disease to a disease that behaves aggressively from the outset. Patients with indolent FL who are asymptomatic are usually not treated since there is no evidence that early therapy with currently available regimens provides benefit to these patients.[2,3,4,5,6,7,8] Such a “watch and wait” approach spares patients unnecessary therapy associated toxicity while allowing timely intervention when FL related symptoms develop and/or the disease progresses.[2,7,8] In contrast, patients who present with an aggressive form of FL at diagnosis often require immediate therapy to alleviate disease-related symptoms.[8,9,10] Understandably this marked clinical heterogeneity requires accurate risk stratification of all FL cases to guide the oncologist's clinical decision-making.
FL patients are risk-stratified according to clinical criteria using disease stage,[8] Follicular Lymphoma International Prognostic Index score[11] and histological grading.[12] Histological grading is performed according to the morphologic criteria of Mann-Berard, which have been adapted by the World Health Organization (WHO) classification.[13] In this grading system FL cases are divided into low grade (grade I and II) and high grade (grade IIIA and IIIB) based on the average count of centroblasts (CBs) per standard microscopic high power field (HPF). The CB count is manually performed by a pathologist in 10 random HPFs containing malignant follicles. FL cases with an average CB count from 0 to 15/HPF are classified as low grade and those with an average CB count of more than 15/HPF as grade III. Grade III is further subdivided into grade IIIA (demonstrating a mixed population of CBs and centrocytes) and grade IIIB (demonstrating a homogeneous population of CBs). As expected, this grading system performs well at the extreme ends of the spectrum with gradation of FL between grade I and grade IIIB being fairly reproducible. However, histological grading of FL cases at the interface between grade II and grade IIIA suffers from poor reproducibility even at the hands of expert hematopathologists.[14] This limitation of FL histological grading is very important since a large number of FL patients fall into a category bordering between low and high grade, can affect clinical management with a “watch and wait” approach versus chemotherapy.
Of the several factors impacting an accurate manual grading of FL based on CB count, the most important is the limitation of the human reader. Even when applying stringent criteria to categorize cells as CBs, human readers are prone to variable interpretation of specific cells as CBs and non-CBs that results in low accuracy and reproducibility of CB counts using unaided light microscope glass slide review. Moreover, since CB count is limited to 10 random HPF (by practical necessity) the heterogeneity of cell types present in a single FL can easily be under-represented. Recent development of high resolution imaging of histological slides and digital pathology techniques creates an opportunity to aid pathologists in accurate and reproducible FL grading. In this paper, we present the impact of digitization of FL cases on the accuracy and reproducibility of histological grading among six experienced hematopathologists. Similar to a previous study,[14] inter-pathologist variability in the glass slide readings was high as was the case when the pathologists viewed the whole slide digital images. However, superior inter-pathologist concordance was observed when pathologists were presented with the same HPFs and were obligated to mark cells counted as CBs.
Inter-reader variability in the grading of FL has previously been documented utilizing only conventional methods, i.e., glass slides, read under the microscope. In a study by The Non-Hodgkin's Lymphoma Classification Project, five pathologists reviewed 304 FL cases comprising grades I, II and III. On average, the individual pathologists agreed with the consensus diagnosis only 61-73% of the time (depending on grade) and immunophenotyping did not significantly add to the accuracy of the diagnosis.[15] In a similar study involving seven pathologists and 105 cases, Metter et al., found that for approximately half the cases (51%), the CB count range was more than 10 per HPF across pathologists and this range was more than 20/HPF for 29% of the cases.[14] With the recent widespread availability of digital whole-slide scanners, it is now possible to digitally capture, view, annotate and evaluate FL images. The use of digital images may help improve the accuracy and thus clinical utility of FL histologic grading.
SUBJECTS AND METHODS
Database
17 FL cases were selected from the archives of the first author's institution with IRB approval. These cases were randomly selected to represent different FL grades based on the existing pathology reports. All tissues were formalin-fixed, paraffin-embedded and hematoxylin and eosin (H and E) stained. One representative slide from each case was selected (by the first author) and used for this study, i.e., 17 slides were read. Each slide was scanned and converted to a digital image using an Aperio (Vista, CA) ScanScope scanner at ×40 magnification, which results in 0.23 μm per pixel resolution [Figure 1]. Following the acquisition of digital slides, one pathologist selected 10 HPFs (HPFs, approximately 0.159 mm2 area) from each image. The HPFs were randomly selected from the areas representing malignant follicles in accordance with the WHO recommendations.
Figure 1.
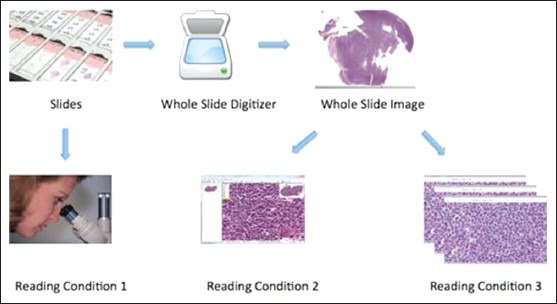
Three different reading conditions (RCs): RC1 is conventional reading; in RC2, whole slide digital images are read by the pathologist; in RC3, selected high-power-fields are read by the pathologist
Reading Methodologies
Six board certified hematopathologists with at least 10 years of experience examined the 17 FL cases under three different reading conditions (RC1-3): Glass, digital whole slide and digital selected fields [Figure 1]. At least three months passed between reading experiments and prior to each reading the order of the slides was randomized to minimize the possibility of remembering cases.
RC1. Glass slide reading: This is the conventional and clinically accepted method of reading glass slides using a microscope following the standard WHO guidelines. The pathologists counted and recorded the number of CBs in 10 self-selected random fields representing malignant follicles according to the WHO recommendations and the project statistician computed the average number of CBs across the 10 fields. All the pathologists used the same type of microscope (Olympus Plan 40x-0263) equipped with a 40x dry objective (ocular: WH10x/22). The pathologists were instructed to use the WHO definition of CBs.[12] If more than 20 CBs were counted in a field, the count was rounded to 25 (if count between 21 and 30), 35 (if count between 31 and 40), 45 (if count between 41 and 50), or 55 (if count greater than 50) in computing the mean. Grade was determined using standard WHO guidelines: Average CBs per field ≤ 5 = Grade I; 6-15 = Grade II; >15 = Grade III. In order to make the counting practical, these limits were established; otherwise, pathologists cannot finish this study in a reasonable amount of time.
RC2. Digital whole slide reading: Digital whole slide readings followed a similar protocol to RC1 except that the readings took place on a computer rather than under a microscope using the ImageScope software [Figure 2]. Pathologists self-selected 10 HPFs and recorded the number of CBs for each selected field. The size of each selected area was adjusted to be equivalent to 0.159 mm2 so that they were equivalent in the area to images viewed under the microscope although different in shape (circular under the microscope while rectangular on the computer screen). The equivalent area was calculated in pixels for digital reading. The workstation parameters were fixed and all the readers used the same software developed by our lab. In our experiments to standardize CB counting, we used one type of microscope and its digital equivalent for all readers and for all samples tested.
Figure 2.
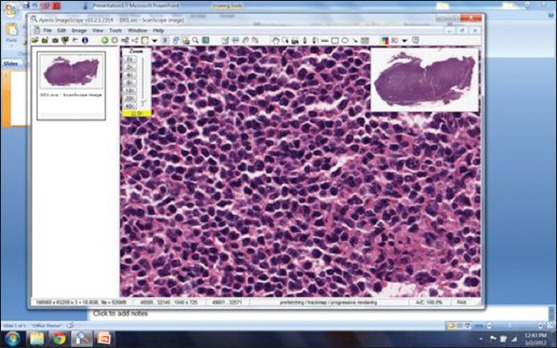
Screen shot of the freely available commercial program (Imagescope, Aperio, Vista, CA) used for the digital evaluation slides for this study (reading condition 2 - RC2)
RC3. Digital selected field reading: Finally, in the digital selected field readings, pathologists read the same fields randomly pre-selected by one of the pathologists. The selected fields were devoid of identifiers in order to blind the pathologists and the mean CBs per field was computed by the project statistician after data collection was completed. Selected images were marked using in-house developed software called CBMarker [Figure 3]. This software lets the pathologist connect to a secure server to mark individual CB locations by a simple mouse click on a selected HPF image. If a location is accidentally marked (i.e., wrong mouse click) then the erroneous marking can be easily deleted by clicking again on the same location. The image, marking location and marking pathologist information were recorded.
Figure 3.
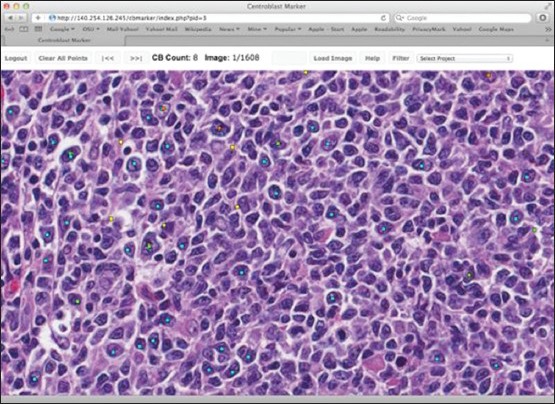
Centroblast (CB) marker: The program to mark the locations of CBs on a high power field image reading condition 3
Statistical Design and Methods
Variability in grade was determined using two metrics: (1) Number of cases for which the grade ranged from I to III across pathologists and (2) number of cases without a consensus (less than four pathologists agreed on grade I, II, or III). Exact Cochran's Q Tests were used to determine if either metric differed significantly across RCs and McNemar's tests were used to perform pairwise comparisons of the conditions.[16] In the pairwise comparisons, P values were corrected for multiple comparisons using Holm's method.[17] Kappa statistics were used to measure agreement between pathologists in WHO grade and clinically significant grade (Grade I or II vs. III). Landis and Koch guidelines were used to assess the level of agreement: <0 poor, 0-0.2 slight, 0.21-0.40 fair, 0.41-0.60 moderate, 0.61-0.80 substantial and > 0.80 almost perfect agreement.[18] We also calculated the number of cases for which each pathologist agreed with the consensus diagnosis of clinically significant grade (4 or more pathologists agreed on grade I/II or III) and compared results across RCs using repeated measures ANOVA.
In a separate set of analyses, we compared variability and performance in counting CBs across the three RC1-3. For each RC, the variability in the number of CBs per HPF was examined by calculating the range across pathologists. Pathologist performance in counting CBs was measured using the number of cases in which the pathologist's average CB count was more than 10 CBs greater than the mean across pathologists; a difference of 10 CBs is clinically significant as it could mean a two grade difference. The same approach to measuring variability and performance in counting CBs was used by Metter et al.[14] In both analyses, we compared the different RCs using repeated measures ANOVA and Tukey multiple comparisons of the means.[19] In the case of the range, the data were log transformed prior to analysis.
RESULTS
Table 1 summarizes the variability in WHO grade. When the pathologists had the freedom to select their own fields (glass and digital whole slide readings) over 35% of the cases had a grade range of I-III (i.e., at least one pathologist graded as I while at least one other pathologist graded as III) across pathologists and no consensus was reached for over 41%. However, when the pathologists were all enabled to read the same fields, there was only one case of non-consensus and two cases of grade range I-III, although only the first result was statistically significant (P < 0.01 for the difference across RCs).
Table 1.
Variability in WHO Grade (I, II, or III) across pathologists (6 pathologists, 17 cases)

Inter-pathologist agreement in WHO grade was measured using pairwise Kappa statistics. As seen in Table 2, agreement on grade I, II and III was best when the pathologists read in RC3 with a median Kappa of 0.64, which indicates substantial agreement and even the worst agreement in RC3 (0.41) was moderate according to the Landis and Koch guidelines.[18] In contrast, agreements in RC1 were mostly fair (0.21 ≤ Kappa ≤ 0.40) and slight (0 ≤ Kappa ≤ 0.2); and agreements in RC2 were mostly slight or poor (Kappa < 0). Furthermore, with two exceptions, the agreement between each pair of pathologists was greatest in RC3 (see Figure 4 for RC1 vs. RC3 comparison; a similar trend was observed for RC2 vs. RC3). The average agreement in clinically significant grade (Grade I/II vs. III) was similar between RC1 and RC3 [Table 2] and neither was consistently superior to the other in terms of agreement of the individual pairs of pathologists [Figure 5].
Table 2.
Kappa statistics measuring inter-rater agreement

Figure 4.
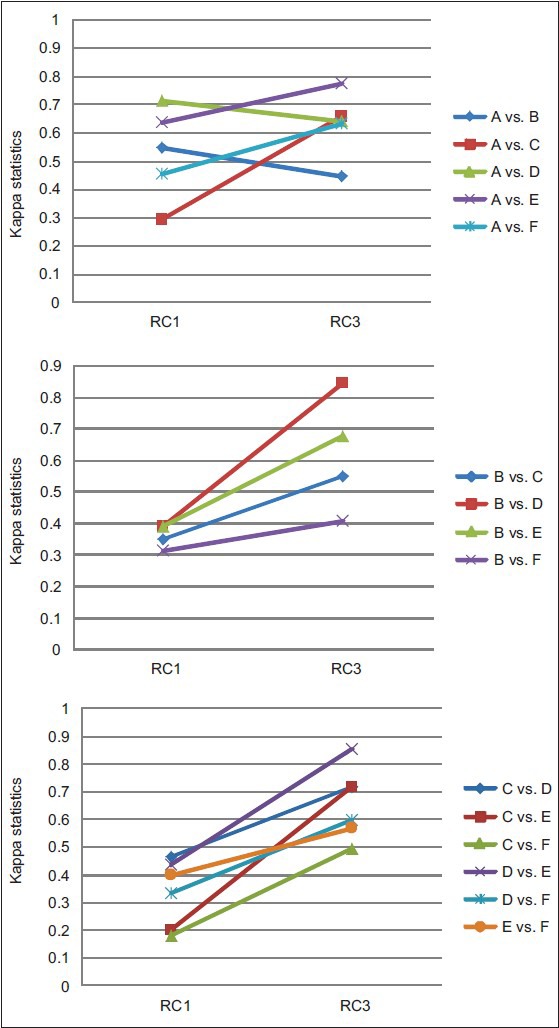
Graphical representation of difference in Kappa coefficients between reading condition (RC1) and RC3 readings: Agreement on grades I, II and III
Figure 5.
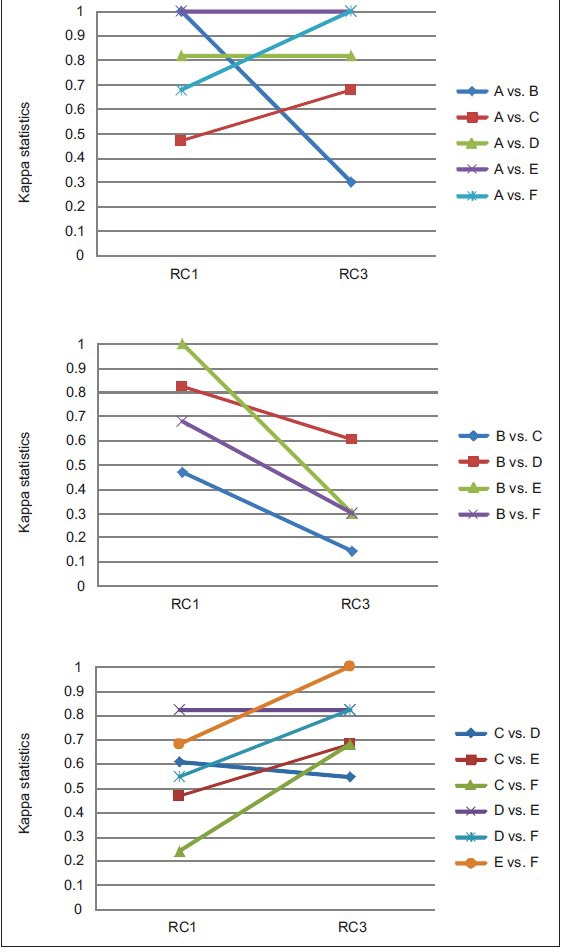
Agreement on clinically significant grade
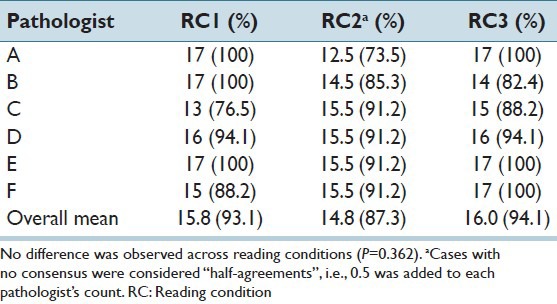
Performance of individual pathologists was measured in terms of agreement with consensus diagnosis of clinically significant grade. The consensus diagnoses for the RC1 and RC3 were identical: 14 grade I/II and 3 grade III. In the digital whole slide readings (RC2), the same 14 low grade cases were identified as low grade (i.e., as grades I or II), but no consensus was reached for the three cases identified as high grade in the other two RCs. The percentage of times each pathologist was in agreement with consensus is provided in Table 3. The average agreement with consensus was greatest for the selected field readings (RC3), but not significantly so (P = 0.331).
Table 3.
Number cases (%) in agreement with consensus diagnosis of clinically significant grade
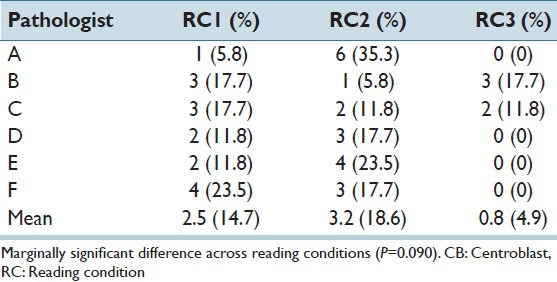
We also considered inter-pathologist variability and performance of pathologists in counting CBs. Histograms of the range in number of CBs per HPF by RC are provided in Figure 6. Ranges observed for the RC3 readings were smaller than both the RC1 and RC2 readings (P < 0.05). Pathologist performance in counting CBs was also best in the selected field readings. In the whole slide readings (RC1 and RC2), most pathologists were more than 10 CBs off from the overall mean for at least two cases [Table 4]. Under the selected field condition (RC3), only two pathologists provided counts that were more than 10 CBs from the overall mean, although the overall differences across RCs were only marginally significant (P = 0.09).
Figure 6.
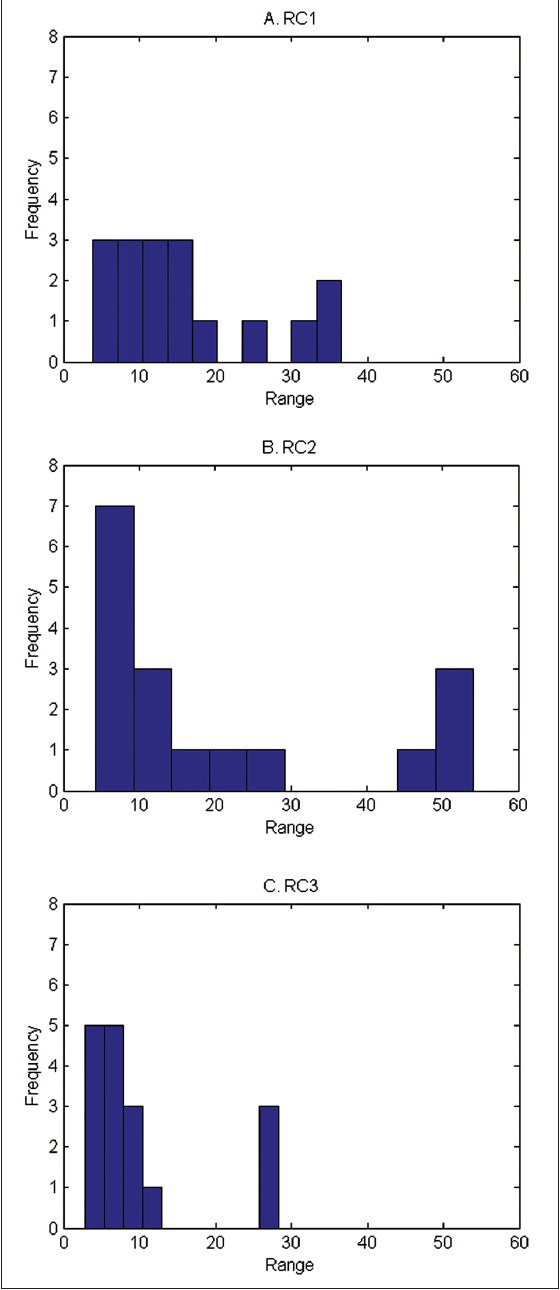
Histograms of range in number of centroblasts/high power field across pathologists
Table 4.
Number (%) of cases in which mean CB count was>10 cells different from the overall mean across pathologists
DISCUSSION
The most important finding of this study was that digital reading with pre-selected HPF improved –compared with the standard practice-the inter-reader agreement among pathologists grading FL cases and that whole slide digital reading worsened the consensus. In order to arrive at this conclusion, we designed an experiment with six board-certified pathologists from five different institutions and asked these pathologists to read 17 slides under three RCs. The first RC was the conventional reading, i.e., Pathologists read the slides according to the WHO criteria using their microscope. The second and the third RCs were digital whole slide readings without and with previously selected HPFs, respectively. While there was relatively poor consensus in conventional reading (lack of consensus in 41.2% of cases) similar to previously reported studies, we found that digital reading with pre-selected fields improved the inter-reader agreement, with only 5.9% lacking consensus among pathologists.
As explained in the Introduction and as the results of study again confirmed, current methods for grading FL suffer from high pathologist-to-pathologist variability. One of the major contributors to this variability is the fact that there are no specific guidelines for choosing the fields used to generate the CB count, which determines the grade. Hence, there is a great deal of heterogeneity in the location of the fields chosen. In this study, we have shown that the inter-subject variability in CB counts can be improved by enabling pathologists to view the same fields thereby improving agreement on grade. These results highlight the need for computer-aided diagnostic systems, which provide pathologists with consistent information obtained through objective algorithms, which may be used for the selection of fields or identification of cells or regions of interest.
There are active research programs in the computer-aided grading (CaG) of FL cases.[20,21,22,23,24,25,26,27,28,29,30,31,32,33,34,35,36,37,38,39,40,41,42,43,44,45,46,47] Particularly, there are efforts to examine the computational and human factor aspects of CaG,[34,35,36,37,38,39,40,41] to develop multi-resolution and multi-classifier approaches to emulate expert cognitive functioning,[42,43,44,45,46] to investigate novel segmentation methods to identify follicles both in H and E and IHC images,[23,24,27,31] methods to register multi-stain images[26] and detect cells.[21,22,29,31,33,47] These studies showed that such systems could identify the most aggressive FL (grade III) with 98.9% sensitivity and 98.7% specificity and the overall classification accuracy of the system was 85.5%.[30] These methods were all designed to help pathologists perform the current grading system more accurately and consistently. While these efforts are on-going, this current study provided us with insight into the main factors that cause inter-reader variability and also what type of digital reading strategy should be followed.
Although digital slides are currently available and are widely used as teaching resources and for research purposes, they are not routinely used for clinical diagnosis. Current research is focusing on both how pathologists can use them in their clinical studies and what the optimal RCs should be. In this study, we used two digital RCs (RC2 – digital whole slide reading and RC3 – digital selected field reading). Our inter-pathologist agreement measures [Table 2] indicate that RC2 actually results in inferior results than current conventional reading. However, another digital reading strategy (RC3) resulted in improved agreement. To our knowledge, this is the first time that a particular digital RC has shown to improve agreement among pathologists.
Whole slide digital imaging is studied to see if it can potentially replace traditional microscopy. For example, in a study Ho et al., traditional and whole slide imaging (WSI) methods were found to be comparable when reviewing 24 full genitourinary cases (including 47 surgical parts and 391 slides).[48] In our case, we determined that the consensus was negatively affected by the WSI. There may be several factors contributing to this result. WSI reading is not commonly done and our pathologists were not used to seeing these. Therefore, human computer interaction and design factors might have played a large role in this. Larger studies with different protocols need to be carried out to further elucidate the reasons.
Improvement in concordance observed for RC3 relative to RC1 can be due to two main factors. First, by enabling pathologists to read exactly the same field, the variability due to the selection of different fields is removed. It is well-known that many tumors contain heterogeneity in cellular distribution and depending on which areas of the slide each pathologist selects, there can be great variation in the average number of CBs noted. Therefore, even if the pathologists are very accurate in their readings, they might be viewing portions of the tissue that reflect different CB counts. The second potential factor is due to the fact that in RC3, errors due to counting are minimized; the CB counting is done on the computer and pathologists have visual cues (i.e., a dot in a marked location) to indicate, which areas of the HPF they have already reviewed and whether a particular cell has already been counted or not. Future studies need to be designed to determine which of these factors play a more important role in improved concordance in pathologists’ grading of FL.
The current study suggests a three-phased implementation of a digital reading strategy. In the first phase, well-tested algorithms for the detection of follicles can be used to select 10, random HPFs for the pathologist. By consistently selecting these 10 HPFs, digital reading will improve the concordance of pathologists. In the second phase, these 10 HPFs could be selected by the help of a computer system, which can make sure that the selected fields represent the heterogeneity of the slide. This is expected to reduce the selection bias. In the third phase, detection of CBs in either selected fields or in the whole slide can be carried out with the help of the computer. These detections, can be incorporated in R3 so that pathologists can be presented with cells marked as CB by the computer and/or be given an indication of which grade a particular slide represents according to the computer image analysis. The effect of such systems on the accuracy and concordance need to be determined in future human reader studies.
There were several limitations in our study. First, the number of cases was relatively small. Three different modes of reading were employed, two of which involved digital reading, which is not currently used in clinical practice. In addition none of our readers had prior experience with digital reading. Lack of experience in reviewing digital images combined with the fact that each CB had to be individually marked electronically increased the amount of time each pathologist spent on each case several times more than conventional reading. In our future work, we plan to increase the number of cases and re-assess inter-reader variability among pathologists. Second, all the cases in this study were collected from a single institution with a single method of tissue processing, sectioning and staining. Therefore, these results may or may not be applicable to other cases selected from different institutions. Since the results of our study are comparable to previous studies in conventional reading, we expect this to be a minor limitation. However, future studies will need to include cases from multiple institutions. Third, the selected fields in RC1 could be the same; such an approach would allow us to focus on the digital versus glass comparison. However, for this study's scope such an approach is not practical.
ACKNOWLEDGMENT
The project described was supported in part by Award Number R01CA134451 from the National Cancer Institute. The content is solely the responsibility of the authors and does not necessarily represent the official views of the National Cancer Institute, or the National Institutes of Health.
Footnotes
Available FREE in open access from: http://www.jpathinformatics.org/text.asp?2013/4/1/30/120747
REFERENCES
- 1.Anderson JR, Armitage JO, Weisenburger DD. Epidemiology of the non-Hodgkin's lymphomas: Distributions of the major subtypes differ by geographic locations. Non-Hodgkin's Lymphoma Classification Project. Ann Oncol. 1998;9:717–20. doi: 10.1023/a:1008265532487. [DOI] [PubMed] [Google Scholar]
- 2.López-Guillermo A, Caballero D, Canales M, Provencio M, Rueda A, Salar A, et al. Clinical practice guidelines for first-line/after-relapse treatment of patients with follicular lymphoma. Leuk Lymphoma. 2011;52(Suppl 3):1–14. doi: 10.3109/10428194.2011.629897. [DOI] [PubMed] [Google Scholar]
- 3.Ardeshna KM, Smith P, Norton A, Hancock BW, Hoskin PJ, MacLennan KA, et al. Long-term effect of a watch and wait policy versus immediate systemic treatment for asymptomatic advanced-stage non-Hodgkin lymphoma: A randomised controlled trial. Lancet. 2003;362:516–22. doi: 10.1016/s0140-6736(03)14110-4. [DOI] [PubMed] [Google Scholar]
- 4.Horning SJ, Rosenberg SA. The natural history of initially untreated low-grade non-Hodgkin's lymphomas. N Engl J Med. 1984;311:1471–5. doi: 10.1056/NEJM198412063112303. [DOI] [PubMed] [Google Scholar]
- 5.Brice P, Bastion Y, Lepage E, Brousse N, Haïoun C, Moreau P, et al. Comparison in low-tumor-burden follicular lymphomas between an initial no-treatment policy, prednimustine, or interferon alfa: A randomized study from the Groupe d’Etude des Lymphomes Folliculaires. Groupe d’Etude des Lymphomes de l’Adulte. J Clin Oncol. 1997;15:1110–7. doi: 10.1200/JCO.1997.15.3.1110. [DOI] [PubMed] [Google Scholar]
- 6.Colombat P, Salles G, Brousse N, Eftekhari P, Soubeyran P, Delwail V, et al. Rituximab (anti-CD20 monoclonal antibody) as single first-line therapy for patients with follicular lymphoma with a low tumor burden: Clinical and molecular evaluation. Blood. 2001;97:101–6. doi: 10.1182/blood.v97.1.101. [DOI] [PubMed] [Google Scholar]
- 7.Colombat P, Brousse P, Morschhauser F, Franchi-Rezgui P. Single treatment with rituximab monotherapy for low-tumor burden follicular lymphoma (FL): Survival analyses with extended follow-up of 7 years. Blood. 2006;108:147a. [Google Scholar]
- 8.National Comprehensive Cancer Network. Clinical Practice Guidelines in Oncology Non-Hodgkin's Lymphoma. Version. 2. 2012 [Google Scholar]
- 9.Dreyling M ESMO Guidelines Working Group. Newly diagnosed and relapsed follicular lymphoma: ESMO clinical recommendations for diagnosis, treatment and follow-up. Ann Oncol. 2009;20(Suppl 4):119–20. doi: 10.1093/annonc/mdp148. [DOI] [PubMed] [Google Scholar]
- 10.Bierman PJ. Natural history of follicular grade 3 non-Hodgkin's lymphoma. Curr Opin Oncol. 2007;19:433. doi: 10.1097/CCO.0b013e3282c9ad78. [DOI] [PubMed] [Google Scholar]
- 11.Solal-Céligny P, Roy P, Colombat P, White J, Armitage JO, Arranz-Saez R, et al. Follicular lymphoma international prognostic index. Blood. 2004;104:1258–65. doi: 10.1182/blood-2003-12-4434. [DOI] [PubMed] [Google Scholar]
- 12.Swerdlow SH, Campo E, Harris NL, Jaffe ES, Pileri SA, Stein H, et al. Geneva: WHO Press; 2008. WHO Classification of Tumors of Hematopoietic and Lymphoid Tissue. [Google Scholar]
- 13.Mann RB, Berard CW. Criteria for the cytologic subclassification of follicular lymphomas: A proposed alternative method. Hematol Oncol. 1983;1:187–92. doi: 10.1002/hon.2900010209. [DOI] [PubMed] [Google Scholar]
- 14.Metter GE, Nathwani BN, Burke JS, Winberg CD, Mann RB, Barcos M, et al. Morphological subclassification of follicular lymphoma: Variability of diagnoses among hematopathologists, a collaborative study between the Repository Center and Pathology Panel for Lymphoma Clinical Studies. J Clin Oncol. 1985;3:25–38. doi: 10.1200/JCO.1985.3.1.25. [DOI] [PubMed] [Google Scholar]
- 15.A clinical evaluation of the International Lymphoma Study Group classification of non-Hodgkin's lymphoma. The non-Hodgkin's lymphoma classification project. Blood. 1997;89:3909–18. [PubMed] [Google Scholar]
- 16.Patil KD. Cochran's Q test: Exact distribution. J Am Stat Assoc. 1975;70:186–9. [Google Scholar]
- 17.Holm S. A simple sequentially rejective multiple test procedure. Scand J Stat. 1979;6:65–70. [Google Scholar]
- 18.Landis JR, Koch GG. The measurement of observer agreement for categorical data. Biometrics. 1977;33:159–74. [PubMed] [Google Scholar]
- 19.Hochberg Y, Tamhane AC. Vol. 82. New York: NY Wiley Online Library; 1987. Multiple Comparison Procedures. [Google Scholar]
- 20.Akakin H, Kong H, Elkins C, Hemminger J, Miller B, Ming J, et al. Vol. 8315. San Diego, CA: Proceedings of SPIE Medical Imaging Conference, Feb. 4, 2012; 2012. Automated detection of cells from immunohistochemically-stained tissues: Application to Ki-67 nuclei staining. [Google Scholar]
- 21.Belkacem-Boussaid K, Pennell M, Lozanski G, Shana’aah A, Gurcan M. Rotterdam, The Netherlands: 2010. Effect of pathologist agreement on evaluating a computer-assisted system: Recognizing centroblasts in follicular lymphoma cases. Proceedings of IEEE ISBI 2010: Biomedical Imaging from Nano to Macro; pp. 1411–4. [Google Scholar]
- 22.Belkacem-Boussaid K, Pennell M, Lozanski G, Shana’ah A, Gurcan M. Computer-aided classification of centroblast cells in follicular lymphoma. Anal Quant Cytol Histol. 2010;32:254–60. [PMC free article] [PubMed] [Google Scholar]
- 23.Belkacem-Boussaid K, Prescott J, Lozanski G, Gurcan MN. Vol. 7624. San Diego CA: SPIE Medical Imaging 2010: Computer-Aided Diagnosis; 2010. Segmentation of follicular regions on H and E slides using a matching filter and active contour model. [Google Scholar]
- 24.Belkacem-Boussaid K, Samsi S, Lozanski G, Gurcan MN. Automatic detection of follicular regions in H and E images using iterative shape index. Comput Med Imaging Graph. 2011;35:592–602. doi: 10.1016/j.compmedimag.2011.03.001. [DOI] [PMC free article] [PubMed] [Google Scholar]
- 25.Belkacem-Boussaid K, Sertel O, Lozanski G, Shana’aah A, Gurcan M. Extraction of color features in the spectral domain to recognize centroblasts in histopathology. Conf Proc IEEE Eng Med Biol Soc. 2009;2009:3685–8. doi: 10.1109/IEMBS.2009.5334727. [DOI] [PMC free article] [PubMed] [Google Scholar]
- 26.Cooper L, Sertel O, Kong J, Lozanski G, Huang K, Gurcan M. Feature-based registration of histopathology images with different stains: An application for computerized follicular lymphoma prognosis. Comput Methods Programs Biomed. 2009;96:182–92. doi: 10.1016/j.cmpb.2009.04.012. [DOI] [PMC free article] [PubMed] [Google Scholar]
- 27.Samsi S, Lozanski G, Shana’ah A, Krishanmurthy AK, Gurcan MN. Detection of follicles from IHC-stained slides of follicular lymphoma using iterative watershed. IEEE Trans Biomed Eng. 2010;57:2609–12. doi: 10.1109/TBME.2010.2058111. [DOI] [PMC free article] [PubMed] [Google Scholar]
- 28.Samsi SS, Krishnamurthy AK, Groseclose M, Caprioli RM, Lozanski G, Gurcan MN. Imaging mass spectrometry analysis for follicular lymphoma grading. Conf Proc IEEE Eng Med Biol Soc. 2009;2009:6969–72. doi: 10.1109/IEMBS.2009.5333850. [DOI] [PubMed] [Google Scholar]
- 29.Sertel O, Catalyurek UV, Lozanski G, Shanaah A, Gurcan MN. Istanbul: Turkey: 2010 20th International Conference on Pattern Recognition (ICPR); 2010. An image analysis approach for detecting malignant cells in digitized H and E-stained histology images of follicular lymphoma; pp. 273–6. [Google Scholar]
- 30.Sertel O, Kong J, Catalyurek U, Lozanski G, Saltz J, Gurcan M. Histopathological image analysis using model-based intermediate representations and color texture: Follicular lymphoma grading. J Signal Process Syst. 2009;55:169–83. [Google Scholar]
- 31.Sertel O, Kong J, Lozanski G, Catalyurek U, Saltz JH, Gurcan MN. Vol. 6915. San Diego: CA: SPIE Medical Imaging 2008: Computer-Aided Diagnosis; 2008. Computerized microscopic image analysis of follicular lymphoma; pp. 1–11. [Google Scholar]
- 32.Sertel O, Kong J, Lozanski G, Shanaah A, Gewirtz A, Racke F, et al. Computer-assisted grading of follicular lymphoma: High grade differentiation. Mod Pathol. 2008;21:371A. [Google Scholar]
- 33.Sertel O, Lozanski G, Shana’ah A, Gurcan MN. Computer-aided detection of centroblasts for follicular lymphoma grading using adaptive likelihood-based cell segmentation. IEEE Trans Biomed Eng. 2010;57:2613–6. doi: 10.1109/TBME.2010.2055058. [DOI] [PMC free article] [PubMed] [Google Scholar]
- 34.Cambazoglu B, Sertel O, Kong J, Saltz JH, Gurcan MN, Catalyurek UV. Monterey Bay, CA: ACM; 2007. Efficient processing of pathological images using the grid: Computer-aided prognosis of neuroblastoma. In: Proceedings of Fifth International Workshop on Challenges of Large Applications in Distributed Environments (CLADE) pp. 35–41. [Google Scholar]
- 35.Kumar VS, Kurc T, Kong J, Catalyurek U, Gurcan M, Saltz J. Austin: TX: 2007 IEEE International Conference on Cluster Computing; 2007. Performance vs. accuracy trade-offs for large-scale image analysis applications. [Google Scholar]
- 36.Ruiz A, Sertel O, Ujaldon M, Catalyurek U, Saltz J, Gurcan M. Silicon Valley, CA: Proc (IEEE Int Conf Bioinformatics Biomed); 2007. Pathological image analysis using the GPU: Stroma classification for neuroblastoma; pp. 78–85. [Google Scholar]
- 37.Ruiz A, Kong J, Ujaldon M, Boyer K, Saltz J, Gurcan M. Paris, France: IEEE ISBI; 2008. Pathological image segmentation for neuroblastoma using the GPU; pp. 296–9. [Google Scholar]
- 38.Kumar V, Narayanan S, Kurc T, Kong J, Gurcan M, Saltz J. Analysis and semantic querying in large biomedical image datasets - A set of techniques for analyzing, processing, and querying large biomedical image datasets uses semantic and spatial information. Comput IEEE Comput Mag. 2008;41:52–9. [Google Scholar]
- 39.Saltz J, Kurc T, Hastings S, Langella S, Oster S, Ervin D, et al. e-Science, caGrid, and Translational Biomedical Research. Computer (Long Beach Calif) 2008;41:58–66. doi: 10.1109/MC.2008.459. [DOI] [PMC free article] [PubMed] [Google Scholar]
- 40.Teodoro G, Sachetto R, Sertel O, Gurcan MN, Meira W, Catalyurek U, et al. New Orleans: LA: 2009 IEEE International Conference on Cluster Computing and Workshops; 2009. Coordinating the use of GPU and CPU for improving performance of compute intensive applications; pp. 437–46. [Google Scholar]
- 41.Patterson ES, Rayo M, Gill C, Gurcan MN. Barriers and facilitators to adoption of soft copy interpretation from the user perspective: Lessons learned from filmless radiology for slideless pathology. J Pathol Inform. 2011;2:1. doi: 10.4103/2153-3539.74940. [DOI] [PMC free article] [PubMed] [Google Scholar]
- 42.Kong J, Sertel O, Shimada H, Boyer K, Saltz J, Gurcan M. Computer-aided grading of neuroblastic differentiation: Multi-resolution and multi-classifier approach. IEEE Int Conf Image Proc. 2007;1-7:2777–80. [Google Scholar]
- 43.Kong J, Sertel O, Shimada H, Boyer KL, Saltz JH, Gurcan MN. Vol. 6915. San Diego: CA: SPIE Medical Imaging 2008: Computer-Aided Diagnosis; 2008. A multi-resolution image analysis system for computer-assisted grading of neuroblastoma differentiation; pp. 452–60. [Google Scholar]
- 44.Kong J, Sertel O, Shimada H, Boyer K, Saltz J, Gurcan M. Computer-aided evaluation of neuroblatoma on whole-slide histology images: Classifying grade of neuroblastic differentiation. Pattern Recognit. 2009;42:1080–92. doi: 10.1016/j.patcog.2008.10.035. [DOI] [PMC free article] [PubMed] [Google Scholar]
- 45.Sertel O, Kong J, Shimada H, Catalyurek UV, Saltz JH, Gurcan MN. Computer-aided prognosis of neuroblastoma on whole-slide images: Classification of stromal development. Pattern Recognit. 2009;42:1093–103. doi: 10.1016/j.patcog.2008.08.027. [DOI] [PMC free article] [PubMed] [Google Scholar]
- 46.Sertel O, Kong J, Shimada H, Catalyurek U, Saltz JH, Gurcan M. Vol. 6915. San Diego: CA: SPIE Medical Imaging 2008: Computer-Aided Diagnosis; 2008. Computer-aided prognosis of neuroblastoma: Classification of stromal development on whole-slide images; pp. 44–55. [Google Scholar]
- 47.Sertel O, Catalyurek UV, Shimada H, Gurcan MN. Computer-aided prognosis of neuroblastoma: Detection of mitosis and karyorrhexis cells in digitized histological images. Conf Proc IEEE Eng Med Biol Soc. 2009;2009:1433–6. doi: 10.1109/IEMBS.2009.5332910. [DOI] [PubMed] [Google Scholar]
- 48.Ho J, Parwani AV, Jukic DM, Yagi Y, Anthony L, Gilbertson JR. Use of whole slide imaging in surgical pathology quality assurance: Design and pilot validation studies. Hum Pathol. 2006;37:322–31. doi: 10.1016/j.humpath.2005.11.005. [DOI] [PubMed] [Google Scholar]


