Abstract
Purpose
To investigate the efficacy of a novel respiratory motion scheme, where only the center of k-space is gated using respiratory navigators, versus a fully respiratory-gated acquisition for 3D flow imaging.
Methods
3D flow images were acquired axially using a GRE sequence in a volume covering the ascending and descending aorta, and the pulmonary artery bifurcation in 12 healthy subjects (33.2±15.8 years; 5 men). For respiratory motion compensation, two gating & tracking strategies were used with a 7mm gating window: 1) All of k-space acquired within the gating window (fully-gated), 2) Central k-space acquired within the gating window, and the remainder of k-space acquired without any gating (center-gated). Each scan was repeated twice. Stroke volume, mean flow, peak velocity and signal-to-noise-ratio measurements were performed both on the ascending and the descending aorta for all acquisitions, which were compared using a linear mixed-effects model and Bland-Altman analysis.
Results
There were no statistical differences between the fully-gated and center-gated strategies for the quantification of stroke volume, peak velocity and mean flow, as well as the signal-to-noise-ratio measurements. Furthermore, the proposed center-gated strategy had significantly shorter acquisition time compared to the fully-gated strategy (13:19±3:02 vs. 19:35±5:02, P<0.001).
Conclusions
The proposed novel center-gated strategy for 3D flow MRI allows for markedly shorter acquisition time without any systematic variation in quantitative flow measurements in this small group of healthy volunteers.
Keywords: phase contrast MR, blood flow assessment, 3D flow, respiratory navigators, stroke volume, mean flow, intra-scan variability, gating efficiency, cardiac MR
INTRODUCTION
Phase contrast (PC) MRI is widely used to assess blood flow in cardiovascular disease (1–3). Clinically, the velocity component perpendicular to a 2D plane is used for measurements of blood flow (4,5). Through-plane aortic and pulmonic blood flow are measured and used for the evaluation of cardiac function and output, valvular regurgitation, and shunts. Recent advances have enabled 3D time-resolved PC-MRI that allows measurement and visualization of all three directional components of blood flow (6). However, 3D PC-MRI requires long scan times, due to the use of four-point encoding schemes that capture all three directions of velocity encoding, which limits its clinical usage. Cardiac and respiratory variations within the long scan time of 3D PC-MRI also hinder the accuracy and reproducibility of the flow measurements, which are important for quantification of cardiac indices, such as cardiac output or mitral regurgitation.
Various techniques have been proposed for reducing the acquisition time of PC-MRI. Non-Cartesian trajectories, including both radial (7,8) and spiral trajectories (9–12) have been used to reduce scan time 2–3-fold compared to Cartesian sampling. Echo planar imaging has also been employed to improve acquisition time (13–15). Parallel imaging has been utilized to reduce the scan time up to 3-fold (16–18). Significant speed-ups have been achieved using methods exploiting spatio-temporal correlations, such as k-t BLAST/SENSE (19,20), k-t PCA (21,22) and compressed sensing (23–25).
Even though image acceleration for PC-MRI has been explored using various techniques, improving respiratory motion compensation during the 3D PC-MRI acquisition has attracted limited attention. Bellows gating (6), respiratory navigators (12,22,26) and self-gating techniques (27) have been utilized for 3D PC-MRI. Bellows gating (28) uses a pressure sensor positioned around the lower chest to measure chest wall expansion with respiration. Self-gating techniques (27,29) sample additional k-space profiles of the imaging volume at certain time intervals to gate the acquisition. Respiratory navigators (NAV) are commonly used, and utilize a two-dimensional (2D) pencil beam typically positioned on the dome of the right hemi-diaphragm (RHD) to track respiratory motion (30). Due to an approximately linear dependency between the respiratory motion of the heart and that of the RHD, NAV can be used to indirectly monitor the motion of the heart (31). In prospective NAV gating, the k-space lines acquired immediately after the navigator signal are used for image reconstruction only if the NAV signal is within a pre-defined gating window. Otherwise, the corresponding k-space lines are rejected and re-acquired in the next cardiac cycle. These motion compensation techniques typically lead to 30–60% data acquisition efficiency, depending on the subject’s breathing pattern and the gating window that has been specified. Adaptive k-space reordering has also been proposed to further improve gating efficiency (32).
In this study, we sought to reduce the scan time of 3D PC-MRI without compromising reproducibility of flow measurements by improving the efficiency of respiratory motion compensation. We hypothesized that respiratory gating the center of k-space only will yield similar measurements to an acquisition where the full extent of k-space is respiratory-gated, since the phase information is mainly contained in the central k-space. The proposed technique that only respiratory-gates the central k-space was evaluated in-vivo, and compared to fully-gated acquisitions in terms of quantitative flow measurements, as well as intra-scan variability and reproducibility.
MATERIALS AND METHODS
Center-gated 3D PC-MRI Strategy
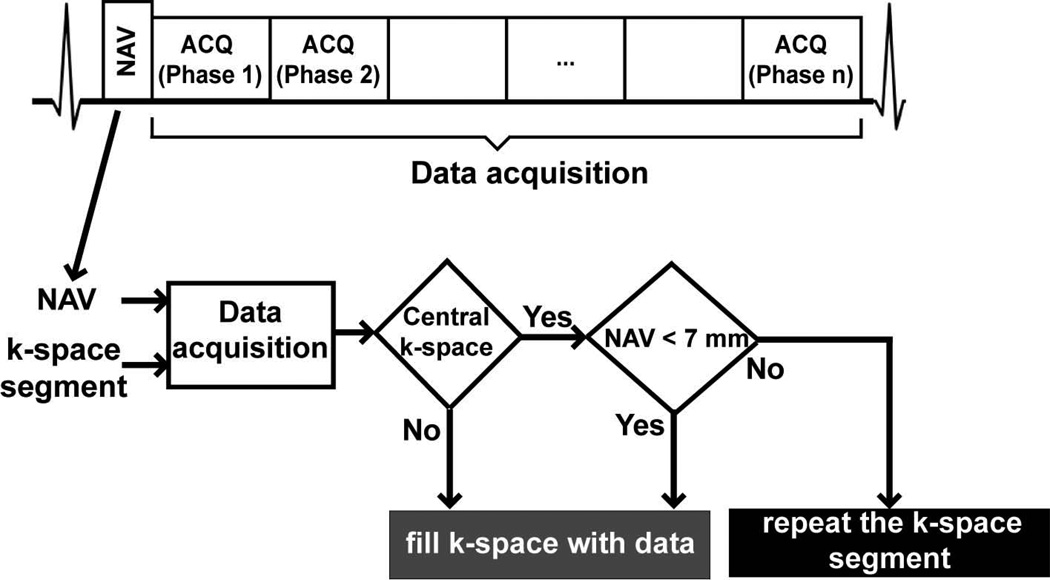
Figure 1 shows the proposed center-gated strategy for data acquisition. Following the preparation (NAV training) phase, where the end-expiration RHD position is determined based on the first 15 RHD positions, the image acquisition is divided into two phases. In the first phase, the central 4% of k-space is acquired with NAV gating and tracking using a pre-defined 7 mm gating window, similar to the prospective NAV acquisition. Subsequently, the remaining outer k-space data are acquired without using any respiratory motion gating, but with end-expiratory tracking. Hence, the central k-space is acquired with motion compensation, whereas the outer k-space contains both motion-corrupted and motion-free k-space segments.
Figure 1.
The navigator-gated 3D phase-contrast MRI sequence, and the flow-chart for the proposed center-gated strategy with a 7mm gating window (NAV = respiratory navigator, ACQ = data acquisition).
Free-Breathing PC-MRI
All imaging was performed on a 1.5-T Philips Achieva (Philips Healthcare, Best, The Netherlands) system with a 32-channel cardiac phased-array receiver coil. For this HIPAA-compliant study, the imaging protocol was approved by our institutional review board, and written informed consent was obtained from all participants.
Twelve healthy adult subjects (33.2±15.8 years; 5 males) without contraindications to MRI were recruited. Scout images were acquired with a steady-state free precession (SSFP) sequence with in-plane resolution 3.1×3.1 mm2 and 10 mm slice thickness, which was used for localization and assignment of the appropriate imaging slab covering the ascending and descending aorta, and the pulomnary bifurcation. A free-breathing electrocardiogram (ECG)-triggered GRE sequence was used for acquisition. The trigger delay was chosen to be 20 ms following the acquisition of the leading NAV signal. Arrhythmia rejection was utilized, allowing the sampling of up to 90% of the cardiac cycle. This resulted in 25 to 15 phases per cardiac cycle for heart rates varying between 60 and 90 bpm respectively. The imaging parameters were TR/TE = 5.7/3.4 ms, flip angle = 10°, VENC = 300 cm/s, field of view = 340×340×40 mm3, spatial resolution = 2.0×2.0×4.0 mm3 reconstructed to 1.2×1.2×4.0 mm3. All images were acquired axially with right-left phase encoding. Only foot-head velocity encoding with interleaving in the same cycle was used with 2 lines per segment to provide a temporal resolution of 35 ms, including the default start-up pulses. The nominal scan time for these acquisitions was 13:30 minutes at a heart rate of 60 bpm (810 heartbeats), assuming no respiratory motion compensation.
A navigator placed on the dome of the RHD with 17 ms duration was used for respiratory motion measurement, utilizing prospective real-time correction and 0.6 superior-inferior tracking ratio (31,33). Two gating strategies were utilized with a 7 mm gating window: 1) The proposed center-gated strategy, 2) conventional gating and tracking for all k-space data (fully-gated). Central k-space lines were acquired first for both fully-gated and center-gated scans. Each type of acquisition was repeated twice to characterize intra-scan variability and reproducibility. Hence, a total of 4 datasets were acquired for each subject. The order of the acquisitions was randomized to cancel out bias due to changes in the breathing patterns. Acquisition times were recorded for each of the scans.
Image and Statistical Analysis
Quantitative image analyses were performed using ViewForum (vR4.2V1L2, Philips Healthcare, Best, NL) to evaluate the two acquisition strategies. For each acquisition, a region-of-interest (ROI) was manually drawn in the ascending and descending aorta on different slices of the 3D volume using the corresponding magnitude images. The ROI was manually corrected throughout the cardiac cycle for cardiac motion. The mean blood flow in each cardiac cycle and the stroke volume were calculated, and the peak velocity was measured for each acquisition. Additionally, signal-to-noise ratio (SNR) was measured at the level of the pulmonary artery bifurcation in both the ascending and descending aorta. The mean signal intensity was measured in the aortic blood pools. Noise was measured in the non-signal areas of each image using a larger ROI. The non-signal areas considered were the anterior to the chest wall and the posterior to the back, as these areas were free from ghosting artifacts or spurious signals due to the prescribed scan orientation. SNR was calculated as the ratio of the mean signal to the standard deviation of the noise.
All statistical analyses were performed using SAS (v9.3, SAS Institute, Cary, NC). To assess the similarity of the measurements, including inter-scan variability, a linear model analysis was used for all the measurement parameters, including stroke volume, mean flow and SNR in the ascending and the descending aorta. In order to capture the inter-scan (within-subject) variability, the data from the 2 fully-gated acquisitions were structured into one single vector with an indicator variable for time within subject. Center-gated data were structured the same way. The overall slope between these two vectors, as well as the 95% confidence intervals were computed taking into account the correlation of the 2 within-subject measurements. The acquisitions were considered to be equivalent if the confidence interval covered 1.0. The correlation (variance-covariance) structure was assumed to be compound symmetry. This yielded the within and between-subject variance components that were used in the estimation of the slope and confidence interval via a linear mixed-effects model. Additionally, Bland-Altman analysis was performed in comparing the individual fully-gated and center-gated scans using the mean flow and stroke volume measurements through the ascending and descending aorta. The peak velocity measurements through the ascending and descending aorta were compared by first averaging over the two fully-gated and center-gated acquisitions respectively, and then using a paired Student’s t-test. A P value of <0.05 was considered to be significant.
RESULTS
3D PC-MRI using both strategies was completed in all subjects, without complication. The average scan time for the center-gated acquisitions was 13:19±3:02 minutes (range: 8:35–20:04 minutes) and 19:35±5:02 minutes (range: 12:48–31:00 minutes) for the fully-gated ones (P<0.001). The average scan times in heartbeats were 1278±313 (range: 890–1950) for the fully-gated scans and 859±70 for the center-gated ones (range: 795–1002). The respiratory gating efficiencies were 65.0±16.1% and 59.8±15.8% (ranges: 40–90% and 41–82% respectively) for the first and second fully-gated scans, and 94.4±2.5% and 93.8±2.2% (ranges: 90–97% for both) for the first and second center-gated scans. The respiratory amplitudes, measured as the difference of the maximum and minimum NAV positions, are 24.5±13.9 mm and 33.2±15.0 mm for the first and second fully-gated scans respectively, and 25.6±15.4 and 27.8±14.1 mm for the first and second center-gated scans. The difference between the nominal scan time and the actual average scan time are due to differences in breathing patterns, the prescribed FOV, as well as the heart rates of the subjects.
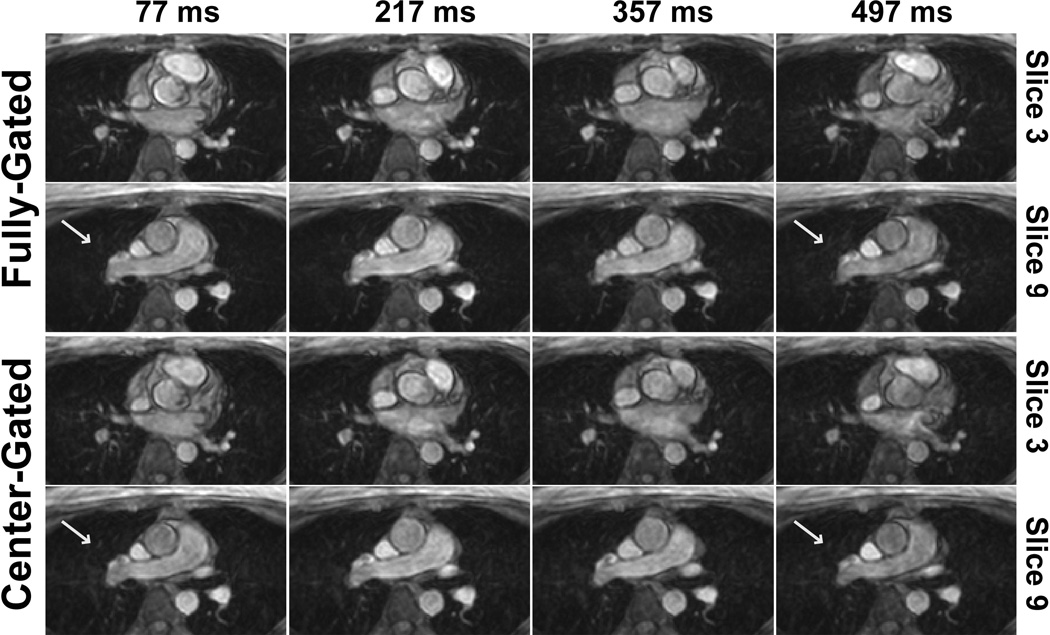
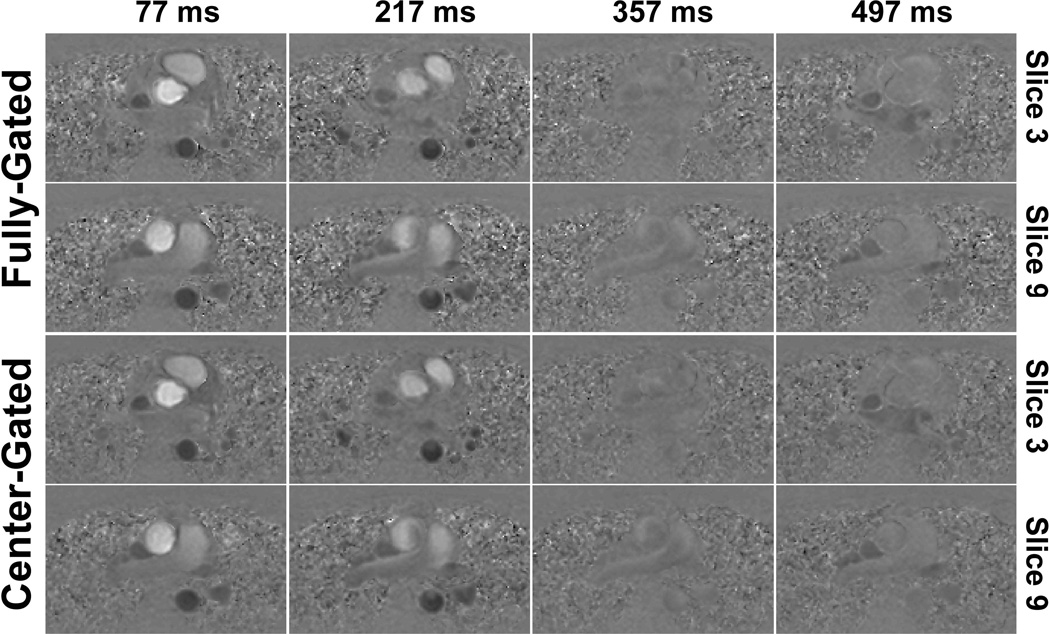
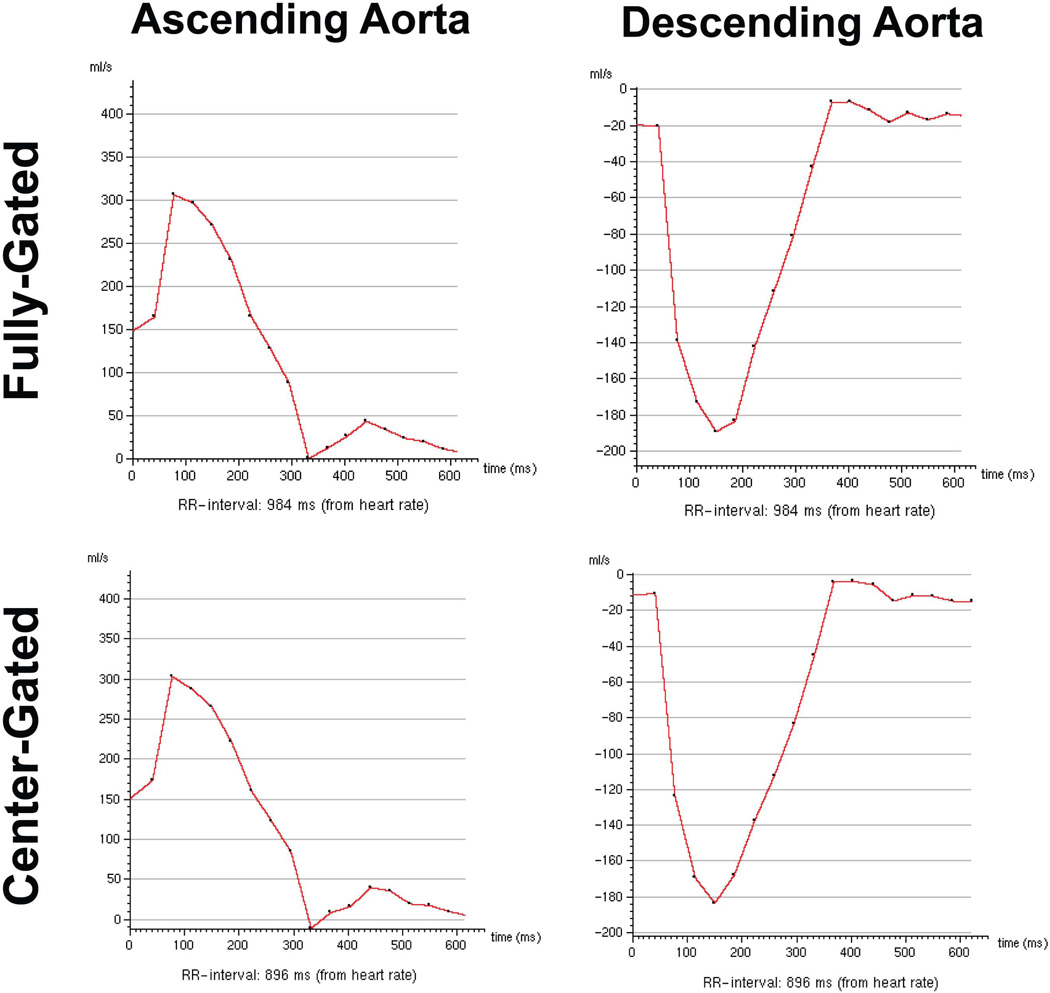
Figure 2 and 3 show example magnitude and phase images respectively, using the two different navigator gating strategies. In the center-gated magnitude images, some residual ghosting artifacts are visible, however these do not hinder visualization since the center of k-space was acquired within a 7 mm gating window. Furthermore, in both cases, more motion artifacts are visible in the later phases due to the use of a leading navigator. The flow in the foot-head direction is visualized similarly both for the ascending and descending aorta with both gating strategies, and the effects of any motion on the edges of k-space are not easily identifiable. The center-gated scan was half as long as the fully-gated scan for this subject (12:13 vs. 25:21 minutes). Figure 4 shows the velocity curves from these acquisitions. Even though the mean length of the R-R interval has changed between the two acquisitions, the curves show the same trends, including the peak velocity values in systole.
Figure 2.
Example magnitude images for two slices and various cardiac phases (specified by time after the R wave) of 3D PC MRI acquisitions from a subject with a heart rate of 61 bpm, acquired using the center-gated and fully-gated navigator strategies, depicting cross-sections across the descending aorta and ascending aorta. The magnitude images are also visualized similarly, with minor ghosting artifacts in the center-gated acquisition due to motion corruption at the edges of the k-space. However, the center-gated acquisition took 12:13 minutes, whereas the fully-gated one was 25:21 minutes. In both cases, more motion artifacts are visible in the later phases due to the use of a leading navigator.
Figure 3.
Example phase images for two slices and various cardiac phases (specified by time after the R wave) of 3D PC MRI acquisitions from the same subject of Figure 2. The phase images show similar flow patterns through the ascending and the descending aorta, and any motion corruption at the edges of the k-space does not hinder the visualization of these patterns.
Figure 4.
Example velocity curves through the ascending and descending aorta of the 3D PC MRI acquisitions from the same subject of Figure 2. The curves show the same trends, including the peak velocity values, even though the mean value of the R-R interval length has changed between the two acquisitions. Due to prospective ECG-triggering, early part of the R-R interval is not sampled densely.
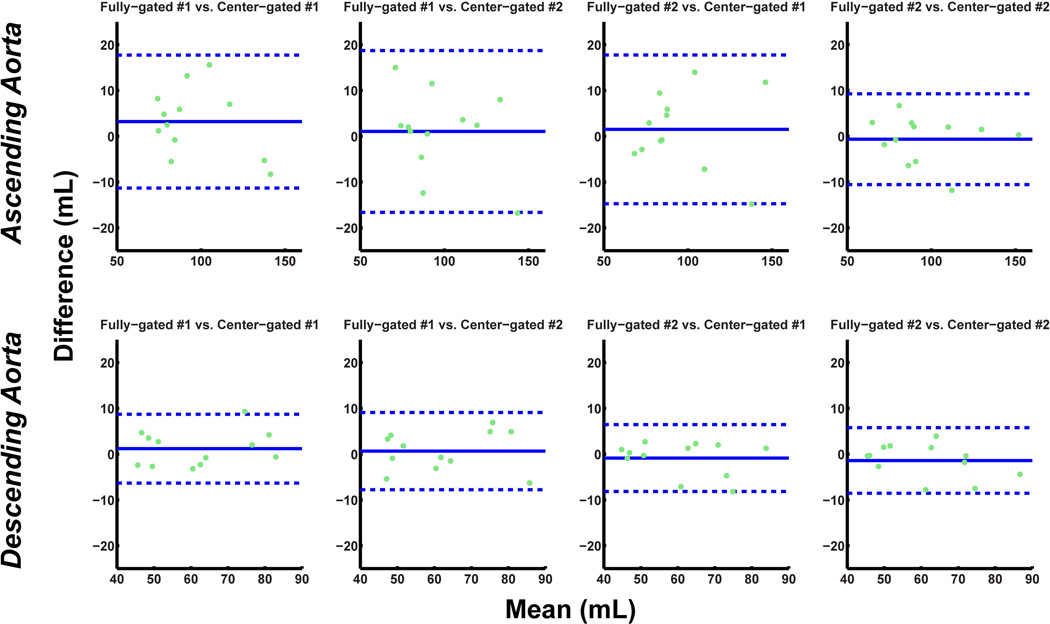
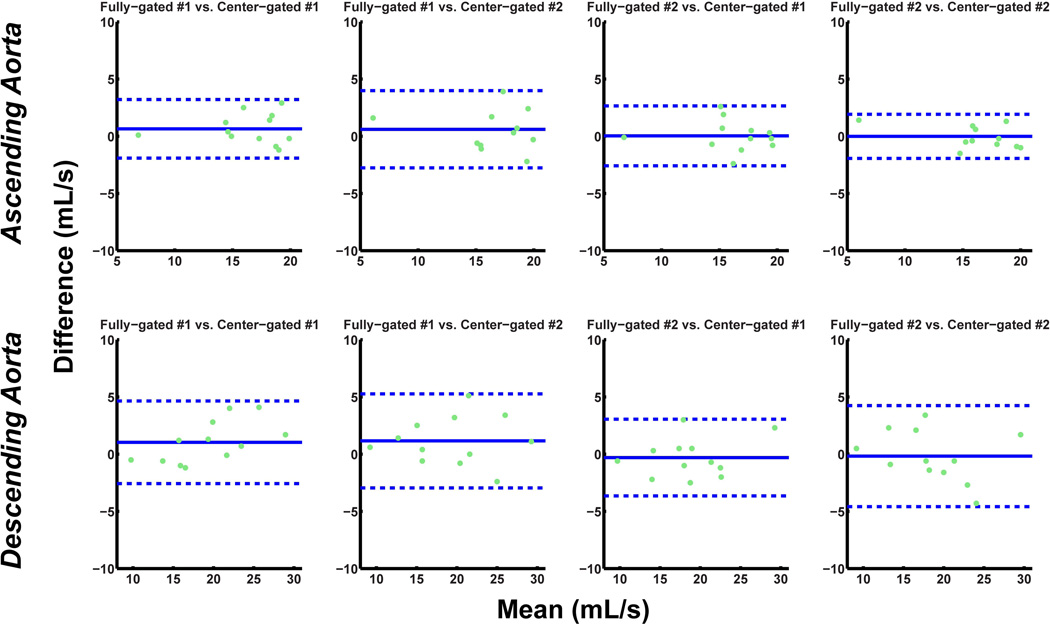
The absolute stroke volume measurements and mean flow measurements for the ascending and descending aorta for both fully-gated and center-gated acquisitions are depicted in Table 1. The linear mixed model analysis lead to overall slopes and corresponding confidence intervals of 1.04 ± 0.10 and 1.02 ± 0.12 for the stroke volumes through ascending and descending aorta respectively. Similarly, for the mean flow, the slopes and the corresponding confidence intervals from the analysis were 1.08 ± 0.08 and 0.98 ± 0.07 for the ascending and descending aorta respectively. Thus, the two acquisitions were statistically equivalent in terms of the quantification of these cardiac indices. Figures 5 and 6 depict the reproducibility of the stroke volume and mean flow measurements respectively, through the ascending and descending aorta, for all four acquisitions. The peak velocity measurements yield a peak descending aorta velocity of −70.3 ± 13.9 cm/s for the fully-gated acquisition and −71.1 ± 13.6 cm/s for the center-gated acquisitions (P = 0.38). The corresponding peak ascending aorta velocity measurements were 61.6 ± 11.2 cm/s for the fully-gated acquisitions and 62.2 ± 12.5 for the center-gated acquisitions (P = 0.57), showing no significant difference between the temporal flow patterns in terms of the peak velocity.
Table 1.
Average stroke volume and mean flow measurements through the ascending aorta (AAo) and descending aorta (DAo) for fully-gated and center-gated scans, and the corresponding 95% confidence intervals (CI) for the overall slopes from the linear mixed models analysis. In all cases, the confidence intervals include 1.0, indicating statistical equivalence.
| stroke volume (mL) | mean flow (mL/s) | |||
|---|---|---|---|---|
| AAo | DAo | AAo | DAo | |
| fully-gated | 96.8 ± 23.5 | 61.5 ± 13.3 | 106.6 ± 26.4 | 69.4 ± 18.6 |
| center-gated | 95.5 ± 25.0 | 61.6 ± 13.5 | 104.6 ± 28.5 | 69.0 ± 17.8 |
| CI for slopes | 1.04 ± 0.10 | 1.02 ± 0.12 | 1.08 ± 0.08 | 0.98 ± 0.07 |
Figure 5.
Bland-Altman analysis of the stroke volume through the ascending and descending aorta for scan variability of fully-gated scans versus the center-gated scans (dotted lines indicate ±1.96 times the standard deviation of the mean difference). The variation observed between the four different scans are within the acceptable range in all cases.
Figure 6.
Bland-Altman analysis of the mean flow through the ascending and descending aorta for scan variability of fully-gated scans versus the center-gated scans (dotted lines indicate ±1.96 times the standard deviation of the mean difference). The variation observed between the four different scans are within the acceptable range in all cases.
The fully-gated acquisitions had SNR of 30.7 ± 6.8 and 30.5 ± 4.7 in the ascending and the descending aorta respectively. The respective SNR measurements for the center-gated acquisitions yield an SNR of 31.0 ± 7.0 and 30.7 ± 4.6. The linear mixed model analysis resulted in overall slopes and corresponding confidence intervals of 1.00 ± 0.06 and 0.96 ± 0.09 in the ascending and the descending aorta respectively, indicating no significant difference between the two acquisitions in terms of SNR.
DISCUSSION
In this study, we introduced and evaluated a novel respiratory motion compensation technique for PC MRI, which utilizes NAV gating & tracking for the central part of k-space only. We showed that the proposed technique allows for increased scan efficiency compared to fully-gated acquisitions, significantly reducing the acquisition time, while resulting in statistically equivalent quantification of the cardiac indices, including stroke volume and mean flow.
Several approaches have been proposed to improve the navigator gating efficiency by using additional information, such as two or three-dimensional NAVs (34–37), binning strategies based on NAV data (38) or self-navigating approaches (29,39,40) in coronary MRI, as well as in 4D flow imaging (27). While close to 100% gating efficiency may be achieved, these methods mostly rely on non-Cartesian acquisitions and motion correction based on parametric models. The concept of using different gating strategies for central and outer k-space has also been previously explored in coronary MRI (41,42). However, these works either utilize a smaller gating window for central k-space for increased accuracy, or use motion-correction for the outer k-space lines that are acquired with a larger gating window. In our work, we focus on phase images, which are largely dependent on the central k-space, and we use a lower spatial-resolution than coronary MRI. These differences enable the utilization of the motion-corrupted outer k-space lines without any retrospective processing or respiratory gating for the quantification of cardiac output indices.
There are significant variations among the breathing patterns of subjects, which result in unpredictable scan durations, especially for 3D flow imaging. The main advantage of the proposed technique is that respiratory gating is only applied to 4% of the central k-space. Thus, even with variable breathing patterns, the data acquisition is completed within a near fixed scan time, removing the uncertainty of acquisition duration associated with NAV gating. We emphasize that the range of scan times reported for the proposed center-gated scheme was mainly due to the varying heart rates.
Since no further processing is required in our technique, the technique can be combined with the existing accelerated imaging techniques without any modifications. Even a relatively modest 3- or 4-fold acceleration would enable acquisition of all three velocity encoding directions with a field-of-view covering the whole-heart in approximately 6 minutes with a ~45ms temporal resolution. In our study, this was not explored to ensure that any artifact introduced between the different acquisitions was only due to respiratory motion, as well as to avoid potential ghosting, noise enhancement or blurring artifacts that may be caused by image acceleration. Further studies are needed to investigate which existing acceleration techniques are well-suited for the proposed center-gated 3D PC-MRI acquisition.
Only a small cohort of healthy subjects with regular breathing patterns and high respiratory efficiencies were studied in this study. We note that the average NAV gating efficiency of most patient populations are around 30–50%, which is lower than that of the fully-gated scans acquired in the healthy cohort in this study. Furthermore, the respiratory amplitudes of the healthy cohort were around 3 cm, which may be smaller than patient populations. The lower gating efficiency and larger respiratory amplitudes of patient populations with irregular breathing patterns may lead to a degradation of image quality for the center-gated acquisitions. Further studies are needed to study the clinical evaluation of this approach in a larger cohort of patients.
In our study, we have used diaphragmatic NAV for characterizing respiratory motion. The primary goal is to acquire the central k-space with minimal motion and to acquire outer k-space with no motion tracking, which can also be applied when using respiratory bellows or fat NAV. The size of the central k-space to be gated was empirically chosen in our study based on the results of (42) on the effect of the central k-space size in compressed sensing-based motion correction. Further studies are needed to systematically study the minimum size of central k-space that is center-gated.
CONCLUSION
We have proposed and evaluated a novel respiratory motion compensation technique for PC-MRI that utilizes NAV gating for the central k-space and no gating for the outer k-space. This approach increases scan efficiency while providing quantification of cardiac indices that are clinically identical to fully-gated scans.
Acknowledgements
Supported by NIH R01EB008743-01A2, NIH K99HL111410-01, and Samsung Electronics, Suwon, South Korea.
REFERENCES
- 1.Bryant DJ, Payne JA, Firmin DN, Longmore DB. Measurement of flow with NMR imaging using a gradient pulse and phase difference technique. J Comput Assist Tomogr. 1984;8(4):588–593. doi: 10.1097/00004728-198408000-00002. [DOI] [PubMed] [Google Scholar]
- 2.Nayler GL, Firmin DN, Longmore DB. Blood flow imaging by cine magnetic resonance. J Comput Assist Tomogr. 1986;10(5):715–722. doi: 10.1097/00004728-198609000-00001. [DOI] [PubMed] [Google Scholar]
- 3.Pelc NJ, Herfkens RJ, Shimakawa A, Enzmann DR. Phase contrast cine magnetic resonance imaging. Magn Reson Q. 1991;7(4):229–254. [PubMed] [Google Scholar]
- 4.Pelc NJ, Bernstein MA, Shimakawa A, Glover GH. Encoding strategies for three-direction phase-contrast MR imaging of flow. J Magn Reson Imaging. 1991;1(4):405–413. doi: 10.1002/jmri.1880010404. [DOI] [PubMed] [Google Scholar]
- 5.Thomsen C, Cortsen M, Sondergaard L, Henriksen O, Stahlberg F. A segmented K-space velocity mapping protocol for quantification of renal artery blood flow during breath-holding. J Magn Reson Imaging. 1995;5(4):393–401. doi: 10.1002/jmri.1880050405. [DOI] [PubMed] [Google Scholar]
- 6.Markl M, Chan FP, Alley MT, Wedding KL, Draney MT, Elkins CJ, Parker DW, Wicker R, Taylor CA, Herfkens RJ, Pelc NJ. Time-resolved three-dimensional phase-contrast MRI. J Magn Reson Imaging. 2003;17(4):499–506. doi: 10.1002/jmri.10272. [DOI] [PubMed] [Google Scholar]
- 7.Barger AV, Peters DC, Block WF, Vigen KK, Korosec FR, Grist TM, Mistretta CA. Phase-contrast with interleaved undersampled projections. Magn Reson Med. 2000;43(4):503–509. doi: 10.1002/(sici)1522-2594(200004)43:4<503::aid-mrm3>3.0.co;2-0. [DOI] [PubMed] [Google Scholar]
- 8.Gu T, Korosec FR, Block WF, Fain SB, Turk Q, Lum D, Zhou Y, Grist TM, Haughton V, Mistretta CA. PC VIPR: a high-speed 3D phase-contrast method for flow quantification and high-resolution angiography. AJNR Am J Neuroradiol. 2005;26(4):743–749. [PMC free article] [PubMed] [Google Scholar]
- 9.Pike GB, Meyer CH, Brosnan TJ, Pelc NJ. Magnetic resonance velocity imaging using a fast spiral phase contrast sequence. Magn Reson Med. 1994;32(4):476–483. doi: 10.1002/mrm.1910320409. [DOI] [PubMed] [Google Scholar]
- 10.Nayak KS, Pauly JM, Kerr AB, Hu BS, Nishimura DG. Real-time color flow MRI. Magn Reson Med. 2000;43(2):251–258. doi: 10.1002/(sici)1522-2594(200002)43:2<251::aid-mrm12>3.0.co;2-#. [DOI] [PubMed] [Google Scholar]
- 11.Nezafat R, Kellman P, Derbyshire JA, McVeigh ER. Real-time blood flow imaging using autocalibrated spiral sensitivity encoding. Magn Reson Med. 2005;54(6):1557–1561. doi: 10.1002/mrm.20690. [DOI] [PMC free article] [PubMed] [Google Scholar]
- 12.Sigfridsson A, Petersson S, Carlhall CJ, Ebbers T. Four-dimensional flow MRI using spiral acquisition. Magn Reson Med. 2012;68(4):1065–1073. doi: 10.1002/mrm.23297. [DOI] [PubMed] [Google Scholar]
- 13.Firmin DN, Klipstein RH, Hounsfield GL, Paley MP, Longmore DB. Echo-planar high-resolution flow velocity mapping. Magn Reson Med. 1989;12(3):316–327. doi: 10.1002/mrm.1910120304. [DOI] [PubMed] [Google Scholar]
- 14.McKinnon GC, Debatin JF, Wetter DR, von Schulthess GK. Interleaved echo planar flow quantitation. Magn Reson Med. 1994;32(2):263–267. doi: 10.1002/mrm.1910320218. [DOI] [PubMed] [Google Scholar]
- 15.Thompson RB, McVeigh ER. High temporal resolution phase contrast MRI with multiecho acquisitions. Magn Reson Med. 2002;47(3):499–512. doi: 10.1002/mrm.10079. [DOI] [PMC free article] [PubMed] [Google Scholar]
- 16.Thunberg P, Karlsson M, Wigstrom L. Accuracy and reproducibility in phase contrast imaging using SENSE. Magn Reson Med. 2003;50(5):1061–1068. doi: 10.1002/mrm.10634. [DOI] [PubMed] [Google Scholar]
- 17.Bammer R, Hope TA, Aksoy M, Alley MT. Time-resolved 3D quantitative flow MRI of the major intracranial vessels: initial experience and comparative evaluation at 1.5T and 3.0T in combination with parallel imaging. Magn Reson Med. 2007;57(1):127–140. doi: 10.1002/mrm.21109. [DOI] [PMC free article] [PubMed] [Google Scholar]
- 18.Peng HH, Bauer S, Huang TY, Chung HW, Hennig J, Jung B, Markl M. Optimized parallel imaging for dynamic PC-MRI with multidirectional velocity encoding. Magn Reson Med. 2010;64(2):472–480. doi: 10.1002/mrm.22432. [DOI] [PubMed] [Google Scholar]
- 19.Baltes C, Kozerke S, Hansen MS, Pruessmann KP, Tsao J, Boesiger P. Accelerating cine phase-contrast flow measurements using k-t BLAST and k-t SENSE. Magn Reson Med. 2005;54(6):1430–1438. doi: 10.1002/mrm.20730. [DOI] [PubMed] [Google Scholar]
- 20.Stadlbauer A, van der Riet W, Crelier G, Salomonowitz E. Accelerated time-resolved three-dimensional MR velocity mapping of blood flow patterns in the aorta using SENSE and k-t BLAST. Eur J Radiol. 2010;75(1):e15–e21. doi: 10.1016/j.ejrad.2009.06.009. [DOI] [PubMed] [Google Scholar]
- 21.Giese D, Schaeffter T, Kozerke S. Highly undersampled phase-contrast flow measurements using compartment-based k-t principal component analysis. Magn Reson Med. 2012 doi: 10.1002/mrm.24273. [Epub ahead of print] [DOI] [PubMed] [Google Scholar]
- 22.Knobloch V, Boesiger P, Kozerke S. Sparsity transform k-t principal component analysis for accelerating cine three-dimensional flow measurements. Magn Reson Med. 2012 doi: 10.1002/mrm.24431. [Epub ahead of print] [DOI] [PubMed] [Google Scholar]
- 23.Holland DJ, Malioutov DM, Blake A, Sederman AJ, Gladden LF. Reducing data acquisition times in phase-encoded velocity imaging using compressed sensing. J Magn Reson. 2010;203(2):236–246. doi: 10.1016/j.jmr.2010.01.001. [DOI] [PubMed] [Google Scholar]
- 24.Kim D, Dyvorne HA, Otazo R, Feng L, Sodickson DK, Lee VS. Accelerated phase-contrast cine MRI using k-t SPARSE-SENSE. Magn Reson Med. 2012;67(4):1054–1064. doi: 10.1002/mrm.23088. [DOI] [PMC free article] [PubMed] [Google Scholar]
- 25.Kwak Y, Nam S, Akcakaya M, Basha TA, Goddu B, Manning WJ, Tarokh V, Nezafat R. Accelerated aortic flow assessment with compressed sensing with and without use of the sparsity of the complex difference image. Magn Reson Med. 2012 doi: 10.1002/mrm.24514. [Epub ahead of print] [DOI] [PMC free article] [PubMed] [Google Scholar]
- 26.Baltes C, Kozerke S, Atkinson D, Boesiger P. Retrospective respiratory motion correction for navigated cine velocity mapping. J Cardiovasc Magn Reson. 2004;6(4):785–792. doi: 10.1081/jcmr-200036119. [DOI] [PubMed] [Google Scholar]
- 27.Uribe S, Beerbaum P, Sorensen TS, Rasmusson A, Razavi R, Schaeffter T. Four-dimensional (4D) flow of the whole heart and great vessels using real-time respiratory self-gating. Magn Reson Med. 2009;62(4):984–992. doi: 10.1002/mrm.22090. [DOI] [PubMed] [Google Scholar]
- 28.McConnell MV, Khasgiwala VC, Savord BJ, Chen MH, Chuang ML, Edelman RR, Manning WJ. Comparison of respiratory suppression methods and navigator locations for MR coronary angiography. AJR Am J Roentgenol. 1997;168(5):1369–1375. doi: 10.2214/ajr.168.5.9129447. [DOI] [PubMed] [Google Scholar]
- 29.Larson AC, White RD, Laub G, McVeigh ER, Li D, Simonetti OP. Self-gated cardiac cine MRI. Magn Reson Med. 2004;51(1):93–102. doi: 10.1002/mrm.10664. [DOI] [PMC free article] [PubMed] [Google Scholar]
- 30.Ehman RL, Felmlee JP. Adaptive technique for high-definition MR imaging of moving structures. Radiology. 1989;173(1):255–263. doi: 10.1148/radiology.173.1.2781017. [DOI] [PubMed] [Google Scholar]
- 31.Wang Y, Riederer SJ, Ehman RL. Respiratory motion of the heart: kinematics and the implications for the spatial resolution in coronary imaging. Magn Reson Med. 1995;33(5):713–719. doi: 10.1002/mrm.1910330517. [DOI] [PubMed] [Google Scholar]
- 32.Markl M, Harloff A, Bley TA, Zaitsev M, Jung B, Weigang E, Langer M, Hennig J, Frydrychowicz A. Time-resolved 3D MR velocity mapping at 3T: improved navigator-gated assessment of vascular anatomy and blood flow. J Magn Reson Imaging. 2007;25(4):824–831. doi: 10.1002/jmri.20871. [DOI] [PubMed] [Google Scholar]
- 33.Danias PG, Stuber M, Botnar RM, Kissinger KV, Edelman RR, Manning WJ. Relationship between motion of coronary arteries and diaphragm during free breathing: lessons from real-time MR imaging. AJR. 1999;172(4):1061–1065. doi: 10.2214/ajr.172.4.10587147. [DOI] [PubMed] [Google Scholar]
- 34.Keegan J, Gatehouse PD, Yang GZ, Firmin DN. Non-model-based correction of respiratory motion using beat-to-beat 3D spiral fat-selective imaging. J Magn Reson Imaging. 2007;26(3):624–629. doi: 10.1002/jmri.20941. [DOI] [PubMed] [Google Scholar]
- 35.Lai P, Bi X, Jerecic R, Li D. A respiratory self-gating technique with 3D-translation compensation for free-breathing whole-heart coronary MRA. Magn Reson Med. 2009;62(3):731–738. doi: 10.1002/mrm.22058. [DOI] [PMC free article] [PubMed] [Google Scholar]
- 36.Schmidt JF, Buehrer M, Boesiger P, Kozerke S. Nonrigid retrospective respiratory motion correction in whole-heart coronary MRA. Magn Reson Med. 2011;66(6):1541–1549. doi: 10.1002/mrm.22939. [DOI] [PubMed] [Google Scholar]
- 37.Henningsson M, Smink J, Razavi R, Botnar RM. Prospective respiratory motion correction for coronary MR angiography using a 2D image navigator. Magn Reson Med. 2012 doi: 10.1002/mrm.24280. [DOI] [PubMed] [Google Scholar]
- 38.Bhat H, Ge L, Nielles-Vallespin S, Zuehlsdorff S, Li D. 3D radial sampling and 3D affine transform-based respiratory motion correction technique for free-breathing whole-heart coronary MRA with 100% imaging efficiency. Magn Reson Med. 2011;65(5):1269–1277. doi: 10.1002/mrm.22717. [DOI] [PMC free article] [PubMed] [Google Scholar]
- 39.Lai P, Larson AC, Park J, Carr JC, Li D. Respiratory self-gated four-dimensional coronary MR angiography: a feasibility study. Magn Reson Med. 2008;59(6):1378–1385. doi: 10.1002/mrm.21617. [DOI] [PMC free article] [PubMed] [Google Scholar]
- 40.Hardy CJ, Zhao L, Zong X, Saranathan M, Yucel EK. Coronary MR angiography: respiratory motion correction with BACSPIN. J Magn Reson Imaging. 2003;17(2):170–176. doi: 10.1002/jmri.10250. [DOI] [PubMed] [Google Scholar]
- 41.Plein S, Jones TR, Ridgway JP, Sivananthan MU. Three-dimensional coronary MR angiography performed with subject-specific cardiac acquisition windows and motion-adapted respiratory gating. AJR Am J Roentgenol. 2003;180(2):505–512. doi: 10.2214/ajr.180.2.1800505. [DOI] [PubMed] [Google Scholar]
- 42.Moghari MH, Akcakaya M, O'Connor A, Basha TA, Casanova M, Stanton D, Goepfert L, Kissinger KV, Goddu B, Chuang ML, Tarokh V, Manning WJ, Nezafat R. Compressed-sensing motion compensation (CosMo): a joint prospective-retrospective respiratory navigator for coronary MRI. Magn Reson Med. 2011;66(6):1674–1681. doi: 10.1002/mrm.22950. [DOI] [PMC free article] [PubMed] [Google Scholar]


