

Abstract
The medial temporal lobe (MTL) is involved in mnemonic processing. The perirhinal cortex (PRC) plays a role in object recognition memory, while the hippocampus is required for certain forms of spatial memory and episodic memory. The lateral entorhinal cortex (LEC) receives direct projections from PRC and is one of the two major cortical inputs to the hippocampus. The transformations that occur between PRC and LEC neural representations are not well understood. Here, we show that PRC and LEC had similarly high proportions of neurons with object-related activity (PRC 52/94; LEC 72/153), as expected from their locations in the “what” pathway into the hippocampus. However, LEC unit activity showed more spatial stability than PRC unit activity. A minority of LEC neurons showed stable spatial firing fields away from objects; these firing fields strongly resembled hippocampal place fields. None of the PRC neurons showed this place-like firing. None of the PRC or LEC neurons demonstrated the high firing rates associated with interneurons in hippocampus or medial entorhinal cortex, further dissociating this information processing stream from the path-integration based, movement-related processing of the medial entorhinal cortex and hippocampus. These results provide evidence for nonspatial information processing in the PRC-LEC pathway, as well as showing a functional dissociation between PRC and LEC, with more purely nonspatial representations in PRC and combined spatial-nonspatial representations in LEC.
Keywords: Hippocampus, Lateral entorhinal cortex, Objects, Memory, What pathway
Introduction
Medial temporal lobe damage leads to profound memory deficits (Scoville and Milner, 1957; Squire et al., 2004). The medial temporal lobe includes the perirhinal cortex (PRC), postrhinal cortex, lateral entorhinal cortex (LEC), medial entorhinal cortex (MEC), the hippocampus, the dentate gyrus, and the subicular complex. Theories about the exact roles played by different MTL subregions are evolving. One hypothesis claims that there is a functional double dissociation between PRC and the hippocampus, with PRC being involved in nonspatial memory and the hippocampus being involved in spatial memory (Ennaceur et al., 1996; Murray et al., 2007). On the other hand, there is a longstanding debate about whether the hippocampus is specialized for encoding space, or whether space is just one of the variables stored in a generalized memory structure in the hippocampus (O'Keefe, 1999; Shapiro and Eichenbaum, 1999). The views on hippocampal function are converging toward a unified conception that the hippocampus encodes conjunctive representations of individual items within a spatial context (O'Keefe and Nadel, 1978; Wiebe and Staubli, 1999; Moita et al., 2003; Manns and Eichenbaum, 2009). In this conception, nonspatial information is provided by the PRC-LEC pathway (Zhu et al., 1995a; Aggleton and Brown, 1999; Knierim et al., 2006; Manns and Eichenbaum, 2009; Deshmukh and Knierim, 2011) and spatial information is provided by the grid-cell and head-direction cell networks of the MEC and related areas ( Taube et al., 1990; Hafting et al., 2005; Sargolini et al., 2006; Boccara et al., 2010). The integration of object-related information from the PRC-LEC (Aggleton and Brown, 1999; Murray et al., 2007) and spatial information from the MEC, in order to create a context-specific, “item + place” conjunctive representation, may be the primary contribution of the hippocampus to episodic memory (Suzuki et al., 1997; Burwell, 2000; Witter and Amaral, 2004; Knierim et al., 2006; Manns and Eichenbaum, 2006).
Understanding the role of the different medial temporal lobe structures in episodic memory requires knowledge of (a) the anatomical connectivity between different regions, (b) what information is encoded at each stage of information processing, and (c) how that information is transformed between processing stages. As part of the ventral stream processing pathway (the “what” pathway), the PRC has long been associated with object recognition. However, the exact role of PRC in object recognition is controversial. While some believe that PRC is fundamentally a mnemonic structure involved in object recognition (Mumby and Pinel, 1994; Aggleton et al., 1997; Aggleton and Brown, 1999), others argue that PRC is better conceptualized as a high-order perceptual area that provides representations of complex stimuli necessary for subsequent memory of those stimuli (Eacott et al., 2001; Norman and Eacott, 2004; Bussey et al., 2005; Murray et al., 2007). The PRC projects to the LEC (Burwell and Amaral, 1998a,b), which in turn projects to the hippocampus (Dolorfo and Amaral, 1998). Like PRC, LEC is implicated in nonspatial information processing (Zhu et al., 1995a,b; Young et al., 1997; Hargreaves et al., 2005; Yoganarasimha et al., 2011). When rats forage in a box in the presence of objects, LEC neurons show more object-related activity than MEC neurons (Deshmukh and Knierim, 2011), as expected from the preceding anatomical and functional evidence. Unexpectedly, in addition to this nonspatial activity, LEC was also shown to contain neurons with activity that resembled spatially tuned place fields in the presence of objects (Deshmukh and Knierim, 2011). In the absence of objects, there is only weak spatial tuning in the LEC (Hargreaves et al., 2005; Yoganarasimha et al., 2011), as well as the PRC (Burwell et al., 1998). Thus, the presence of objects may be essential for the creation of landmark-based spatial representations, in addition to object-related activity, in the “what” pathway. It is not known whether PRC neurons also display spatially selective neurons in the presence of objects. We report here that in rats foraging in the presence of objects, PRC and LEC have similar proportions of neurons with object-related activity, but place cell like activity is seen only in LEC. Thus, LEC appears to inherit nonspatial information from PRC, but LEC may be the first stage in the “what” pathway to demonstrate a spatial representation in the presence of objects.
Materials and Methods
Animals and surgery
Eight 5–6 months old, male, Long-Evans rats were individually housed and kept on a 12 hour light-dark cycle. All training and experiments took place during the dark phase. Rats were on ad libitum food prior to electrode implant surgery. Five to seven days following the surgery, the rats were food restricted and maintained at 80–90% of their free feeding weight. Animal care, anesthesia, and surgical procedures were performed in accordance with National Institute of Health (NIH) and the University of Texas Health Science Center at Houston Institutional Animal Care and Use Committee (IACUC) guidelines.
Eighteen-tetrode hyperdrives were implanted on the right hemisphere under surgical anesthesia. Three rats received implants with 18 tetrodes targeted at LEC/PRC, while 5 rats received implants with 9 tetrodes targeted at LEC/PRC and 9 tetrodes targeted at MEC. The bundle canulae targeting LEC/PRC were positioned approximately 7.4–8.10 mm posterior and 3.2–4.2 mm lateral to Bregma, angled laterally at 25°, allowing the electrodes to access PRC areas 35 and 36 as well as the medio-lateral extent of LEC. The bundle canulae targeting MEC were positioned with the most posterior tetrode at 0.6 to 0.8 mm anterior to the transverse sinus and 4.8–5 mm lateral to the midline, oriented vertically, in order to allow the electrodes to access the dorso-ventral extent of MEC. Data from seven of these eight rats were included in a previous report comparing object responsiveness in LEC and MEC, and the methods are identical to that report, unless specified otherwise (Deshmukh and Knierim, 2011). Specifically, most of the LEC and MEC superficial-layer cells in the current paper were reported in the previous paper (as these are the layers that project the most to the hippocampus); we include these cells in the present paper in order to make direct, statistical comparisons with the corresponding data of the PRC. None of the deep-layer cells reported here have been published previously.
Experimental protocol
The experiment began with a training phase in which rats learned to forage in an empty box for irregularly distributed chocolate sprinkles. The box was positioned 15 cm off the ground and measured approximately 1.2 × 1.5 meters with 30 cm high walls. It contained 34 irregularly-spaced square holes in which objects could be anchored. The box was located in a room with various prominent distal cues that remained constant throughout the training and experimental phases. The experiment began when a rat could successfully run six consecutive 15 min sessions with preamplifiers and tracking LEDs affixed to the hyperdrive and the electrodes were judged to be in the target recording locations (Deshmukh et al., 2010). On the first day of recording, rats continued foraging in the absence of objects in the first session. However, during sessions 2 through 6, there were four objects placed in a configuration that would remain the same for that particular rat throughout the experiment (i.e., the standard configuration for that rat). The identities of the four objects and their positions/orientations changed from rat to rat. On the second day of recording all four objects were placed in the standard configuration for all six sessions that took place on that day. Starting on the third day, object manipulation sessions were interspersed with the standard object sessions. In the object manipulation sessions, either a new object was placed in the box (novel object session) or the location of one (or sometimes two) standard object was changed (misplaced object session) (Figure 1). If the rat remained stationary for long periods or was deemed to have foraged poorly in one or two sessions, the recordings were ended prematurely and were excluded from further analysis regardless of what neuronal activity transpired. Following the first session, a quick preliminary analysis of the data was performed to determine which, if any, objects the neurons were responsive to, so that these objects could be preferentially manipulated in either session 3 or 5. This analysis caused a delay between the first and second session of approximately 30–45 minutes, while the delay between any other 2 sessions was approximately 5 to 7 minutes. Once trained, the rats rarely defecated or urinated during behavior, but when they did, the urine or feces were immediately removed and, following the conclusion of the session, the area was wiped down to disperse any olfactory cues over at least 25% of the apparatus so that the rat does not perceive it as a prominent local landmark similar in dimension to the objects in the experiment. At the end of every recording day the apparatus was wiped down with 70% alcohol.
Figure 1. Experimental protocol.

A typical experimental protocol consisted of 6 consecutive 15 minute foraging sessions in the presence of objects. Sessions 1, 2, 4, and 6 were standard sessions where objects were in their standard configuration. Sessions 3 and 5 were object manipulation sessions, where either a novel object was introduced in the box or one (or occasionally two) familiar object was misplaced. The type of object manipulation was counterbalanced, such that if day n session 3 was a novel-object session while session 5 was a misplaced-object session, then day n + 1 session 3 was a misplaced-object session while session 5 was novel-object session. This was done to reduce the potential effects of ordering. Circles represent familiar objects in their standard locations, while stars represent either novel objects or familiar objects in misplaced locations. Magenta lines connect the standard and misplaced locations of familiar objects in misplaced object sessions.
Starting on the third day of recording, tetrodes were lowered approximately 100 µm each day while listening to cell activity and monitoring local field potential/EEG activity. On most days, at least 16 hours elapsed between lowering of the tetrodes and running the experiment to allow the brain to stabilize. In the instances where there were no units to record from before the start of an experimental session, some tetrodes were lowered anywhere from 20 to 200 µm and allowed to stabilize for at least four hours before the experiment was run. All rats, except one, were run for 10–14 recording days (median = 12 days, outlier: 6 days).
Objects
Objects were mostly small toys that covered a broad range of texture, color, and shape. The smallest and the largest dimensions of any object were 2.5 cm and 15 cm (see Deshmukh and Knierim, 2011 for the photographs of the objects and recording environment).
Recording hardware
Either 12.5 µm nichrome wires or 17 µm platinum-iridium wires (California Fine Wires, Grover Beach, CA) were used for making tetrodes. Nichrome wires were gold plated to bring their impedance down to approximately 200 kOhms. Platinum-iridium electrodes were not gold plated and their impedance was approximately 700 kOhms. All recordings were performed with the Cheetah Data Acquisition System (Neuralynx, Bozeman, Montana, USA) as previously described (Deshmukh et al., 2010).
Cluster cutting
Single units were identified using custom manual cluster cutting software. Units were given a quality rating from 1 to 5 (1 being very well isolated and 5 being poor) based on their separation from other clusters and the background noise. Only those neurons with a minimum of 40 spikes and an isolation quality of 1–3 were selected for analysis. While previous reports from this lab comparing LEC and MEC activity used a 50 spike threshold (Hargreaves et al., 2005; Yoganarasimha et al., 2011; Deshmukh and Knierim, 2011), PRC neurons tended to fire at lower rates than LEC neurons, and hence, the threshold was reduced to 40 spikes. The addition of the lower-firing rate neurons had no discernible impact on the patterns of results reported here. The spatial firing properties of neurons had no bearing on whether or not a neuron was incorporated in the analysis.
Firing rate maps
Positions of LEDs connected to the hyperdrive were monitored using an overhead camera (Model 1300, Cohu, Inc., San Diego, CA, USA) and video tracking hardware (Neuralynx Cheetah system, Bozeman, MT). These LED positions were used to compute the rat’s position. The area of the box was divided into 3.4 cm square bins. The firing rate for each neuron in each bin was determined by dividing the number of spikes fired by the unit by the amount of time the rat spent in that bin, and a rate map was constructed from these firing rate bins. These unsmoothed rate maps were used for object responsiveness measurements. Rate maps used in information score calculations and illustrations were smoothed using an adaptive binning algorithm described by Skaggs et al. (1996).
Spatial information score and reproducibility of spatial firing within a session
The spatial information score quantifies the number of bits of information about a rat’s position that can be determined from a single spike (Skaggs et al., 1996). The Skaggs spatial information score is computed from the firing rate maps, and as such, does not test for reproducibility of firing at a given location over multiple passes through that location. A shuffling procedure is thus routinely employed to estimate the probability of obtaining a spatial information score for a given unit by chance. The shuffling procedure entails shifting a neuron’s spike train in time with respect to the rat’s trajectory with 1000 random time lags (minimum shift 30 s), and calculating the spatial information for the rate maps generated for each random shift. The probability of obtaining the observed information score by chance is the fraction of shuffled trials with spatial information scores equal to or greater than the observed information score. A neuron with bursty, spatially uncorrelated firing will have a high probability of obtaining a spatial information score equal to or greater than the observed spatial information score by chance, since the burst of spikes moves as a unit to a single location in the course of the shifting procedure. In contrast, a neuron that has reproducible, spatially correlated firing will have a low probability of obtaining a spatial information score equal to or greater than the observed spatial information by chance, since the shifted position vector would place the spikes that fire at the same location on repeat passes at different spatial locations. This probability, thus, is a measure of reproducibility of spatial firing of a neuron. A significance threshold of p < 0.01 is routinely used for deeming the spatial information statistically significant. We used this threshold to identify individual neurons with statistically significant spatial information, and the proportion of neurons in a given region meeting the threshold as a measure of the reproducibility of spatial firing at the population level.
Object responsiveness
An object-responsiveness index (ORI; described in Results) was calculated to test whether a neuron responded to object(s) by increasing its firing rate around object(s), and a randomization process was used to estimate the statistical significance of the ORI [p(ORI)] (Deshmukh and Knierim, 2011). The previous report (Deshmukh and Knierim, 2011) used only those neurons with statistically significant (p < 0.01) information scores > 0.25 bits/spike in the object responsiveness analysis. A majority of PRC neurons in the present study did not meet these criteria (only 41 of the 94 PRC neurons met the criteria in at least 1 session). Hence, we did not use these criteria for initial analysis. A subsequent analysis using the criteria was qualitatively similar to the initial analysis.
Place fields away from objects
In addition to object responsive neurons, some LEC neurons had putative place fields away from objects that were stable across multiple sessions (Deshmukh and Knierim, 2011). We used the following criteria to objectively classify a neuron in LEC or PRC as a putative place-related neuron: (1) the pixel by pixel correlation coefficient for session 1 and 2 rate maps had to be greater than 0.71; (2) the spatial information score had to be greater than 0.4 bits/spike, and be statistically significant (p < 0.01); and (3) the p(ORI) for all 4 objects together had to be greater than 0.4. These criteria were identical to Deshmukh and Knierim (2011), in which the full justification for these parameters can be found.
Histology
Following the conclusion of the experiment the rats were perfused and coronal sections of the brains were stained with cresyl violet to determine the positions of tetrodes. For further details on histology methods see Deshmukh et al. (2010).
Results
Multiple neurons were recorded from PRC, LEC, and MEC while rats foraged for chocolate sprinkles in a 1.2 m × 1.5 m box in the presence of objects. Figure 2 shows the distribution of recording sites in the three regions. On a typical day, four sessions with objects in the standard configuration were interleaved with two sessions in which object manipulations, such as object translocation or introduction of a novel object, were performed.
Figure 2. Recording locations.

The distribution of recording locations in PRC, LEC and MEC are shown in cresyl violet stained sections from one of the rats used in this study. These sections are approximately 470 µm apart, assuming 15% shrinkage. Contours mark the range of locations from which single units were recorded in the three regions.
Types of neurons recorded in PRC and LEC
Principal neurons in the hippocampus and MEC show strong spatial correlates, while interneurons in these regions show weak spatial modulation (McNaughton et al., 1983; Kubie et al., 1990; Frank et al., 2001). Hence, we decided to exclude interneurons from PRC and LEC populations, for the purpose of space- and object-related analyses. The width of the extracellular spike (defined here as time from peak to valley of the averaged spike for the neuron) and the mean firing rate can be used to distinguish putative interneurons from putative principal neurons in the hippocampus and EC (Frank et al., 2001; Hargreaves et al., 2005). We used scatter plots of the relationship between mean firing rates and spike widths of the neurons (Figure 3A) to identify the types of neurons that were recorded from PRC and LEC. Scatter plots of MEC neurons recorded under identical conditions are shown for comparison. While 14 out of 82 neurons recorded in MEC in the first session of the day were putative interneurons with narrow spike widths and mean firing rates over 10 Hz (Frank et al., 2001), not one of the LEC (127 neurons) or PRC (67 neurons) units met these criteria to be classified as a putative interneuron. All putative interneurons in MEC had spike widths narrower than 0.25 ms. The PRC sample had only 4 neurons with spike width less than 0.25 ms, and they all fired at mean rates less than 1 Hz. The LEC sample had 3 neurons with spike widths narrower than 0.25 ms, two of which fired at mean rates less than 1 Hz, while the third fired at a mean rate of 5.8 Hz (Figure 3B). The distribution of spike widths of LEC and PRC neurons does not show a natural boundary where narrow spike width neurons can be separated from other neurons on the basis of spike widths alone. Thus, we did not subdivide the LEC and PRC neuronal populations for the purpose of functional analysis.
Figure 3. Absence of high firing rate interneurons in PRC and LEC.

(A) Scatter plots of spike width vs. mean firing rate show that MEC has putative interneurons with narrow (< 0.25 ms) spike widths and high (> 10 Hz) mean firing rates, which are missing in PRC and LEC. (B) Scatter plots with expanded × axis to show that PRC and LEC do not show two clusters [one with broad spikes and low firing rates and another with narrow spikes and high firing rates (lower than 10 Hz)], even at the expanded scale.
Objects and space encoding in PRC and LEC
A number of PRC and deep LEC neurons fired at higher rates near objects than away from objects, similar to the activity reported in superficial LEC (Deshmukh and Knierim, 2011). Figure 4 shows rate maps of selected neurons with different types of object-related activity in PRC and deep LEC. In session 1, unit 1 from PRC showed elevated firing near two of the objects, compared to regions away from objects, as well as around the other two objects. In session 2, this unit continued firing at the two objects, but also fired elsewhere, including weak firing at the other two objects. Finally, when a novel object was introduced in session 3, the unit fired the most at the novel object, while continuing to fire at the two standard objects. Similarly, unit 2 from PRC showed elevated firing near all four objects in sessions 1 and 2. In session 3, this unit fired at a misplaced location of one of the standard objects, while also firing at two of the other standard objects in their standard locations. In contrast, unit 3 from PRC fired the most at a spatial location away from objects in session 1, although this firing was not stable between sessions 1 and 2. In session 3, this neuron showed much higher peak firing rate than sessions 1 and 2, and fired the strongest near the novel object. Unit 4 from deep LEC fired at 3 objects in standard sessions, but fired preferentially at the novel object in session 3. Unit 5 from deep LEC fired at different subsets of standard objects in sessions 1 and 2, and fired at all four objects in session 3, including the misplaced object. In contrast to the object-related firing of these neurons, unit 6 from deep LEC showed spatially selective firing away from objects in session 1 and 2, and continued to fire at this location even after one of the objects was moved to this location in session 3.
Figure 4. Object-related activity in PRC and LEC, and place-related activity in LEC.
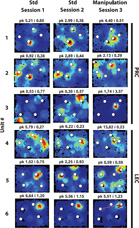
Units 1–3 are from PRC, while units 4–6 are from deep LEC. See Deshmukh and Knierim (2011) for rate maps of neurons from superficial LEC. Units 1–5 show different types of object related activity, while unit 6 shows place cell-like activity. Blue corresponds to no firing while red corresponds to peak firing rate for the given neuron, indicated at the top of each rate map (pk). Spatial information score, in bits/spike for each session is also indicated at the top of each rate map (i).
Spatial selectivity and stability of PRC and LEC neurons in the presence of objects
In the absence of objects, PRC has weak spatial correlates (Burwell et al., 1998). In order to test whether PRC has spatial correlates comparable to LEC in the presence of objects, spatial information scores of PRC neurons were compared with those of LEC neurons. The distributions of spatial information scores from 67 PRC neurons and 127 LEC neurons recorded in the first session of the day were not significantly different from each other, although there was a trend for the PRC neurons to have lower spatial information than the LEC neurons (Figure 5A; PRC median = 0.27 bits/spike, interquartile range bounds (IQRB) = 0.14 – 0.51 bits/spike; LEC median = 0.32 bits/spike, IQRB = 0.21 – 0.62 bits/spike; Wilcoxon ranksum test, p = 0.067). This lack of significant difference persisted even after PRC and LEC neurons were subdivided into deep and superficial layers (Tables 1 and 2, Figure 5B).
Figure 5. Spatial information scores in PRC and LEC.

(A) Distribution of spatial information scores in PRC and LEC are similar to each other, but PRC has a much smaller proportion of neurons with significant spatial information scores compared to LEC. Black bars correspond to neurons with statistically significant information scores. (B) A similar pattern is seen after subdividing spatial information scores by deep and superficial layers of PRC and LEC. (C) Area 35 has more spatial information than area 36, but the majority of neurons in both regions do not have statistically significant information scores.
Table 1.
Spatial information, rate map stability, and object-responsive neurons in superficial and deep layers of PRC and LECa
| Median spatial information score (bits/spike) in session 1 (IQRBb) |
Proportion of neurons with significant spatial information score in session 1 |
Median Pearson correlation coefficient between sessions 1 and 2 (IQRB) |
Proportion of object-responsive neurons |
|
|---|---|---|---|---|
| PRC sup | 0.26 (0.20–0.52) | 8/25 | 0.14 (0.03–0.23) | 23/42 |
| PRC deep | 0.33 (0.18–0.52) | 3/10 | 0.2 (0.04–0.37) | 5/12 |
| LEC sup | 0.35 (0.20–0.62) | 62/76 | 0.53 (0.34–0.69) | 48/89 |
| LEC deep | 0.32 (0.21–0.61) | 32/42 | 0.51 (0.37–0.64) | 20/50 |
Subdividing neurons into superficial and deep layers led to exclusion of some neurons as they could not be definitively assigned to either the deep or superficial layer, leading to only a subpopulation of neurons from PRC and LEC being included in these analyses.
Interquartile range bounds
Table 2.
p values for statistical comparisons between superficial and deep layers of PRC and LEC
| Spatial information score in session 1 (Wilcoxon rank sum test) |
Proportion of neurons with significant spatial information score in session 1 (χ2 test) |
Pearson correlation coefficient between sessions (Wilcoxon rank sum test) |
Proportion of object- responsive neurons (χ2 test) |
|
|---|---|---|---|---|
| PRC sup vs. PRC deep | 0.9 | 0.77 | 0.52 | 0.64 |
| PRC sup vs. LEC sup | 0.51 | 1 × 10⁻⁵*** | 6 × 10⁻⁴*** | 0.92 |
| PRC sup vs. LEC deep | 0.47 | 0.0009*** | 4 × 10⁻⁷*** | 0.23 |
| PRC deep vs. LEC sup | 0.53 | 0.002** | 0.003** | 0.62 |
| PRC deep vs. LEC deep | 0.68 | 0.02* | 0.005** | 0.82 |
| LEC sup vs. LEC deep | 0.92 | 0.65 | 0.76 | 0.16 |
p < 0.05,
p < 0.01,
p < 0.001. Holm-Bonferroni correction (Holm, 1979) was used to account for multiple comparisons, at family wide error rate = 0.05.
The PRC encompasses Brodmann areas 35 and 36, which differ in morphology (Burwell, 2001) and connectivity patterns (Burwell and Amaral, 1998a,b; Furtak et al., 2007). Area 35 had significantly higher spatial information scores than area 36 (Figure 5C; area 35 median = 0.42 bits/spike, IQRB = 0.27 – 0.65; area 36 median = 0.18 bits/spike, IQRB = 0.07 – 0.26; Wilcoxon ranksum test, p = 0.0001). Deep and superficial cells were distributed fairly equally across areas 35 and 36 (area 35: deep = 3 cells, superficial = 10 cells, borderline deep/superficial = 13 cells; area 36: deep = 6 cells, superficial = 10 cells, borderline deep/superficial = 11 cells). Furthermore, the spatial information scores in PRC deep and superficial layers were not different (Tables 1 and 2), indicating that there was no primary effect of PRC layer on spatial information content that can account for the observed difference between spatial information scores in areas 35 and 36.
We used the probability of obtaining Skaggs spatial information by chance as a measure of reproducibility of spatial firing of a neuron within a session (see methods). A much smaller proportion of PRC neurons showed statistically significant spatial information scores (23/67 at α = 0.01) than LEC (102/127) neurons (Figure 5A; χ2 = 38.49, p = 5.5 × 10⁻¹⁰). Deep as well as superficial layers of PRC had significantly smaller proportions of neurons with statistically significant spatial information scores than deep and superficial layers of LEC (Tables 1, 2; figure 5B). The proportions of neurons with statistically significant information did not differ significantly between area 35 and area 36 (Figure 5C, area 35 proportion = 12/26; area 36 proportion = 7/27; χ2 = 1.56, p = 0.21).
The stability of PRC and LEC rate maps between sessions 1 and 2, the two consecutive sessions with the standard object configuration, was estimated using pixel-by-pixel correlation coefficients between the two sessions for each neuron. PRC had significantly lower correlation coefficients compared to LEC (PRC median = 0.17, IQRB = 0.04 – 0.32; LEC median = 0.51, IQRB = 0.34 – 0.65; Wilcoxon ranksum, p = 1.5 × 10⁻¹²). The distributions of these coefficients did not differ between PRC superficial and deep layers, or between LEC superficial and deep layers, but both PRC deep and superficial layers had significantly lower correlation coefficients than LEC deep and superficial layers (Tables 1, 2).The lower stability of PRC firing rate maps across consecutive sessions, together with the smaller proportion of neurons with significant spatial information scores, is indicative of the low reproducibility of firing patterns among PRC neurons in space, similar to an earlier report from PRC on a plus maze (Burwell et al., 1998). Correlation coefficients in area 35 and area 36 were not significantly different from each other (area 35 median = 0.22, IQRB = 0.04 – 0.34; area 36 median = 0.16, IQRB = 0.06 – 0.32; Wilcoxon rank sum test p = 0.58).
PRC had lower mean firing rate than LEC (Figure 3; PRC median = 0.27 Hz, LEC median = 0.6 Hz; Wilcoxon rank sum test, p = 0.0048). In order to confirm that the differences in spatial selectivity and stability between PRC and LEC were not caused by lower firing rates in PRC, we compared the PRC data with LEC neurons that had mean firing rates lower than the median mean firing rates in LEC. The mean firing rates of this subset were almost significantly lower than PRC mean firing rates (LEC(low) median = 0.22 Hz, Wilcoxon ranksum test, p = 0.054). The low firing rate fraction of LEC neurons had (1) significantly higher spatial information scores than PRC neurons (LEC(low) median = 0.52bits/spike, IQRB = 0.33 – 0.79; Wilcoxon ranksum test p = 2 × 10⁻⁶), (2) a much higher proportion of statistically significant information scores than PRC neurons (LEC(low) proportion = 43/63; χ2 = 13.62, p = 2.2 × 10⁻⁴), and (3) significantly higher correlation coefficients than PRC neurons (LEC(low) median = 0.48; Wilcoxon ranksum p = 1.2 × 10⁻⁷). Thus the difference in spatial selectivity and stability between LEC and PRC is not caused by lower firing rates in PRC.
Object-related activity
The responses of individual neurons to objects were quantified using an Object Responsiveness Index (ORI), defined as (On − A)/ (On + A), where On is the mean firing rate within a 17 cm (5-pixel) radius of object n and A is the mean firing rate of all pixels outside the 17 cm radius of all four objects. The ORI was also calculated for all four objects together, thus producing five different ORI values for each cell (Deshmukh and Knierim, 2011). The probability that each ORI could be obtained by chance was calculated independently for each neuron [p(ORI)] using a randomization procedure (Deshmukh and Knierim, 2011). The lowest of the 5 p(ORI) values for each cell (one for each of the 5 ORI calculations done for each neuron) was denoted pmin(ORI). Figure 6 shows distributions of pmin(ORI) for PRC and LEC neurons. The proportions of object-responsive neurons (black bars) in PRC and LEC were not significantly different from each other.
Figure 6. Similar proportions of PRC and LEC neurons are object responsive.

Distributions of pmin(ORI) in PRC (top) and LEC (bottom) neurons in the four standard sessions are similar. Black bars indicate cells that showed statistically significant [pmin(ORI) < 0.05] object-related firing. Logarithmic scale is used for pmin(ORI). PRC and LEC showed similar proportions of neurons with object-related activity in the four standard sessions (session 1 PRC: 13/67, LEC: 28/127, χ2 = 0.059, p = 0.81; session 2 PRC: 13/68, LEC: 26/119, χ2 = 0.065, p = 0.8; session 4 PRC: 16/58, LEC: 20/106, χ2 = 1.19, p = 0.27; session 6 PRC: 7/48, LEC: 26/90, χ2 = 2.78, p = 0.095).
In order to test whether PRC and LEC neurons responded similarly to object novelty and translocation, novel- or misplaced-object sessions were interleaved with standard sessions. Some PRC and LEC neurons responded to novel/misplaced objects with elevated firing (Session 3 in Figure 4). These responses were quantified by using p(ORI) at the novel/misplaced object location. Neurons that had a preexisting field (i.e., they showed p(ORI) < 0.1) at the novel/misplaced object location in a session preceding novel/misplaced object sessions were not counted as being novel/misplaced object responsive. The criterion for identifying a preexisting field was more permissive than the usual p < 0.05 used for object responsiveness, in order to eliminate the neurons that have preexisting fields near novel/misplaced objects, but barely miss the significance threshold. This permissive criterion reduces the likelihood of falsely classifying neurons with preexisting fields as responding to novel/misplaced objects. In PRC, 8/62 neurons responded to misplaced objects, while 13/99 LEC neurons did the same. Both of these proportions are higher than expected by chance at α = 0.05 (test of proportions, PRC: z = 2.86, p = 0.002; LEC: z = 3.71, p = 1.0 × 10⁻⁴) and were statistically indistinguishable from each other (χ2 = 0.039, p = 0.84). Similarly, the proportions of novel object-responsive neurons in PRC and LEC were statistically indistinguishable from each other (PRC: 5/55, LEC: 13/98, χ2 = 0.26, p = 0.62). While the proportion of novel object-responsive LEC neurons was higher than chance, the proportion of PRC neurons was not significant but showed a similar trend (test of proportions, LEC: z = 3.75, p = 8.7 × 10⁻⁵; PRC: z = 1.4, p = 0.082).
Overall, similar proportions of neurons showed object-related activity in at least one of the six sessions each day in LEC and PRC (LEC: 72/153, PRC 52/94, χ2 = 1.28, p = 0.26). Even after subdividing the PRC and LEC neurons into superficial and deep layers, none of the regions were significantly different from the others (Tables 1, 2). Furthermore, there was no difference in the proportions of neurons with object-related activity in at least one session between area 35 and area 36 (area 35 16/35, area 36 24/40, χ2 = 1.01, p = 0.31).
Last, we tested if restricting the sample to only the neurons with statistically significant (p < 0.01) spatial information scores higher than 0.25 bits/spike, as was done earlier while comparing superficial LEC with superficial MEC(Deshmukh and Knierim, 2011), led to a difference between the proportions of object-responsive neurons in PRC and LEC. Even under these conditions, the proportions of neurons with object-related activity in LEC and PRC were not significantly different from each other (LEC 45/101, PRC 16/41, χ2 = 0.17, p = 0.68).
Location of object responsive neurons in LEC
Since LEC projections to hippocampus show a topographical organization, such that lateral LEC projects to dorsal hippocampus and medial LEC projects to ventral hippocampus (Witter and Amaral, 2004), we asked if there is a difference in object responsiveness along the medial-lateral axis of LEC. Object responsive neurons were detected along the entire lateral to medial extent of LEC. For the locations of object responsive neurons in superficial LEC, see figure 6 in Deshmukh and Knierim (2011).
Place-like activity in the presence of objects
In the absence of objects, LEC does not show strong spatial firing fields (Hargreaves et al., 2005; Yoganarasimha et al., 2011). In contrast, in the presence of objects, a small number of superficial LEC neurons display spatial firing fields away from objects; these firing fields strongly resemble place fields of the hippocampus (Deshmukh and Knierim, 2011). A stringent set of criteria was used to classify LEC or PRC cells as putative place related cells (see methods). In addition to 6 superficial LEC neurons meeting the criteria reported previously (Figures 5 and A2 in Deshmukh and Knierim, 2011), 3 deep LEC neurons also show putative place-related activity (e.g., Figure 4 unit 6). These 9 neurons were recorded from 5 different rats. Only 1 of these 9 neurons fired near a spatial location where an object had once been (unit 6 of Figure 4 was recorded on day 7, and a misplaced object had been placed on day 3 at the location where the unit fired on day 7). Hence, the memory of an object’s location cannot account for the place-related activity in the majority of LEC neurons. None of the PRC neurons met the criteria for putative place-related activity, consistent with the low spatial stability of PRC neurons (Figure 5A; Burwell et al., 1998). The proportion of putative place cells in LEC was significantly higher than that in PRC (LEC 9/102, PRC 0/58, χ2 = 3.89, p = 0.048). Since we characterize only the neurons with place fields away from objects as putative place cells, the number of neurons involved in spatial information processing in LEC is likely to be underestimated. For example, we reported earlier (Deshmukh and Knierim, 2011) that 2 superficial LEC neurons which fired consistently at the standard location of only 1 object continued to fire at the same location even after the object was misplaced, raising the possibility that these neurons were actually encoding the spatial location rather than the object in the location.
Recording day differences
PRC is located dorsal to LEC. Since the recording paradigm consisted of starting the experiment when the tetrodes were judged to be in the region of interest and advancing them at the end of each recording day, PRC neurons were recorded on earlier days than LEC neurons on average (PRC median = 6th day, LEC median = 8th day, Wilcoxon ranksum p = 0.0003). The recording days ranged from day 2 to day 14 for both PRC and LEC (PRC IQRB = 5th – 8th day; LEC IQRB = 5th – 11th day). This systematic recording of PRC neurons on earlier days than LEC neurons may confound the interpretation of differences in spatial information score significance and session-to-session stability of rate maps observed in the two regions. However, neither PRC nor LEC showed a significant correlation between (a) recording day and spatial information scores in session 1 (PRC r = 0.02, p = 0.87; LEC r = −0.03, p = 0.75); (b) recording day and proportions of neurons with significant information scores (PRC r = −0.32, p = 0.34; LEC r = 0.15, p = 0.64); or (c) recording day and session 1 to session 2 rate map correlations (PRC r = 0.11, p = 0.38; LEC r = 0.06, p = 0.56). PRC showed a significant correlation between recording day and the proportion of object-responsive neurons (r = 0.70, p = 0.02). This correlation likely is an artifact of the noise introduced in the measurement of proportions by the small number of neurons recorded on days 12 and 14 (one each). Both of these neurons were object-responsive, making the proportions of object-responsive neurons on days 12 and 14 = 1. Eliminating these two neurons makes the correlations insignificant (r = 0.12, p = 0.75). LEC does not show a significant correlation between recording day and proportion of object-responsive neurons (r = −0.31, p = 0.30). Thus, the difference in recording days is unlikely to account for the similarities and differences between PRC and LEC responses.
Discussion
The present study shows three significant phenomena in the pathway involving PRC and LEC. First, PRC and LEC show comparable proportions of object-responsive neurons, consistent with the proposed role of these areas in object representation. Second, PRC shows weaker spatial correlates in the presence of objects compared to LEC, functionally distinguishing LEC and PRC. While PRC appears to be involved in purely nonspatial computations, LEC seems to represent objects as well as space in the presence of three dimensional local objects. Third, PRC and LEC do not show the high-firing-rate, putative interneurons that are characteristic of the MEC and hippocampus.
Parallel input pathways into the hippocampus
The hippocampus receives the majority of its cortical inputs from LEC and MEC. Based on their anatomical connectivity, LEC and MEC are thought to be parts of distinct information processing streams. PRC sends stronger projections to LEC than MEC (Burwell and Amaral, 1998a; Burwell and Amaral, 1998b), while postrhinal cortex sends stronger projections to MEC than LEC (Naber et al., 1997; but see Burwell and Amaral, 1998a). Although PRC and postrhinal cortex are reciprocally connected, PRC preferentially receives inputs from unimodal sensory areas, including olfactory, somatosensory, and gustatory areas, while postrhinal cortex preferentially receives inputs from visual areas and visuospatial areas (including cingulate, retrosplenial, and posterior parietal cortices; Burwell and Amaral, 1998a). Furthermore, MEC receives inputs from spatial areas like the presubiculum and parasubiculum, in addition to the inputs from visual areas and visuospatial areas (Figure 7; Burwell and Amaral, 1998a; Witter and Amaral, 2004).
Figure 7. Cortical inputs to the hippocampus are segregated (Burwell, 2000; Witter and Amaral, 2004).

Inputs from the cortical “where” pathway enter medial temporal lobe through postrhinal cortex and MEC, while inputs from the “what” pathway enter medial temporal lobe via PRC and LEC. Both these streams converge onto hippocampus, which may synthesize the conjunctive “object + place” representation that might be a critical component of episodic memory. Roles of different components of the pathway, as suggested by the present report, are shown under the components.
Based on this difference in anatomical connectivity patterns, PRC and LEC are thought to be parts of the “what” processing stream providing nonspatial information to the hippocampus, whereas postrhinal cortex and MEC are thought to be a part of the “where” processing stream providing spatial information to the hippocampus (Suzuki et al., 1997; Burwell, 2000; Witter and Amaral, 2004; Knierim et al., 2006). Physiological data are consistent with this hypothesis. In the “what” pathway, PRC and LEC neurons selectively respond to objects, odors, or pictures of objects (Zhu et al., 1995a,b; Young et al., 1997; Wan et al., 1999). LEC shows weak spatial selectivity in simple (Hargreaves et al., 2005) as well as complex environments (Yoganarasimha et al., 2011), in the absence of local objects. Consistent with LEC, PRC also shows weak spatial firing properties (Burwell et al., 1998).In the “where” pathway, MEC neurons have spatial correlates in the forms of grid cells, boundary cells, and head direction cells (Fyhn et al., 2004; Hafting et al., 2005; Hargreaves et al., 2005; Savelli et al., 2008; Solstad et al., 2008). Although postrhinal cortex shows a higher proportion of neurons with spatially modulated firing compared to PRC (Burwell and Hafeman, 2003), this firing is inconsistent across sessions (Fyhn et al., 2004) and does not predictably rotate with visual cues (Burwell and Hafeman, 2003). Event-related fMRI in humans shows that PRC plays a role in item recognition while the parahippocampal cortex (the human equivalent of rat postrhinal cortex) plays a role in source recollection (Davachi et al., 2003). The parahippocampal cortex is also implicated in visual scene processing (Epstein and Kanwisher, 1998). Similarly, immediate early gene expression (Wan et al., 1999) and lesion (Norman and Eacott, 2005) studies in rats implicate PRC in object recognition and postrhinal cortex in contextual processing (although other studies implicate both PRC and postrhinal cortex in contextual processing; Bucci et al., 2000; Burwell et al., 2004).
The present study adds some new details to this dual-pathway model of information flow through the MTL and suggests that the model needs modification. By comparing the responses of PRC and LEC neurons recorded while rats foraged in the presence of objects, we were able to demonstrate a functional dissociation between these two areas in terms of spatial information content. Unlike previous studies that demonstrated responsiveness of EC neurons to individual stimuli (Zhu et al., 1995a,b; Young et al., 1997; Wan et al., 1999), we recorded LEC and PRC under conditions that are typically used to study spatial correlates of place cells. Under these conditions, we showed that the proportion of object-responsive neurons in PRC is comparable to that in LEC, consistent with the proposed functions of PRC in perception (Murray et al., 2007), object recognition, and familiarity (Aggleton and Brown, 1999; Murray et al., 2007). However, LEC showed stronger spatial stability than PRC, as well as putative place-related cells, which were not seen in PRC. Thus, while PRC seems to represent pure “what” information, LEC seems to combine “what” as well as “where” information. One possibility is that LEC inherits its spatial selectivity via feedback projections from the hippocampus or via lateral projections from MEC. This explanation would not easily account for the failure to see these place-like firing fields in previous studies of LEC without objects, however (Hargreaves et al., 2005; Yoganarasimha et al., 2011; Deshmukh and Knierim, 2011). Alternatively, LEC may create a landmark-derived spatial representation de novo, in addition to inheriting pure object representations from PRC. Because LEC has both spatial and nonspatial firing correlates, it may no longer be appropriate to describe its primary function as processing objects or items. Rather, the function of LEC may best be described as processing external sensory inputs, in contrast to the processing of internally based, path integration information performed in MEC (McNaughton et al., 2006; Burgess et al., 2007; Hasselmo et al., 2007). The similarity in proportions of object-responsive neurons in LEC and PRC is consistent with PRC being the source of sensory information to LEC. The PRC-LEC pathway is likely to use the sensory information to create object-related representations like object identity, novelty, and object+place conjunctions. In contrast, the postrhinal cortex is likely to provide external sensory information to the path integration computations supported by a processing loop that includes MEC, presubiculum, and parasubiculum (Figure 7) in order to correct accumulating errors that are the by-product of an inertial navigation system.
Activity in PRC subdivisions
Within the PRC-LEC processing stream, there is a directionality to the connectivity, with the projections from area 36 to area 35 and from area 35 to LEC stronger than the return projections (Burwell and Amaral, 1998b). Area 35 and area 36 are structurally distinct from each other (Burwell, 2001), and show distinct input and output patterns (Burwell and Amaral, 1998a,b; Furtak et al., 2007). For example, whereas area 35 receives stronger inputs from olfactory areas, area 36 receives stronger inputs from the ventral temporal association cortices, and reciprocal connections between postrhinal cortex and area 36 are stronger than those between postrhinal cortex and area 35 (Burwell and Amaral, 1998b; Furtak et al., 2007). In the present study, neurons in area 35 had significantly higher spatial information content than those in area 36. The higher spatial information content of area 35 compared to area 36 creates a gradient of increasing spatial information from area 36 to area 35 to LEC, and may be caused by feedback from LEC, which projects more strongly to area 35 than to area 36 (Burwell and Amaral, 1998a). However, the proportion of neurons with statistically significant spatial information was low in both area 35 and area 36, and not distinguishable from each other. This lack of significance indicates that the reliability of spatial firing was low in both areas, and that the higher spatial information scores in area 35 may be at least partly artifactual. Low session 1 to session 2 rate map correlations in area 35 and area 36 further corroborate the lack of significant spatially correlated activity in both subregions of PRC. Furthermore, both subregions of PRC show similar proportions of object-responsive neurons. The lack of a pronounced difference between area 35 and area 36 in the current experiments should not be misconstrued to mean that there are no functional differences between these areas. Given the differences in their projection patterns, one may see stronger influence of olfactory information in area 35, while area 36 may have more nuanced representations of complex objects, and possibly some contextual effects.
Absence of high firing rate interneurons in PRC and LEC
The lack of high firing rate interneurons in PRC and LEC under the current experimental conditions is an intriguing finding. In vitro studies have demonstrated the presence of GABAergic, narrow spike width interneurons in PRC (Faulkner and Brown, 1999; Martina et al., 2001) and parvalbumin-immunoreactive neurons (putative GABAergic interneurons) in LEC (Wouterlood et al., 1995). While the firing rate of an interneuron might depend on intrinsic properties as well as the neuronal network in which the interneuron is embedded, the shape (and consequently, the width) of the extracellular action potential depends on intrinsic properties of the neurons (Henze et al., 2000; Bean, 2007), and not the network. Thus, the narrow spike width interneurons would have narrow spike widths, even if they fired at lower rates. The absence of narrow spike width neurons in our LEC and PRC datasets indicates that these neurons are either silent under the current experimental conditions or the difference between the spike widths of interneurons and principal cells in PRC and LEC is not large enough to separate them on the basis of spike width alone. Regardless of whether narrow spike width interneurons are silent or merely inseparable from principal cells, there are no high firing rate interneurons in PRC and LEC in foraging rats. This absence of high firing rate interneurons in the PRC-LEC pathway in contrast to hippocampus (Ranck, Jr., 1973), MEC (Frank et al., 2001) and retrosplenial cortex (Cho and Sharp, 2001) indicates that network level computations involved in processing of the external sensory information in PRC and LEC are fundamentally different from those involved in path integration computations.
Acknowledgements
We thank Geeta Rao for help with hyperdrive manufacture and histology.
Grant sponsor: NIH/NINDS; Grant number: R01 NS039456
Grant sponsor: NIH/NIMH; Grant number: R01 MH094146
References
- Aggleton JP, Brown MW. Episodic memory, amnesia, and the hippocampal-anterior thalamic axis. Behav Brain Sci. 1999;22:425–444. [PubMed] [Google Scholar]
- Aggleton JP, Keen S, Warburton EC, Bussey TJ. Extensive cytotoxic lesions involving both the rhinal cortices and area TE impair recognition but spare spatial alternation in the rat. Brain Res Bull. 1997;43:279–287. doi: 10.1016/s0361-9230(97)00007-5. [DOI] [PubMed] [Google Scholar]
- Bean BP. The action potential in mammalian central neurons. Nat Rev Neurosci. 2007;8:451–465. doi: 10.1038/nrn2148. [DOI] [PubMed] [Google Scholar]
- Boccara CN, Sargolini F, Thoresen VH, Solstad T, Witter MP, Moser EI, Moser MB. Grid cells in pre- and parasubiculum. Nat Neurosci. 2010;13:987–994. doi: 10.1038/nn.2602. [DOI] [PubMed] [Google Scholar]
- Bucci DJ, Phillips RG, Burwell RD. Contributions of postrhinal and perirhinal cortex to contextual information processing. Behav Neurosci. 2000;114:882–894. doi: 10.1037//0735-7044.114.5.882. [DOI] [PubMed] [Google Scholar]
- Burgess N, Barry C, O'Keefe J. An oscillatory interference model of grid cell firing. Hippocampus. 2007;17:801–812. doi: 10.1002/hipo.20327. [DOI] [PMC free article] [PubMed] [Google Scholar]
- Burwell RD. The parahippocampal region: corticocortical connectivity. Ann N Y Acad Sci. 2000;911:25–42. doi: 10.1111/j.1749-6632.2000.tb06717.x. [DOI] [PubMed] [Google Scholar]
- Burwell RD. Borders and cytoarchitecture of the perirhinal and postrhinal cortices in the rat. J Comp Neurol. 2001;437:17–41. doi: 10.1002/cne.1267. [DOI] [PubMed] [Google Scholar]
- Burwell RD, Amaral DG. Cortical afferents of the perirhinal, postrhinal, and entorhinal cortices of the rat. J Comp Neurol. 1998a;398:179–205. doi: 10.1002/(sici)1096-9861(19980824)398:2<179::aid-cne3>3.0.co;2-y. [DOI] [PubMed] [Google Scholar]
- Burwell RD, Amaral DG. Perirhinal and postrhinal cortices of the rat: interconnectivity and connections with the entorhinal cortex. J Comp Neurol. 1998b;391:293–321. doi: 10.1002/(sici)1096-9861(19980216)391:3<293::aid-cne2>3.0.co;2-x. [DOI] [PubMed] [Google Scholar]
- Burwell RD, Bucci DJ, Sanborn MR, Jutras MJ. Perirhinal and postrhinal contributions to remote memory for context. J Neurosci. 2004;24:11023–11028. doi: 10.1523/JNEUROSCI.3781-04.2004. [DOI] [PMC free article] [PubMed] [Google Scholar]
- Burwell RD, Hafeman DM. Positional firing properties of postrhinal cortex neurons. Neuroscience. 2003;119:577–588. doi: 10.1016/s0306-4522(03)00160-x. [DOI] [PubMed] [Google Scholar]
- Burwell RD, Shapiro ML, O'Malley MT, Eichenbaum H. Positional firing properties of perirhinal cortex neurons. Neuroreport. 1998;9:3013–3018. doi: 10.1097/00001756-199809140-00017. [DOI] [PubMed] [Google Scholar]
- Bussey TJ, Saksida LM, Murray EA. The perceptual-mnemonic/feature conjunction model of perirhinal cortex function. Q J Exp Psychol B. 2005;58:269–282. doi: 10.1080/02724990544000004. [DOI] [PubMed] [Google Scholar]
- Cho J, Sharp PE. Head direction, place, and movement correlates for cells in the rat retrosplenial cortex. Behav Neurosci. 2001;115:3–25. doi: 10.1037/0735-7044.115.1.3. [DOI] [PubMed] [Google Scholar]
- Davachi L, Mitchell JP, Wagner AD. Multiple routes to memory: distinct medial temporal lobe processes build item and source memories. Proc Natl Acad Sci U S A. 2003;100:2157–2162. doi: 10.1073/pnas.0337195100. [DOI] [PMC free article] [PubMed] [Google Scholar]
- Deshmukh SS, Knierim JJ. Representation of non-spatial and spatial information in the lateral entorhinal cortex. Front Behav Neurosci. 2011;5:69. doi: 10.3389/fnbeh.2011.00069. [DOI] [PMC free article] [PubMed] [Google Scholar]
- Deshmukh SS, Yoganarasimha D, Voicu H, Knierim JJ. Theta modulation in the medial and the lateral entorhinal cortices. J Neurophysiol. 2010;104:994–1006. doi: 10.1152/jn.01141.2009. [DOI] [PMC free article] [PubMed] [Google Scholar]
- Dolorfo CL, Amaral DG. Entorhinal cortex of the rat: topographic organization of the cells of origin of the perforant path projection to the dentate gyrus. J Comp Neurol. 1998;398:25–48. [PubMed] [Google Scholar]
- Eacott MJ, Machin PE, Gaffan EA. Elemental and configural visual discrimination learning following lesions to perirhinal cortex in the rat. Behav Brain Res. 2001;124:55–70. doi: 10.1016/s0166-4328(01)00234-0. [DOI] [PubMed] [Google Scholar]
- Ennaceur A, Neave N, Aggleton JP. Neurotoxic lesions of the perirhinal cortex do not mimic the behavioural effects of fornix transection in the rat. Behav Brain Res. 1996;80:9–25. doi: 10.1016/0166-4328(96)00006-x. [DOI] [PubMed] [Google Scholar]
- Epstein R, Kanwisher N. A cortical representation of the local visual environment. Nature. 1998;392:598–601. doi: 10.1038/33402. [DOI] [PubMed] [Google Scholar]
- Faulkner B, Brown TH. Morphology and physiology of neurons in the rat perirhinal-lateral amygdala area. J Comp Neurol. 1999;411:613–642. [PubMed] [Google Scholar]
- Frank LM, Brown EN, Wilson MA. A comparison of the firing properties of putative excitatory and inhibitory neurons from CA1 and the entorhinal cortex. J Neurophysiol. 2001;86:2029–2040. doi: 10.1152/jn.2001.86.4.2029. [DOI] [PubMed] [Google Scholar]
- Furtak SC, Wei SM, Agster KL, Burwell RD. Functional neuroanatomy of the parahippocampal region in the rat: the perirhinal and postrhinal cortices. Hippocampus. 2007;17:709–722. doi: 10.1002/hipo.20314. [DOI] [PubMed] [Google Scholar]
- Fyhn M, Molden S, Witter MP, Moser EI, Moser MB. Spatial representation in the entorhinal cortex. Science. 2004;305:1258–1264. doi: 10.1126/science.1099901. [DOI] [PubMed] [Google Scholar]
- Hafting T, Fyhn M, Molden S, Moser MB, Moser EI. Microstructure of a spatial map in the entorhinal cortex. Nature. 2005;436:801–806. doi: 10.1038/nature03721. [DOI] [PubMed] [Google Scholar]
- Hargreaves EL, Rao G, Lee I, Knierim JJ. Major dissociation between medial and lateral entorhinal input to dorsal hippocampus. Science. 2005;308:1792–1794. doi: 10.1126/science.1110449. [DOI] [PubMed] [Google Scholar]
- Hasselmo ME, Giocomo LM, Zilli EA. Grid cell firing may arise from interference of theta frequency membrane potential oscillations in single neurons. Hippocampus. 2007;17:1252–1271. doi: 10.1002/hipo.20374. [DOI] [PMC free article] [PubMed] [Google Scholar]
- Henze DA, Borhegyi Z, Csicsvari J, Mamiya A, Harris KD, Buzsaki G. Intracellular features predicted by extracellular recordings in the hippocampus in vivo. J Neurophysiol. 2000;84:390–400. doi: 10.1152/jn.2000.84.1.390. [DOI] [PubMed] [Google Scholar]
- Holm S. A simple sequential rejective multiple test procedure. Scandinavian Journal of Statistics. 1979;6:65–70. [Google Scholar]
- Knierim JJ, Lee I, Hargreaves EL. Hippocampal place cells: parallel input streams, subregional processing, and implications for episodic memory. Hippocampus. 2006;16:755–764. doi: 10.1002/hipo.20203. [DOI] [PubMed] [Google Scholar]
- Kubie JL, Muller RU, Bostock E. Spatial firing properties of hippocampal theta cells. J Neurosci. 1990;10:1110–1123. doi: 10.1523/JNEUROSCI.10-04-01110.1990. [DOI] [PMC free article] [PubMed] [Google Scholar]
- Manns JR, Eichenbaum H. Evolution of declarative memory. Hippocampus. 2006;16:795–808. doi: 10.1002/hipo.20205. [DOI] [PubMed] [Google Scholar]
- Manns JR, Eichenbaum H. A cognitive map for object memory in the hippocampus. Learn Mem. 2009;16:616–624. doi: 10.1101/lm.1484509. [DOI] [PMC free article] [PubMed] [Google Scholar]
- Martina M, Royer S, Pare D. Cell-type-specific GABA responses and chloride homeostasis in the cortex and amygdala. J Neurophysiol. 2001;86:2887–2895. doi: 10.1152/jn.2001.86.6.2887. [DOI] [PubMed] [Google Scholar]
- McNaughton BL, Barnes CA, O'Keefe J. The contributions of position, direction, and velocity to single unit activity in the hippocampus of freely-moving rats. Exp Brain Res. 1983;52:41–49. doi: 10.1007/BF00237147. [DOI] [PubMed] [Google Scholar]
- McNaughton BL, Battaglia FP, Jensen O, Moser EI, Moser MB. Path integration and the neural basis of the 'cognitive map'. Nat Rev Neurosci. 2006;7:663–678. doi: 10.1038/nrn1932. [DOI] [PubMed] [Google Scholar]
- Moita MA, Rosis S, Zhou Y, LeDoux JE, Blair HT. Hippocampal Place Cells Acquire Location-Specific Responses to the Conditioned Stimulus during Auditory Fear Conditioning. Neuron. 2003;37:485–497. doi: 10.1016/s0896-6273(03)00033-3. [DOI] [PubMed] [Google Scholar]
- Mumby DG, Pinel JP. Rhinal cortex lesions and object recognition in rats. Behav Neurosci. 1994;108:11–18. doi: 10.1037//0735-7044.108.1.11. [DOI] [PubMed] [Google Scholar]
- Murray EA, Bussey TJ, Saksida LM. Visual perception and memory: a new view of medial temporal lobe function in primates and rodents. Annu Rev Neurosci. 2007;30:99–122. doi: 10.1146/annurev.neuro.29.051605.113046. [DOI] [PubMed] [Google Scholar]
- Naber PA, Caballero-Bleda M, Jorritsma-Byham B, Witter MP. Parallel input to the hippocampal memory system through peri- and postrhinal cortices. Neuroreport. 1997;8:2617–2621. doi: 10.1097/00001756-199707280-00039. [DOI] [PubMed] [Google Scholar]
- Norman G, Eacott MJ. Impaired object recognition with increasing levels of feature ambiguity in rats with perirhinal cortex lesions. Behav Brain Res. 2004;148:79–91. doi: 10.1016/s0166-4328(03)00176-1. [DOI] [PubMed] [Google Scholar]
- Norman G, Eacott MJ. Dissociable effects of lesions to the perirhinal cortex and the postrhinal cortex on memory for context and objects in rats. Behav Neurosci. 2005;119:557–566. doi: 10.1037/0735-7044.119.2.557. [DOI] [PubMed] [Google Scholar]
- O'Keefe J. Do hippocampal pyramidal cells signal non-spatial as well as spatial information? Hippocampus . 1999;9:352–364. doi: 10.1002/(SICI)1098-1063(1999)9:4<352::AID-HIPO3>3.0.CO;2-1. [DOI] [PubMed] [Google Scholar]
- O'Keefe J, Nadel L. The hippocampus as a cognitive map. Oxford: Clarendon Press; 1978. [Google Scholar]
- Ranck JB., Jr Studies on single neurons in dorsal hippocampal formation and septum in unrestrained rats. I. Behavioral correlates and firing repertoires. Exp Neurol. 1973;41:461–531. doi: 10.1016/0014-4886(73)90290-2. [DOI] [PubMed] [Google Scholar]
- Sargolini F, Fyhn M, Hafting T, McNaughton BL, Witter MP, Moser MB, Moser EI. Conjunctive representation of position, direction, and velocity in entorhinal cortex. Science. 2006;312:758–762. doi: 10.1126/science.1125572. [DOI] [PubMed] [Google Scholar]
- Savelli F, Yoganarasimha D, Knierim JJ. Influence of boundary removal on the spatial representations of the medial entorhinal cortex. Hippocampus. 2008;18:1270–1282. doi: 10.1002/hipo.20511. [DOI] [PMC free article] [PubMed] [Google Scholar]
- Scoville WB, Milner B. Loss of recent memory after bilateral hippocampal lesions. J Neurol Neurosurg Psychiatry. 1957;20:11–21. doi: 10.1136/jnnp.20.1.11. [DOI] [PMC free article] [PubMed] [Google Scholar]
- Shapiro ML, Eichenbaum H. Hippocampus as a memory map: synaptic plasticity and memory encoding by hippocampal neurons. Hippocampus. 1999;9:365–384. doi: 10.1002/(SICI)1098-1063(1999)9:4<365::AID-HIPO4>3.0.CO;2-T. [DOI] [PubMed] [Google Scholar]
- Skaggs WE, McNaughton BL, Wilson MA, Barnes CA. Theta phase precession in hippocampal neuronal populations and the compression of temporal sequences. Hippocampus. 1996;6:149–172. doi: 10.1002/(SICI)1098-1063(1996)6:2<149::AID-HIPO6>3.0.CO;2-K. [DOI] [PubMed] [Google Scholar]
- Solstad T, Boccara CN, Kropff E, Moser MB, Moser EI. Representation of geometric borders in the entorhinal cortex. Science. 2008;322:1865–1868. doi: 10.1126/science.1166466. [DOI] [PubMed] [Google Scholar]
- Squire LR, Stark CE, Clark RE. The medial temporal lobe. Annu Rev Neurosci. 2004;27:279–306. doi: 10.1146/annurev.neuro.27.070203.144130. [DOI] [PubMed] [Google Scholar]
- Suzuki WA, Miller EK, Desimone R. Object and place memory in the macaque entorhinal cortex. J Neurophysiol. 1997;78:1062–1081. doi: 10.1152/jn.1997.78.2.1062. [DOI] [PubMed] [Google Scholar]
- Taube JS, Muller RU, Ranck JB., Jr Head-direction cells recorded from the postsubiculum in freely moving rats. I. Description and quantitative analysis. J Neurosci. 1990;10:420–435. doi: 10.1523/JNEUROSCI.10-02-00420.1990. [DOI] [PMC free article] [PubMed] [Google Scholar]
- Wan H, Aggleton JP, Brown MW. Different contributions of the hippocampus and perirhinal cortex to recognition memory. J Neurosci. 1999;19:1142–1148. doi: 10.1523/JNEUROSCI.19-03-01142.1999. [DOI] [PMC free article] [PubMed] [Google Scholar]
- Wiebe SP, Staubli UV. Dynamic filtering of recognition memory codes in the hippocampus. J Neurosci. 1999;19:10562–10574. doi: 10.1523/JNEUROSCI.19-23-10562.1999. [DOI] [PMC free article] [PubMed] [Google Scholar]
- Witter MP, Amaral DG. Hippocampal formation. In: Paxinos G, editor. The rat nervous system. 3rd ed. Amsterdam: Elsevier; 2004. pp. 635–704. [Google Scholar]
- Wouterlood FG, Hartig W, Bruckner G, Witter MP. Parvalbumin-immunoreactive neurons in the entorhinal cortex of the rat: localization, morphology, connectivity and ultrastructure. J Neurocytol. 1995;24:135–153. doi: 10.1007/BF01181556. [DOI] [PubMed] [Google Scholar]
- Yoganarasimha D, Rao G, Knierim JJ. Lateral entorhinal neurons are not spatially selective in cue-rich environments. Hippocampus. 2011;21:1363–1374. doi: 10.1002/hipo.20839. [DOI] [PMC free article] [PubMed] [Google Scholar]
- Young BJ, Otto T, Fox GD, Eichenbaum H. Memory representation within the parahippocampal region. J Neurosci. 1997;17:5183–5195. doi: 10.1523/JNEUROSCI.17-13-05183.1997. [DOI] [PMC free article] [PubMed] [Google Scholar]
- Zhu XO, Brown MW, Aggleton JP. Neuronal signalling of information important to visual recognition memory in rat rhinal and neighbouring cortices. Eur J Neurosci. 1995a;7:753–765. doi: 10.1111/j.1460-9568.1995.tb00679.x. [DOI] [PubMed] [Google Scholar]
- Zhu XO, Brown MW, McCabe BJ, Aggleton JP. Effects of the novelty or familiarity of visual stimuli on the expression of the immediate early gene c-fos in rat brain. Neuroscience. 1995b;69:821–829. doi: 10.1016/0306-4522(95)00320-i. [DOI] [PubMed] [Google Scholar]