

Abstract
Purpose
Low serum albumin concentration and low dietary protein intake are associated with protein-energy wasting (PEW) and higher mortality in maintenance hemodialysis patients. The role of these nutritional markers is less clear in clinical outcomes of the first several months of dialysis therapy, where mortality is exceptionally high.
Methods
In a cohort of 17,445 incident hemodialysis patients, we examined variation in serum albumin and the normalized protein catabolic rate (nPCR), a surrogate of dietary intake, and quarterly mortality in the first 2 years of dialysis therapy. Cox proportional hazard models were fitted to estimate the association between mortality and combined albumin/nPCR categories for eight quarters. We investigated the associations between mortality and baseline and subsequent serum albumin levels per cohort quarter as well as changes in albumin and nPCR over time.
Results
Patients were 64 ± 15 years old (mean ± SD) and included 45 % women, 24 % African Americans and 58 % diabetics. Correlations between quarterly serum albumin and nPCR varied from 0.18 to 0.25. Serum albumin <3.5 g/dL was consistently associated with high mortality as was nPCR <1 g/kg/day (except for qtr1). Low serum albumin and nPCR greater than 0.2 g/dLg/dL or g/kg/day, respectively, were associated with increased risk of death. Quarterly rise in nPCR (>+0.2 g/kg/day) showed reverse effect on mortality from the 2nd to the last quarter.
Conclusions
Low serum albumin and nPCR are associated with mortality. A rapid rise in nPCR by the end of the second year may indicate pre-existing PEW.
Keywords: Hemodialysis, Mortality, Albumin, Protein catabolic rate
Introduction
Serum albumin (Alb) and normalized protein nitrogen appearance (nPNA also called nPCR) are important indicators of nutritional status in dialysis patients. Several factors may contribute to low levels of albumin such as urinary albumin loss, inadequate dietary intake, and inflammation [1]. Concentration of serum albumin is associated with nPCR as well as with an acute phase proteins (APPs), C-reactive protein (CRP), and α1 acid glycoprotein (α1AG) [2–5]. Dialysis affects protein metabolism through losses in substrate and increase in the net protein catabolism. During a dialysis session, 6–12 g of amino acids is lost, and the ribosome content of muscles decreases indicating decrease in protein synthesis [6]. Additionally, inflammation can decrease albumin synthesis and increase albumin fractional catabolic rate (FCR) [2].
Dialysis Outcomes and Practice Patterns Study (DOPPS) in the US reported that patients with serum albumin below 3.5 g/dL had higher risk of death [7]. Ten-year cohort study reported increased risk of death in patients with serum albumin below 3.8 g/dL [8]. Estimated population attributable fraction (PAF) of death for maintenance hemodialysis (MHD) patients with albumin lower than 3.8 g/dL was 19 %. Hypothetically, 10,000 deaths could be prevented in the USA annually if serum albumin levels in MHD patients were at least 3.8 g/dL [9]. A Meta-analysis of 38 studies with total of 265,330 patients showed an inverse relationship between albumin, all-cause, and cardiovascular mortality [10]. Shinaberger et al. [11] reported that a decrease in a daily protein intake by 0.2 g/kg/day during 6 months was associated with increased risk of death in the following 18 months.
We hypothesized that a combination of serum albumin and nPCR levels may be predictive of mortality in dialysis patients in the first 24 months after a dialysis initiation. Higher levels of albumin and nPCR could represent better nutritional status and less inflammation in ESRD patients. Patients with serum levels of albumin above 3.5 g/dL and nPCR levels above 1.00 g/kg/day may have better survival during the first 2 years of dialysis, and an increase in serum albumin and nPCR may improve patient's survival during the same time period.
Methods
Sources of data, study population, and follow-up
We examined a cohort of incident hemodialysis patients who started a hemodialysis treatment from July 01, 2001, to June 30, 2006, at one of DaVita's dialysis centers. Patients receiving peritoneal dialysis were excluded.
We combined information from DaVita databases with data from USRDS using a unique patient identifier [12]. Patients were followed up to 5 years (1,830 days) or until death, kidney transplantation, or the end of the follow-up. Person-time was obtained by calculating the difference between the date of the first ever hemodialysis treatment and the end of follow-up or other censoring events. All the quarterly laboratory measurements were converted into cohort-quarters where the first quarter represented the baseline measurements at the time of dialysis initiation rather than a calendar time of entry into a DaVita cohort.
Alb and nPCR as predictors of mortality
We examined the associations between mortality during each of the first eight quarters of dialysis and combined levels of serum albumin and nPCR for the same quarters creating the following combined categories: (1) Albumin > 3.5 g/dL *nPCR ≥1 g/kg/day; (2) Albumin > 3.5 g/dL *nPCR < 1 g/kg/day; (3) Albumin < 3.5 g/dL *nPCR ≥ 1 g/kg/day; (4) Albumin < 3.5 g/dL *nPCR < 1 g/kg/day.
The choice of categories was justified as follows: since serum albumin was a marker of both nutrition and inflammation status, we tried to separate these two effects by combining albumin with nPCR, a marker for a dietary protein intake. Patients with high nPCR but low serum albumin would likely have adequate nutrition, and low albumin would indicate inflammation; patients with low nPCR and serum albumin over 3.5 g/dL may have inadequate nutritional status but perhaps were less likely to have an inflammation, while patients with low values for both parameters could be malnourished and have an inflammation, and patients with higher values for both parameters were more likely to have neither of the two conditions.
Additionally, we examined serum levels of albumin and nPCR as separate predictors of mortality during the first 8 quarters on dialysis. We chose the same categories for serum albumin (comparing mortality for patients with <3.5 g/dL vs. ≥3.5 g/dL) and nPCR (≥1 g/kg/day vs. <1 g/kg/day) for each of eight quarters.
Finally, we calculated differences between the measurements taken during each of the quarters and the prior quarter for quarters 2–8 for serum levels of albumin and nPCR. We then created “ change categories” for both laboratory parameters where change between −0.2 to 0.2 g/dL for albumin and −0.2 to 0.2 g/kg/day were considered stable, while changes in over 0.2 units were defined, respectively, as a decrease or an increase in the laboratory parameter.
All blood samples were drawn using standardized procedure and transported to the Central DaVita Laboratory located in Deland, FL usually within 24 h. Blood or serum levels of albumin and creatinine were measured monthly. Estimated prescribed dialysis treatment dose, known as Kt/V (single pool) [13], and protein intake (nPCR) [11] were obtained using urea dynamic equations.
Statistical analyses
Descriptive analyses were conducted to examine population characteristics across four combined albumin/nPCR categories. We also calculated mean serum levels of albumin and nPCR for each quarter on dialysis and at baseline separately for patients who died during a quarter and for those who survived. We examined correlations between serum levels of albumin and nPCR by calculating correlation coefficients for each of 8 quarters.
Additionally, we examined associations between the risk of death during each of 8 quarters and the continuous values of serum albumin and, separately, of nPCR. We rescaled the units for both serum levels of albumin and nPCR by defining biologically and clinically meaningful increments of 0.2 g/dL for albumin and 0.2 g/kg/day for nPCR. The results are presented in the online supplement.
We fitted Cox proportional hazard models to examine the associations between survival during each of the eight quarters of dialysis and either combined Alb/nPCR categories, change categories, or separate Alb or nPCR predictors. Case-mix adjustment was used in all of survival analyses (see Tables 2, 3, 4 for description of the models). Additionally, we fitted the models with an interaction term between Alb and nPCR; however, it did not change our results, and the p values for the interaction were over 0.05 in all models.
Table 2.
HR for the case-mix models looking at the mortality for each of the first 8 qtrs on dialysis among combined nPCR and Alb measurements with Alb > 3.5 and nPCR > 1 as a reference category (HR = 1) for incident HD patients from 5-year DaVita cohort 07/01-06/06
| QTR in cohort | HR (95 % CI) nPCR < 1ALB > 3.5a | HR (95 % CI) npcr > 1ALB < 3.5a | HR (95 % CI) nPCR < 1ALB < 3.5a |
|---|---|---|---|
| 1–3 months (qtr1) | 0.72 (0.59–0.88) | 2.50 (1.86–3.11) | 1.86 (1.54–2.25) |
| 4–6 months (qtr2) | 1.26 (0.93–1.71) | 3.34 (2.46–4.53) | 4.48 (3.40–5.89) |
| 7–9 months (qtr3) | 1.53 (0.97–2.42) | 5.80 (4.24–7.92) | 6.94 (5.07–9.50) |
| 10–12 months (qtr4) | 1.29 (0.95–1.75) | 4.99 (3.38–7.35) | 5.56 (3.61–8.58) |
| 13–15 months (qtr5) | 0.92 (0.54–1.58) | 3.52 (2.53–4.89) | 6.53 (5.07–8.41) |
| 16–18 months (qtr6) | 0.98 (0.74–1.31) | 6.96 (3.67–9.66) | 6.69 (4.85–9.22) |
| 19–21 months (qtr7) | 1.10 (0.73–1.69) | 5.05 (2.54–10.03) | 5.94 (3.92–9.00) |
| 22–24 months (qtr8) | 0.93 (0.59–1.47) | 3.98 (2.19–7.24) | 4.60 (2.68–7.92) |
Case-mix adjustment included adjustment for gender, race/ethnicity (African Americans, Hispanics, non-Hispanic whites, and others), and the parameters measured at baseline such as: age, primary insurance (Medicare, Medicaid, and others), marital status (married, single, divorced, or widowed), dialysis vascular access [central venous catheter (CVC), arteriovenous fistula (AVF), and arteriovenous graft (AVG)], dialysis dose (single pool Kt/V), diabetes mellitus, atherosclerosis, congestive heart failure (CHF), other cardiac conditions, cerebrovascular disease (CVA), peripheral vascular disease (PVD), chronic obstructive pulmonary disease (COPD), cancer, hypertension, inability to ambulate, smoking status, and a calendar quarter indicating time of entry into a DaVita cohort for a secular trend. All the models starting from quarter 2 were also adjusted for the baseline levels of albumin and nPCR
nPCR > 1 ALB > 3.5 = ref group (HR = 1)
Table 3. Hazard ratios of death for the change in serum levels of ALB and nPCR from the prior quarter to the quarter of interest for the first 8 quarters of dialysis treatment for incident hemodialysis patients from 5-year DaVita cohort; 07/01-06/06.
| QTR in cohort | HR (95 % CI) Δ ALB ↓over 0.2 g/dLa |
HR (95 % CI) Δ ALB ↑over 0.2 g/dL |
|---|---|---|
| q2-q1 | 2.57 (2.23–2.97) | 0.47 (0.40–0.56) |
| q3-q2 | 3.54 (2.92–4.29) | 0.93 (0.76–1.13) |
| q4-q3 | 3.40 (2.82–4.10) | 0.69 (0.52–0.91) |
| q5-q4 | 3.14 (2.51–3.92) | 1.09 (0.79–1.52) |
| q6-q5 | 3.40 (2.73–4.24) | 0.71 (0.52–0.99) |
| q7-q6 | 3.57 (2.84–4.49) | 0.88 (0.62–1.27) |
| q8-q7 | 3.81 (2.92–4.97) | 0.80 (0.52–1.23) |
|
| ||
| QTR in cohort | Δ nPCR ↓over 0.2 g/kg/daya | Δ nPCR ↑over 0.2 g/kg/day |
|
| ||
| q2-q1 | 1.65 (1.34–2.03) | 0.69 (0.57–0.83) |
| q3-q2 | 2.38 (1.73–3.26) | 0.90 (0.64–1.27) |
| q4-q3 | 1.74 (1.26–2.42) | 1.17 (0.76–1.80) |
| q5-q4 | 2.04 (1.26–3.29) | 1.30 (0.81–2.08) |
| q6-q5 | 2.60 (1.67–4.06) | 1.32 (0.82–2.14) |
| q7-q6 | 2.64 (1.71–4.08) | 1.64 (0.81–3.32) |
| q8-q7 | 2.99 (1.83–4.87) | 2.77 (1.74–4.41) |
Case-mix adjustment included adjustment for gender, race/ethnicity (African Americans, Hispanics, non-Hispanic whites, and others), and the parameters measured at baseline such as: age, primary insurance (Medicare, Medicaid, and others), marital status (married, single, divorced, or widowed), dialysis vascular access [central venous catheter (CVC), arteriovenous fistula (AVF), and arteriovenous graft (AVG)], dialysis dose (single pool Kt/V), diabetes mellitus, atherosclerosis, congestive heart failure (CHF), other cardiac conditions, cerebrovascular disease (CVA), peripheral vascular disease (PVD), chronic obstructive pulmonary disease (COPD), cancer, hypertension, inability to ambulate, smoking status, and a calendar quarter indicating time of entry into a DaVita cohort for a secular trend. All the models starting from quarter 2 were also adjusted for the baseline levels of albumin and nPCR
reference = no change (HR = 1)
Table 4. Hazard ratios of death for the combined change in serum levels of ALB and nPCR from the prior quarter to the quarter of interest for the first 8 quarters of dialysis treatment for incident hemodialysis patients from 5-year DaVita cohort; 07/01-06/06.
| ↓Alb; ↓nPCR | ↓Alb; no change nPCR | ↓Alb; ↑nPCR | No change Alb; ↓nPCR | No change Alb and nPCR | No change Alb; ↑nPCR | ↑Alb; ↓nPCR | ↑Alb; no change nPCR | ↑Alb; ↑nPCR | |
|---|---|---|---|---|---|---|---|---|---|
| q2-ql | 3.16 (2.20–4.54) | 3.07 (2.30–4.09) | 2.91 (2.11–.01) | 1.37 (0.90–2.11) | 1.00 (1.00–1.00) | 0.99 (0.77–1.29) | 0.57 (0.33–1.00) | 0.60 (0.49–073) | 0.45 (0.31–0.65) |
| q3-q2 | 5.92 (3.90–8.98) | 3.37 (2.56–4.45) | 4.27 (2.65–6.87) | 1.21 (0.66–2.23) | 1.00 (1.00–1.00) | 1.12 (0.71–1.75) | 1.75 (0.97–3.16) | 0.88 (0.60–1.30) | 0.64 (0.46–0.89) |
| q4-q3 | 4.58 (3.17–6.60) | 3.84 (2.83–5.21) | 4.00 (2.40–6.59) | 1.11 (0.72–1.72) | 1.00 (1.00–1.00) | 1.18 (0.80–1.74) | 0.66 (0.25–175) | 0.87 (0.60–1.25) | 0.89 (0.60–1.34) |
| q5-q4 | 5.43 (3.31–8.91) | 3.01 (2.17–4.18) | 3.38 (1.61–7.11) | 1.22 (0.54–2.79) | 1.00 (1.00–1.00) | 1.48 (0.94–2.33) | 0.50 (0.13–2.00) | 0.62 (0.37–1.03) | 0.89 (0.41–1.92) |
| q6-q5 | 4.53 (2.77–7.41) | 3.41 (2.34–4.97) | 4.21 (1.43–12.42) | 1.79 (0.75–4.21) | 1.00 (1.00–1.00) | 1.32 (0.68–2.53) | 0.80 (0.16–4.07) | 0.64 (0.40–1.01) | 1.00 (0.44–2.27) |
| q7-q6 | 4.48 (2.57–7.81) | 2.98 (2.12–4.20) | 10.48 (5.02–21.87) | 1.58 (0.99–2.52) | 1.00 (1.00–1.00) | 0.97 (0.47–1.99) | 0.58 (0.09–3.68) | 0.87 (0.51–1.54) | 0.94 (0.29–3.04) |
| q8-q7 | 11.0(6.75–17.99) | 3.51 (2.23–5.54) | 11.4 (6.02–21.69) | 1.89 (0.72–4.95) | 1.00 (1.00–1.00) | 3.11 (2.03–4.76) | 0.38 (0.02–7.08) | 1.10 (0.56–2.15) | 2.27 (0.70–7.34) |
Case-mix adjustment included adjustment for gender, race/ethnicity (African Americans, Hispanics, non-Hispanic whites, and others), and the parameters measured at baseline such as: age, primary insurance (Medicare, Medicaid, and others), marital status (married, single, divorced, or widowed), dialysis vascular access [central venous catheter (CVC), arteriovenous fistula (AVF), and arteriovenous graft (AVG)], dialysis dose (single pool Kt/V), diabetes mellitus, atherosclerosis, congestive heart failure (CHF), other cardiac conditions, cerebrovascular disease (CVA), peripheral vascular disease (PVD), chronic obstructive pulmonary disease (COPD), cancer, hypertension, inability to ambulate, smoking status, and a calendar quarter indicating time of entry into a DaVita cohort for a secular trend. All the models starting from quarter 2 were also adjusted for the baseline levels of albumin and nPCR
All the analyses were conducted by using SAS 9.3 software (SAS Inc., NC).
Results
From July 1, 2001, to June 30, 2006, 82,566 patients started hemodialysis treatment at a DaVita dialysis clinic within the first 90 days of therapy initiation. After excluding patients younger than 18 (n = 637), incident peritoneal dialysis patients (n = 4,763), hemodialysis patients with missing person-time (n = 6), hemodialysis patients who initiated the first week of dialysis therapy outside of a DaVita clinic (n = 58,453), 18,707 incident hemodialysis patients remained. During the first 24 months, 6,666 patients died (36 % or 30 deaths per 100 person years) and 1,399 received a kidney transplant. Furthermore, patients with missing values for the serum levels of albumin and nPCR for all their time in cohort (n = 1,262) were excluded, and a total of 17,445 was used in the analyses.
The mean age for the patients in the study was 64, 45 % were females, 24 % were African Americans, and 58 % were diabetics. At baseline, mean serum level of albumin was 3.49 g/dL and mean nPCR level was 0.87 g/kg/day with 44 % of patients having serum albumin levels less than 3.5 g/dL and 73 % having nPCR less than 1 g/kg/day.
Table 1 shows demographic characteristics by the combined serum albumin and nPCR categories at baseline (N = 13,740). There racial distribution differed between the groups, especially between the reference group and the group with Alb <3.5 g/dL and nPCR <1 g/kg/day (53 % of whites and 19 % of blacks vs. 48 % whites and 27 % blacks, respectively), as well as type of vascular access (47 % catheter use vs. 69 %), % of patients with diabetes (54 vs. 66 %), and baseline serum levels of creatinine (7.2 vs. 5.6, respectively).
Table 1. Patients' characteristics at baseline by combined low versus high Alb and low versus high nPCR (2 × 2 = 4) categories in the 5-year cohort (07/01-06/06) of 17,445 incident hemodialysis patients.
| Population characteristics N = 13,740 |
nPCR > 1 ALB > 3.5 N = 2,373 |
nPCR < 1 ALB > 3.5 N = 5,566 |
nPCR > 1 ALB < 3.5 N = 1,272 |
nPCR < 1 ALB < 3.5 N = 4,529 |
p |
|---|---|---|---|---|---|
| Age | 63 ± 15 | 63 ± 16 | 65 ± 15 | 64 ± 15 | <.0001 |
| Gender (% female) | 41 | 43 | 45 | 49 | <.0001 |
| Diabetes mellitus (%) | 54 | 51 | 65 | 66 | <.0001 |
| Race (%) | |||||
| White | 53 | 55 | 50 | 48 | <.0001 |
| Black | 19 | 26 | 19 | 27 | <.0001 |
| Hispanic | 15 | 11 | 18 | 15 | <.0001 |
| Other | 12 | 8 | 13 | 9 | <.0001 |
| Primary insurance (%) | |||||
| Medicare | 55 | 56 | 57 | 60 | <.0001 |
| Medicaid | 5 | 5 | 6 | 7 | <.0001 |
| Other | 40 | 39 | 37 | 33 | <.0001 |
| Marital status (%) | |||||
| Married | 57 | 54 | 57 | 48 | <.0001 |
| Divorced | 8 | 7 | 5 | 8 | <.0001 |
| Single | 21 | 24 | 20 | 27 | <.0001 |
| Widowed | 14 | 15 | 18 | 18 | <.0001 |
| Kt/V (dialysis dose) | 1.5 ± 0.4 | 1.3 ± 0.4 | 1.5 ± 0.4 | 1.3 ± 0.4 | <.0001 |
| Vascular access (%) | |||||
| Dialysis catheter | 47 | 52 | 63 | 69 | <.0001 |
| AVF | 33 | 30 | 20 | 15 | <.0001 |
| Graft | 20 | 18 | 17 | 15 | 0.0006 |
| Comorbid conditions (%) | |||||
| Cancer | 5 | 5 | 6 | 6 | 0.03 |
| Atherosclerotic heart disease | 19 | 20 | 22 | 22 | 0.06 |
| Heart failure | 22 | 22 | 30 | 29 | <.0001 |
| Pulmonary disease (COPD) | 5 | 6 | 7 | 6 | 0.07 |
| Cerebrovascular disease (CVA) | 7 | 8 | 8 | 9 | 0.02 |
| History of hypertension | 80 | 81 | 77 | 76 | <.0001 |
| Other heart diseases | 2 | 2 | 5 | 5 | <.0001 |
| Non-ambulatory | 5 | 6 | 7 | 7 | 0.0003 |
| Peripheral vascular disease PVD | 10 | 11 | 14 | 14 | <.0001 |
| Smoker+ | 3 | 5 | 3 | 5 | 0.001 |
| Serum levels | |||||
| Creatinine (mg/dL) | 7.2 ± 3 | 6.3 ± 3 | 6.7 ± 3 | 5.6 ± 3 | <.0001 |
| TIBC (mg/dL) | 246 ± 49 | 241 ± 47 | 210 ± 50 | 199 ± 52 | <.0001 |
| Bicarbonate (mg/dL) | 21 ± 4 | 22 ± 3 | 21 ± 4 | 23 ± 3 | <.0001 |
| Phosphorus (mg/dL) | 5.7 ± 2 | 5.0 ± 1 | 5.7 ± 2 | 4.9 ± 1 | <.0001 |
| Calcium (mg/dL) | 9.0 ± 1 | 9.1 ± 1 | 8.6 ± 1 | 8.6 ± 1 | <.0001 |
| Ferritin (ng/mL) | 283 ± 363 | 258 ± 313 | 416 ± 529 | 374 ± 500 | <.0001 |
| Blood hemoglobin (g/dL) | 11.2 ± 1 | 11.2 ± 1 | 10.6 ± 1 | 10.7 ± 1 | <.0001 |
| WBC (×103/l) | 7.7 ± 3 | 7.5 ± 3 | 8.9 ± 4 | 8.2 ± 3 | <.0001 |
| Lymphocyte (% of WBC) | 18 ± 7 | 19 ± 7 | 15 ± 7 | 17 ± 8 | <.0001 |
| ISAT (%) | 24 ± 7 | 23 ± 10 | 24 ± 12 | 23 ± 11 | 0.005 |
| ALKP (u/L) | 105 ± 65 | 103 ± 55 | 130 ± 134 | 131 ± 104 | <.0001 |
| PHT (pg/dL) | 492 ± 437 | 450 ± 403 | 443 ± 417 | 396 ± 361 | <.0001 |
| Epogen dose (units/treatment) | 8,375 ± 4,537 | 8,791 ± 4,572 | 9,373 ± 4,647 | 10,025 ± 4,992 | <.0001 |
| Zemplar dose (mcg/treatment) | 4.1 ± 4 | 4.0 ± 3 | 4.0 ± 3 | 3.7 ± 3 | 0.02 |
| BMI (kg/m2) | 27 ± 6 | 28 ± 7 | 26 ± 7 | 27 ± 7 | <.0001 |
| eGFR (mL/min) | 9.4 ± 4 | 10.0 ± 4 | 9.8 ± 5 | 10.8 ± 5 | <.0001 |
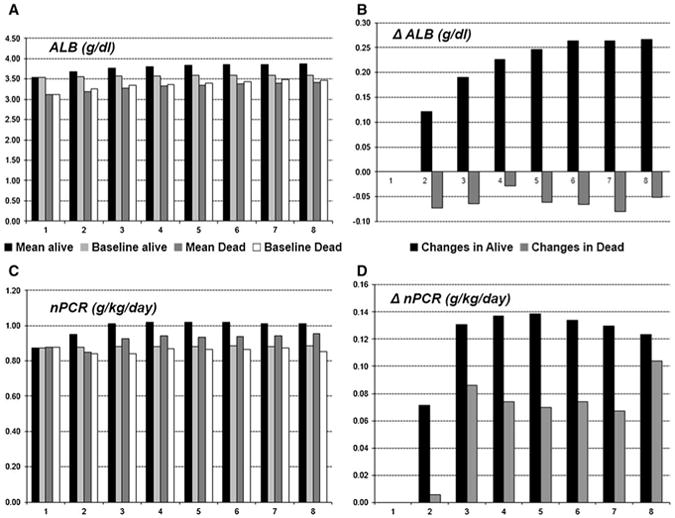
Tables 1S. A and B examined the mean serum levels of albumin and nPCR for each of 8 quarters in the cohort by survival status at the end of the quarter. We also looked at the baseline serum albumin and nPCR values for the same patients and calculated the differences between the means for quarterly and baseline values for each group (Fig. 1). In mentioned tables and figure, we observed a steady increase in mean levels of serum albumin and somewhat moderate increase in nPCR levels over time among patients who were alive by the end of the quarter, while among those who died, mean albumin levels were lower compared to baseline.
Fig. 1. Mean serum levels of albumin and nPCR for each of the 8 quarters in cohort by survival by the end of the qtr compared to mean baseline values for the same group and changes in means from baseline to each quarter by survival; N = 17,745.
Correlations between serum albumin and nPCR were examined for each quarter with correlation coefficients varying from 0.18 to 0.25 (p < 0.0001) (Scattered plots presented in online supplement Figure 1S). Previously reported correlations for albumin and nPCR varied from 0.06 to 0.26 [2, 5, 11, 14, 15].
In all analyses, we consistently observed an association between low serum level of nPCR and improved survival during the first 3 months of dialysis treatment which reversed after the first quarter.
Table 2 and Fig. 2 present the case-mix-adjusted death hazard ratios for the eight quarters on dialysis for combined categories for albumin and nPCR. Patients with serum albumin levels less than 3.5 g/dL had substantial increase in mortality, especially after 3rd quarter (four- to fivefolds) regardless of nPCR values. In comparison, nPCR seemed to have a lesser effect and did not depend on serum levels of albumin.
Fig. 2. Hazard ratios of death comparing combined Alb/nPCR categories or the first 8 quarters (24 months) of dialysis treatment among incident hemodialysis patients from 5-year DaVita cohort; 07/01-06/06.

Additionally, we examined change in serum levels of albumin and nPCR from the prior quarter to the quarter of interest (Table 3; Fig. 3). We examined change in mean levels of serum albumin and nPCR from the prior quarter to the quarter of interest separately for patients who survived until the end of quarter and those who died during it. We found that among patients who died during each of the quarters, mean values for serum level of albumin always decreased from the prior quarter (Fig. 3a). We observed an increase in nPCR levels in all patients from the previous quarter (higher in surviving patients) for the first 9 months of treatment with some decrease in patients who died during later quarters (Fig. 3b).
Fig. 3.
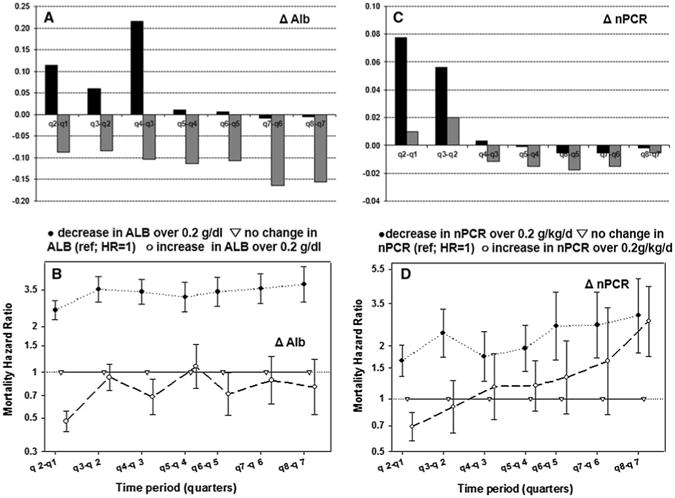
Change in the mean serum levels of ALB and nPCR from the previous quarter to the quarter of interest separately for alive (black) patients and those who died during the quarter (gray) (a, c) and Hazard ratios of death comparing increase and decrease in serum levels to no change (b, d) for incident dialysis patients from 5-year DaVita cohort; 07/01-06/06
We observed strong (over threefold increase) consistent association between a decrease in serum albumin over 02 g/dL and mortality, while an increase in serum level of albumin over 0.2 g/dL had showed only moderate survival advantage (Fig. 3c). Interestingly, the association between change in nPCR and mortality was not consistent over time. While a decline in nPCR was associated with an increase in mortality (although not as strong as decrease in albumin), an increase in serum level of nPCR over 0.2 g/kg/day was protective only during first 6 months. It showed no survival advantage and became strongly associated with mortality by the end of a second year (HR = 2.77) (Fig. 3d).
Finally, we examined a change from the previous quarter in the combined serum levels of albumin and nPCR (Table 4). We observed the highest increase in risk of death when both serum albumin and nPCR decreased over 0.2 units. In a separate analysis, we observed an increase in the risk of death during the last quarter among the patients with increased levels of nPCR, especially evident when serum level of albumin decreased for over 0.2 g/dL.
Table 2S and Figure 2S indicate that an increase in Alb and nPCR were both associated with lower mortality. Here, we present all-cause mortality analysis. The associations between infectious, cardiovascular mortality, and serum albumin (<3.5 g/dL vs. >3.5 g/dL) for this population were described elsewhere.
Discussion
Low serum albumin in dialysis patients is known to be associated with both malnutrition and inflammation [5, 16] and nPCR is associated with dietary protein intake [11]. The links between low appetite and inflammation [17] as well as between inflammation, anemia, and malnutrition were reported previously [18]. Albumin and nPCR were determined to be independent predictors of mortality in MHD patients [15]. In our study, we attempted to separate those effects by creating 4 combined Alb and nPCR categories and examining all-cause mortality for different categories over the first 8 quarters of dialysis treatment.
Additionally, we examined the mean levels of albumin and nPCR for each quarter and compared them to the baseline measurements. The lowest serum levels for both parameters were recorded at the time of dialysis initiation. This can be due to a volume overload that many patients experience prior and shortly after starting renal replacement therapy (RRT) [5]. A study by Chandna et al. [14] observed a substantial drop in nPCR in CKD patients in the 3 months preceding initiation of dialysis. National Kidney Foundation's K/DOQI clinical practice guidelines recommend daily protein intake from 06 to 0.8 g/kg/day for CKD patients, but 1.2–1.3 g/kg/day for MHD patients, which could also contribute to low nPCR levels at baseline [19]. nPCR could be increased in hemodialysis patients after 2 months of taking protein dietary supplements [20]. In fact, among patients in our study, 73 % had nPCR less than 1 g/kg/day at the time of dialysis initiation, but by the end of month 6, this number decreased to 50 % and remained unchanged by the end of a 2nd year which may explain the protective role of low nPCR in the first 3 months of dialysis treatment consistently observed in all our analyses.
The mean for serum albumin increased with every quarter of dialysis treatment for patients who were alive at the end of the quarter, but it was consistently lower compared to the baseline for the patients who died. The fact that we observed an increase in the serum level of albumin for each consecutive quarter among surviving patients may suggest a survival advantage for the healthier patients who had higher serum albumin levels at baseline. However, while the mean level of serum albumin increased over time, it was higher among surviving patients, but lower for patients who died during the quarter of interest while comparing to their own baseline values which may also indicate positive effect of dialysis treatment among survivors.
While examining mortality among 4 combined Alb and nPCR categories, we found that low serum albumin was associated with higher mortality independent of nPCR levels. The weakest associations were observed during the time of dialysis initiation, and the strength of associations increased after 3–6 months.
The strong association between low levels of serum albumin and mortality was observed in all our models and was consistent for all 8 quarters. While our results were consistent with those previously reported [2, 5, 8, 9], we were the first to examine mortality patterns from quarter to quarter. Importantly, survival advantage of higher and increasing serum albumin levels persisted over time. Positive association between low level of nPCR and mortality was reported before [11, 14] and was observed in our study although the strength was lower compared to the effects of albumin.
Examining changes in serum levels of albumin from the previous quarter to the next for the first 8 quarters showed consistently strong association (over threefold for most quarters) between the risk of death and decrease in albumin over 0.2 g/dL, while increase was inversely associated with mortality. Although we are not aware of any studies examining mortality patterns and their association with changes in serum levels of albumin over time, an association between a change in albumin and mortality was shown previously either for the shorter follow-up or as cumulative measure [21, 22].
As we examined changes in serum level of nPCR over time, we found that decline in nPCR over 0.2 g/kg/day within a 3-month period was associated with elevated risk of death. The association was previously noted, although not as a pattern for over 2-year time period [11, 21]. The surprising finding was that an increase in nPCR over 0.2 g/kg/day appeared to have protective effect only for the first 6–9 months after which it became uncertain. It showed strong positive association with mortality after 21st month of a followup. It was previously reported that rapid increase in nPCR or nPCR over 1.4 g/kg/day may be attributed to negative nitrogen balance, increase in catabolic rate during infection, or inflammation [11]. The fact that in our study this effect became clearly visible only during the last quarter may indicate that the rapid increase in nPCR from quarter 7 to 8 in some patients can be due to increase in catabolic rate because of protein-energy wasting (PEW) that progresses as dialysis vintage increases. In fact, the mean level of creatinine for patients who died during qtr 8 and had increase in nPCR for over 0.2 g/kg/day was 7.7 mg/dL, but it was 8.6 for patients from the same group who survived for at least to 24 months. The mean weight for the same patients was 63 kg compared to 76 kg among those who had an increase in nPCR but survived. The change in weight from the previous quarter was −1.3 kg for those who died and had rapid increase in nPCR from the previous quarter, while surviving patients showed 0.5 kg weight gain for the same time period. When we examined combined changes in serum albumin and nPCR, it was evident that during the last quarter, patients with decrease in nPCR had the same elevated risk of death as patients with increased nPCR, which was especially evident in a group of patients with decreased serum level of albumin.
Several randomized studies reported an increase in serum levels of albumin due to increase in dietary protein intake when patients were given nutritional oral supplements during dialysis sessions [23, 24]. After reviewing published nutritional studies of dialysis patients from 1970 to 2009, Kalantar-Zadeh et al. [25] concluded that providing patients with in-center oral supplements showed an increase in serum levels of albumin and in dietary protein intake, and decrease in overall and cardiovascular mortality in dialysis patients. A review by Dukkipati et al. [26] concluded that the intradialytic parenteral nutrition (IDPN) and intravenous infusion of essential nutrients during hemodialysis treatment had good safety profile and could potentially improve protein and energy status and decrease a risk of PEW. Loss of nutrients through dialysis, poor appetite, and weight loss are common problems for patients receiving RRT [27].
As previous studies showed, use of the in-center oral supplementation may play an important role in increasing serum levels of albumin by increasing a dietary protein intake [12, 23–25]. While in-center meals for dialysis patients are standard practice in many European and Asian countries, most dialysis clinics in the USA do not offer them. Providing patients with meals or oral supplements during a dialysis therapy can be efficient and cost-effective way to improve their nutritional status, which can lead to a better quality of life and a longer survival [25]. This can be important for patients with low serum albumin and nPCR levels, especially for those with rapid increase in nPCR due to acceleration of a catabolic rate. Policy changes regarding the in-center nutritional practices may be required before this practice can become widely adapted in the USA.
To our knowledge, this is one of the largest longitudinal studies of incident dialysis patients that attempted to look at the serum levels of albumin and nPCR over the first 24 months of dialysis treatment associated with mortality patterns. The novelty of our study is that we look separately and in great detail at each quarter examining the effects of serum levels of albumin and nPCR in an attempt to separate the effects of malnutrition and inflammation associated with low albumin. Unfortunately, we did not have information on CRP levels for our cohort which could potentially help us to account for inflammation with greater certainty as the CRP's role, a marker of inflammation, is well established as is its association with low serum levels of albumin in MHD patients [3–5]. Neither had we information about dietary practices, hence the protein or caloric intake, of the patients enrolled.
Conclusion
Low quarterly serum albumin levels were strongly associated with an increase in all-cause mortality in incident hemodialysis patients during the first 24 months of dialysis treatment regardless of levels of nPCR. Moreover, decline in serum level of albumin over 0.2 g/dL from the prior quarter was also a strong predictor of mortality.
Quarterly levels of nPCR lower than 1 g/kg/day were associated with increased risk of death except for the first 3 months of dialysis treatment. Decrease in nPCR over 0.2 g/kg/day was predictive of higher mortality which could indicate that maintaining a daily protein intake of 1–1.2 g/kg/day after initiation of dialysis treatment could be beneficial to hemodialysis patients.
An abrupt increase of 0.2 g/kg/day or higher in serum level of nPCR after 21 months of dialysis treatment may be an indicator of PEW process and such change should be viewed with caution, especially if loss of weight and decline in serum creatinine occurs simultaneously. This should be carefully monitored in patients with rapid decline in serum albumin level combined with increase in nPCR. Dietary modifications increasing daily protein intake in this patient group may be necessary. Policies promoting in-center meals or oral supplementation for patients receiving RRT may be required in order to improve nutritional status of the patients, which can lead to better life and longer survival.
Supplementary Material
Acknowledgments
We thank DaVita Clinical Research (DCR) for providing the clinical data, analysis, and review for this research project and for advancing the knowledge and practice of kidney care. The study was supported by a research grant from the National Institute of Diabetes, Digestive and Kidney Disease of the National Institutes of Health R01 DK078106, a philanthropist grant from Mr. Harold Simmons and a research grant from DaVita Clinical Research. OAA was supported by a Veni career grant # 916.96.059 from the Netherlands Organization for Scientific Research (NWO).
Footnotes
Electronic supplementary material The online version of this article (doi:10.1007/s11255-013-0459-2) contains supplementary material, which is available to authorized users.
Conflict of interest: None declared.
Contributor Information
Lilia R. Lukowsky, Division of Nephrology and Hypertension, Harold Simmons Center for Chronic Disease Research and Epidemiology, Los Angeles Biomedical Research Institute at Harbor-UCLA Medical Center, 1124 West Carson Street, C1-Annex, Torrance, CA 90509-2910, USA, Department of Epidemiology, UCLA Fielding School of Public Health, Los Angeles, CA, USA
Leeka Kheifets, Department of Epidemiology, UCLA Fielding School of Public Health, Los Angeles, CA, USA.
Onyebuchi A. Arah, Department of Epidemiology, UCLA Fielding School of Public Health, Los Angeles, CA, USA, Department of Public Health, Academic Medical Center, University of Amsterdam, Amsterdam, The Netherlands
Allen R. Nissenson, David Geffen School of Medicine at UCLA, Los Angeles, CA, USA; DaVita, Inc, El Segundo, CA, USA
Kamyar Kalantar-Zadeh, Email: kamkal@ucla.edu, Division of Nephrology and Hypertension, Harold Simmons Center for Chronic Disease Research and Epidemiology, Los Angeles Biomedical Research Institute at Harbor-UCLA Medical Center, 1124 West Carson Street, C1-Annex, Torrance, CA 90509-2910, USA, Department of Epidemiology, UCLA Fielding School of Public Health, Los Angeles, CA, USA, David Geffen School of Medicine at UCLA, Los Angeles, CA, USA.
References
- 1.Beto J. Improving first-year mortality in patients on dialysis: a focus on nutrition and exercise. Nephrol Nurs J. 2010;37(1):61–65. 98. [PubMed] [Google Scholar]
- 2.Kaysen GA, Dubin JA, Muller HG, Mitch WE, Rosales LM, Levin NW. Relationships among inflammation nutrition and physiologic mechanisms establishing albumin levels in hemodialysis patients. Kidney Int. 2002;61(6):2240–2249. doi: 10.1046/j.1523-1755.2002.00076.x. [DOI] [PubMed] [Google Scholar]
- 3.Meuwese CL, Stenvinkel P, Dekker FW, Carrero JJ. Monitoring of inflammation in patients on dialysis: forewarned is forearmed. Nat Rev Nephrol. 2011;7(3):166–176. doi: 10.1038/nrneph.2011.2. [DOI] [PubMed] [Google Scholar]
- 4.Kaysen GA, Chertow GM, Adhikarla R, Young B, Ronco C, Levin NW. Inflammation and dietary protein intake exert competing effects on serum albumin and creatinine in hemodialysis patients. Kidney Int. 2001;60(1):333–340. doi: 10.1046/j.1523-1755.2001.00804.x. [DOI] [PubMed] [Google Scholar]
- 5.de Mutsert R, Grootendorst DC, Indemans F, Boeschoten EW, Krediet RT, Dekker FW. Association between serum albumin and mortality in dialysis patients is partly explained by inflammation, and not by malnutrition. J Ren Nutr. 2009;19(2):127–135. doi: 10.1053/j.jrn.2008.08.003. [DOI] [PubMed] [Google Scholar]
- 6.Garibotto G, Sofia A, Saffioti S, Bonanni A, Mannucci I, Verzola D. Amino acid and protein metabolism in the human kidney and in patients with chronic kidney disease. Clin Nutr. 2010 doi: 10.1016/j.clnu.2010.02.005. [DOI] [PubMed] [Google Scholar]
- 7.Bradbury BD, Fissell RB, Albert JM, Anthony MS, Critchlow CW, Pisoni RL, Port FK, Gillespie BW. Predictors of early mortality among incident US hemodialysis patients in the dialysis outcomes and practice patterns study (DOPPS) Clin J Am Soc Nephrol. 2007;2(1):89–99. doi: 10.2215/CJN.01170905. [DOI] [PubMed] [Google Scholar]
- 8.Kato A, Takita T, Furuhashi M, Maruyama Y, Hishida A. Comparison of serum albumin, C-reactive protein and carotid atherosclerosis as predictors of 10-year mortality in hemodialysis patients. Hemodial Int. 2010;14(2):226–232. doi: 10.1111/j.1542-4758.2009.00432.x. 10. 1111/j.1542-4758.2009.00432.x. [DOI] [PubMed] [Google Scholar]
- 9.Kalantar-Zadeh K, Kilpatrick RD, Kuwae N, McAllister CJ, Alcorn H, Jr, Kopple JD, Greenland S. Revisiting mortality predictability of serum albumin in the dialysis population: time dependency, longitudinal changes and population-attributable fraction. Nephrol Dial Transplant. 2005;20(9):1880–1888. doi: 10.1093/ndt/gfh941. [DOI] [PubMed] [Google Scholar]
- 10.Herselman M, Esau N, Kruger JM, Labadarios D, Moosa MR. Relationship between serum protein and mortality in adults on long-term hemodialysis: exhaustive review and meta-analysis. Nutrition. 2010;26(1):10–32. doi: 10.1016/j.nut.2009.07.009. [DOI] [PubMed] [Google Scholar]
- 11.Shinaberger CS, Kilpatrick RD, Regidor DL, McAllister CJ, Greenland S, Kopple JD, Kalantar-Zadeh K. Longitudinal associations between dietary protein intake and survival in hemodialysis patients. Am J Kidney Dis. 2006;48(1):37–49. doi: 10.1053/j.ajkd.2006.03.049. [DOI] [PubMed] [Google Scholar]
- 12.Researcher's Guide to the USRDS Database—2008. ADR. United States Renal Data System National Institutes of Health; National Institute of Diabetes and Digestive Disease and Kidney Disease Division of Kidney Urologic and Hematologic Diseases; Betheda, MD: 2008. [Google Scholar]
- 13.Miller JE, Kovesdy CP, Nissenson AR, Mehrotra R, Streja E, Van Wyck D, Greenland S, Kalantar-Zadeh K. Association of hemodialysis treatment time and dose with mortality and the role of race and sex. Am J Kidney Dis. 2010;55(1):100–112. doi: 10.1053/j.ajkd.2009.08.007. [DOI] [PMC free article] [PubMed] [Google Scholar]
- 14.Chandna SM, Kulinskaya E, Farrington K. A dramatic reduction of normalized protein catabolic rate occurs late in the course of progressive renal insufficiency. Nephrol Dial Transplant. 2005;20(10):2130–2138. doi: 10.1093/ndt/gfh940. [DOI] [PubMed] [Google Scholar]
- 15.Mancini A, Grandaliano G, Magarelli P, Allegretti A. Nutritional status in hemodialysis patients and bioimpedance vector analysis. J Ren Nutr. 2003;13(3):199–204. doi: 10.1016/s1051-2276(03)00079-7. [DOI] [PubMed] [Google Scholar]
- 16.Ikizler TA. Common nutritional misconceptions in dialysis patients. Semin Dial. 2011;24(5):510–512. doi: 10.1111/j.1525-139X.2011.00988.x. [DOI] [PubMed] [Google Scholar]
- 17.Kalantar-Zadeh K, Block G, McAllister CJ, Humphreys MH, Kopple JD. Appetite and inflammation, nutrition, anemia, and clinical outcome in hemodialysis patients. Am J Clin Nutr. 2004;80(2):299–307. doi: 10.1093/ajcn/80.2.299. [DOI] [PubMed] [Google Scholar]
- 18.Lowrie EG. Acute-phase inflammatory process contributes to malnutrition, anemia, and possibly other abnormalities in dialysis patients. Am J Kidney Dis. 1998;32(6 Suppl 4):S105–S112. doi: 10.1016/s0272-6386(98)70172-6. [DOI] [PubMed] [Google Scholar]
- 19.Dukkipati R, Noori N, Feroze U, Kopple JD. Dietary protein intake in patients with advanced chronic kidney disease and on dialysis. Semin Dial. 2010;23(4):365–372. doi: 10.1111/j.1525-139X.2010.00753.x. [DOI] [PubMed] [Google Scholar]
- 20.Patel MG, Kitchen S, Miligan PJ. The effect of dietary supplements on the nPCR in stable hemodialysis patients. J Ren Nutr. 2000;10(2):69–75. doi: 10.1053/jren.2000.0069. [DOI] [PubMed] [Google Scholar]
- 21.Pifer TB, McCullough KP, Port FK, Goodkin DA, Maroni BJ, Held PJ, Young EW. Mortality risk in hemodialysis patients and changes in nutritional indicators: DOPPS. Kidney Int. 2002;62(6):2238–2245. doi: 10.1046/j.1523-1755.2002.00658.x. [DOI] [PubMed] [Google Scholar]
- 22.Mehrotra R, Duong U, Jiwakanon S, Kovesdy CP, Moran J, Kopple JD, Kalantar-Zadeh K. Serum albumin as a predictor of mortality in peritoneal dialysis: comparisons with hemodialysis. Am J Kidney Dis. 2011;58(3):418–428. doi: 10.1053/j.ajkd.2011.03.018. [DOI] [PMC free article] [PubMed] [Google Scholar]
- 23.Moretti HD, Johnson AM, Keeling-Hathaway TJ. Effects of protein supplementation in chronic hemodialysis and peritoneal dialysis patients. J Ren Nutr. 2009;19(4):298–303. doi: 10.1053/j.jrn.2009.01.029. [DOI] [PubMed] [Google Scholar]
- 24.Bolasco P, Caria S, Cupisti A, Secci R, Saverio Dioguardi F. A novel amino acids oral supplementation in hemodialysis patients: a pilot study. Ren Fail. 2011;33(1):1–5. doi: 10.3109/0886022x.2010.536289. [DOI] [PubMed] [Google Scholar]
- 25.Kalantar-Zadeh K, Cano NJ, Budde K, Chazot C, Kovesdy CP, Mak RH, Mehrotra R, Raj DS, Sehgal AR, Stenvinkel P, Ikizler TA. Diets and enteral supplements for improving outcomes in chronic kidney disease. Nat Rev Nephrol. 2011;7(7):369–384. doi: 10.1038/nrneph.2011.60. [DOI] [PMC free article] [PubMed] [Google Scholar]
- 26.Dukkipati R, Kalantar-Zadeh K, Kopple JD. Is there a role for intradialytic parenteral nutrition? A review of the evidence. Am J Kidney Dis. 2010;55(2):352–364. doi: 10.1053/j.ajkd.2009.08.006. 10.1053/j. ajkd.2009.08.006. [DOI] [PubMed] [Google Scholar]
- 27.Kalantar-Zadeh K, Ikizler TA, Block G, Avram MM, Kopple JD. Malnutrition-inflammation complex syndrome in dialysis patients: causes and consequences. Am J Kidney Dis. 2003;42(5):864–881. doi: 10.1016/j.ajkd.2003.07.016. [DOI] [PubMed] [Google Scholar]
Associated Data
This section collects any data citations, data availability statements, or supplementary materials included in this article.