Abstract.
The use of in vivo contrast-enhanced magnetic resonance (MR) imaging as a surrogate for photosensitizer (verteporfin) dosimetry in photodynamic therapy of pancreas cancer is demonstrated by correlating MR contrast uptake to ex vivo fluorescence images on excised tissue. An orthotopic pancreatic xenograft mouse model was used for the study. A strong correlation () was found for bulk intensity measurements of T1-weighted gadolinium enhancement and verteporfin fluorescence in the tumor region of interest. The use of contrast-enhanced MR imaging shows promise as a method for treatment planning and photosensitizer dosimetry in human photodynamic therapy (PDT) of pancreas cancer.
Keywords: dosimetry, photodynamic therapy, pancreas cancer, verteporfin, magnetic resonance imaging
Photodynamic therapy (PDT) has been investigated for treatment of pancreatic cancer (PaC) in a clinical trial (VERTPAC) using the photosentizing agent verteporfin.1,2 PDT for PaC involves the injection and uptake of verteporfin within tumor tissue followed by activation of the drug using 690-nm light delivered through interstitial optical fibers. One difficulty in performing repeatable and accurate PDT for PaC is the highly heterogenous uptake of verteporfin within the tumor tissue due to large amounts of stroma, necrotic tissue, and highly variable vascular patterns. This creates significant challenges for the accurate measurement of drug delivery and subsequent treatment fiber placement. In the VERTPAC dose escalation study,1 heterogeneous response to PDT was observed at all dose levels, possibly due to low local concentrations of verteporfin. While direct measurement of the photosensitizer at the site of the fiber implantation is possible, this provides a very small data set and incomplete information given the wide variation expected in drug delivery. Treatment planning could be greatly enhanced by noninvasively imaging photosensitizer distribution using clinically relevant imaging systems that are not influenced by tissue and blood optical properties. Here, contrast-enhanced magnetic resonance (MR) imaging using the gadolinium (Gd)-based contrast agent Magnevist® (Bayer Healthcare Pharmaceuticals, Wayne, NJ) is tested as a dosimetric surrogate for verteporfin imaging.
Both verteporfin and Magnevist® are vascular perfusion-based molecules that at short time periods remain in normal, healthy vasculature but perfuse into surrounding tissue in areas with compromised blood vessels, such as tumors or tissues with vascular diseases (retinopathy, etc.). They have similar molecular weights (938 and for Magnevist® and verteporfin, respectively), but their structure and distribution phases differ significantly. According to the manufacturer’s information sheet, Magnevist® has a distribution and elimination half-life of and , respectively, and verteporfin has a distribution and elimination half-life of 0.1 (calculated from Ref. 3) and 5.8 h, respectively.3,4
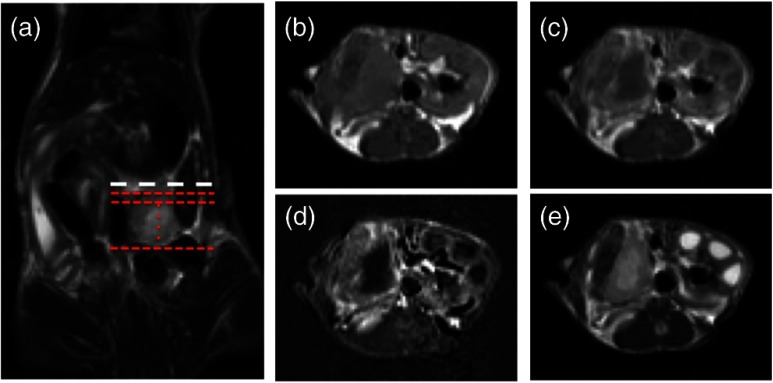
An orthotopic xenograft (AsPC-1) murine model () for PaC PDT was used in accordance with the policies and approved protocol of the Institutional Animal Care and Use Committee (IACUC) at Dartmouth College.5 The animals were fed a chlorophyll-free diet (MP Biomedicals, Solon, OH) to minimize autofluorescence. The tumors were imaged after they had reached a volume of by measurement with externally applied calipers. MR images were obtained using a Phillips Achieva 3.0T X-series MRI with a modified rodent coil (Philips Research Europe, Hamburg, Germany), as previously described.5,6 Gd-based contrast enhancement (, Magnevist®) was delivered via a catheter (MTV-01, Braintree Scientific Inc., Braintree, MA) placed in the intraperitoneal (i.p.) cavity. After a preliminary survey, a T2-weighted turbo spin echo (T2W-TSE) sequence was performed in sagittal, axial, and coronal imaging planes. The tumor was identified in each imaging plane, and the best orientation for tumor resection, slicing, and image correlation was chosen. Typically, the axial T2W-TSE image sequence was selected for the tissue-slicing plane and the coronal T2W-TSE was used to align the image scans with the outermost edge of the tumor, termed the tumor origin [Fig. 1(a)]. After the scanning slices were aligned to the tumor, the images used for analysis were collected as follows: a T1-weighted turbo spin echo [T1W-TSE, Fig. 1(b)] image sequence was performed; Magnevist® was administered; a T2W-TSE image sequence [Fig. 1(c)] was collected during contrast localization and then a postcontrast T1W-TSE [Fig. 1(d)] image sequence was performed 10 min after injection. The T1W-TSE contrast difference [T1W-CD=(post-Gd T1W-TSE)−(pre-Gd T1W-TSE), Fig. 1(e)] image sequence was calculated using the Phillips MRI software.
Fig. 1.
Magnetic resonance imaging (MRI) scans of orthotopic AsPC-1 tumors. (a) A T2W coronal scan was used to determine tumor position and align axial slice markers for tumor slices of interest. The bold dashed line (white) is the “tumor origin” and the smaller dashed lines (red) are a representation of the 1-mm image slices, not drawn to scale. The axial image slices are used for analysis, and a single slice is shown for each scan type: (b) T1W pre-gadolinium (Gd) administration, (c) T1W post-Gd, (d) T1W contrast difference, and (e) T2W.
Verteporfin () was administered via tail vein 60 min prior to sacrifice and the tumor was extracted, ensuring that the orientation of the tumor was preserved. Ex vivo tissue slices (1 mm) were obtained using an Acrylic Adjustable Tissue Matrix (TM S12, Braintree Scientific, Braintree, MA) and Mx35 Premier Microtome Blade (Thermos Scientific, Rockford, IL) such that the first slice was made 1 mm from the tumor origin, maintaining the MR image alignment. Six to eight slices were made per tumor, for a total of 52 tissue slices. Verteporfin fluorescence images were collected immediately after sectioning by imaging the ex vivo tissue slices for each mouse on an Odyssey Infrared Imaging System (LI-COR Biosciences, Lincoln, NE) using the 700-nm channel and a resolution of 21 μm. After imaging, the tissue slices were fixed in formalin and prepared for hematoxylin and eosin (H&E) staining (Research Pathology Services, Dartmouth Hitchcock Medical Center, Lebanon, NH).
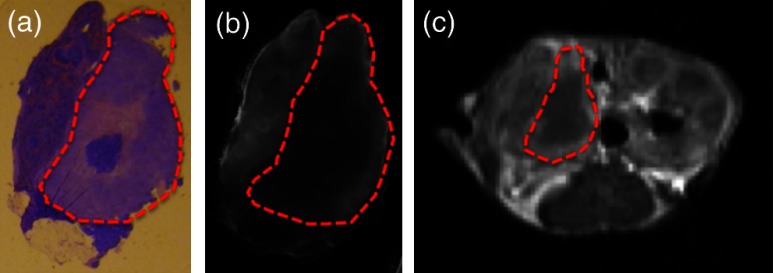
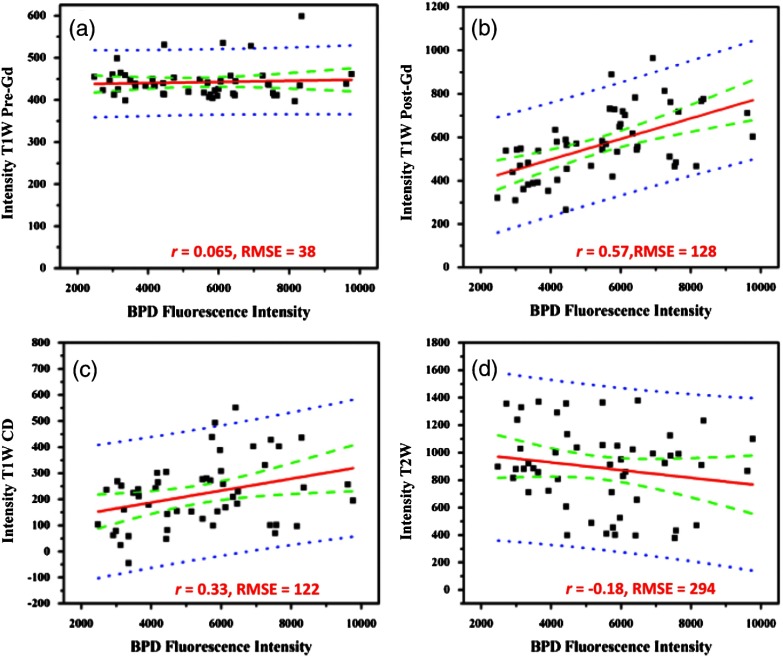
The verteporfin fluorescence images were compared to each type of MR image (T1W pre-Gd, T1W post-Gd, T1WCD, and T2W) in order to determine if a correlation existed. Regions of interest (ROI) were demarcated using the H&E-stained tissue and transferred to the verteporfin fluorescence and multiple MR images using the NIH freeware ImageJ (http://rsbweb.nih.gov/ij/, Fig. 2) and only applying an -rotation of the ROI if needed to appropriately align and measure the tumor region. For each fluorescent and MR image, the background was subtracted to remove instrumentation noise. For each corresponding tissue slice, average pixel intensities within the ROI were determined and compared using Pearson’s product-moment correlation (Fig. 3) to determine the proportional linear association. The Pearson’s correlation coefficient, , describes the strength of the association where a value of 0 to 0.1, 0.1 to 0.3, 0.3 to 0.5, and 0.5 to 1.0 indicates no, weak, medium, and strong correlations, respectively, and can be negative or positive depending on the sign. In addition, the root-mean square error (RMSE) reported in arbitrary units of signal intensity was calculated for each fluorescence and MR image pair and indicates the standard deviation from the best-fit line.
Fig. 2.
A representative tumor slice is shown to demonstrate region of interest (ROI, red dashed line) selection. A 4-μm H&E section (a) is used to distinguish the tumor and then transferred to the ex vivo fluorescence image of verteporfin (b) and one of the four MR images, T1W post-Gd is used for demonstration (c).
Fig. 3.
Linear regressions and Pearson correlation coefficients () indicate that BPD fluorescence has no correlation with (a) T1W pre-gadolinium (Gd), (b) a strong, positive correlation with T1W post-Gd, (c) a medium positive correlation with T1W contrast difference, and (d) a weak negative correlation with T2W. Root-mean squared error (RMSE) is reported in arbitrary units of intensity. Black squares: individual slices from each animal; solid red line: best-fit line; dashed green lines: 95% confidence limit; and dotted blue line: 95% prediction limit.
The T1W post-Gd images had a strong, positive linear correlation (, ) with verteporfin fluorescence [Fig. 3(b)] and there was a medium, positive correlation (, ) between verteporfin distribution and T1WCD MR images [Fig. 3(c)]. The RMSE of the T1W post-Gd and T1WCD data points is moderate indicating some deviation from the best-fit line. The correlation between Gd in the T1W post-Gd and verteporfin indicates that contrast-enhanced MRI could be a potential surrogate for dosimetry measurements, treatment planning, and guidance of fiber placement. Although the image contrast between the tumor and normal tissue in the T1WCD is enhanced due to the subtraction of the nonenhancing regions, the correlation is not as strong as seen in the T1W post-Gd images. This is likely due to the increased error in the difference image, as compared to the individual pre- and post-Gd images. Attempts at correlating the different highlighting regions (i.e., outer edge versus center of tumor) were not possible in this study due to the large differences in image resolution between the MR and fluorescence images and the lack of true pixel-by-pixel image registration. Anecdotally, the heterogeneous pattern of both fluorescence and Gd enhancement can be observed in Fig. 2 where there is significant highlighting of the outer edges of the tumor in both the T1W post-Gd and verteporfin fluorescence images, but not the center of the tumor, which has a high propensity to be necrotic.5
There was no proportional correlation (, ) observed between verteporfin fluorescence and the T1W pre-Gd MR image [Fig. 3(a)] even though the RMSE is low, indicating that the data was closely related to the best-fit line. This was expected, as T1W images without contrast enhancement will display areas with similar protein content as having homogeneous intensity and is further demonstrated by near zero slope and narrow confidence intervals. In addition, a weak, negative linear correlation and a high RMSE (, ) were observed between verteporfin fluorescence and T2W MR images [Fig. 3(d)]. Even though all points lie within the 95% predication limits on the linear regression, the spread is much wider than in any of the other image comparisons. T2W MR images highlight free water within tissue; therefore edemic regions, that tend to be necrotic in this case, will be highlighted but do not accumulate contrast agents. This is illustrated well in Fig. 1 where the center of the tumor has higher intensity in the T2W image [Fig. 1(e)] but remains nonenhanced in the Gd contrast images [Figs. 1(c) and 1(d)].
Inaccuracies in the ex vivo alignment of the sliced tumor tissue with in vivo images may have caused errors in the reported correlations. It is unlikely that this error in correlation is due to large tumor tissue deformation as the AsPC-1 orthotopic tumors are quite firm. It is more likely that rotational errors occurred during tissue removal or an alignment error on the MR scans. However, only bulk average intensities were used here, such that errors in image alignment, tissue deformation, or tissue rotation would be small. These errors could be reduced in the future by freezing, slicing, and imaging the whole mouse abdomen ex vivo. It would be advantageous in future studies to correlate histological features with verteporfin uptake. In vivo MRI scans have been accurately correlated to ex vivo histology using an intermediate MRI scan ex vivo excised tissue and rigorous registration algorithms,7–9 and it would be valuable to extend these techniques to fluorescence imaging. Additionally, administrating Magnevist® and verteporfin by intravascular injection may increase the spatial correlation. Taking into consideration the distribution time for each agent minimized the effect of the different routes of administration (i.e., 10 and 60 min for verteporfin and Magnevist®, respectively).
Correlating accumulation of verteporfin and Gd within the tumor tissue shows promise as a new method for surrogate dosimetry for PaC. However, these trends may not extend to other photosensitizers, depending on the inherent vascular dynamics. Additionally, the patient flow in the VERTPAC study utilizes computed tomography (CT) contrast to locate the tumor and plan fiber placement for therapy, not MR contrast. Parallel efforts within our laboratory have used tissue properties derived from the treatment planning CT scans and simulations of the correlating light dose to predict necrotic volumes in patients post-therapy.10 The feasibility of repeating the study presented here using a clinical contrast CT for surrogate dosimetry is low due to the poor resolution and sensitivity of whole body CT in the murine model. Therefore, a VX2 pancreas tumor model in rabbits was developed,11 and ongoing studies are being performed using a clinical CT scanner and i.v. administered Omnipaque™ to extend this promising dosimetry technique into clinical practice.
Acknowledgments
This work has been funded by NIH research grant PO1CA084203.
References
- 1.Huggett M. T., et al. , “Photodynamic therapy of locally advanced pancreatic cancer (VERTPAC study): final clinical results,” Proc. SPIE 8568, 85680J (2013). 10.1117/12.2013648 [DOI] [Google Scholar]
- 2.Sandanayake N. S., et al. , “Photodynamic therapy for locally advanced pancreatic cancer: early clinical results,” Proc. SPIE 7551, 75510L (2010). 10.1117/12.846555 [DOI] [Google Scholar]
- 3.Zhou X., et al. , “Analysis of effective molecular diffusion rates for verteporfin in subcutaneous versus orthotopic dunning prostate tumors,” Photochem. Photobiol. 79(4), 323–331 (2004). 10.1562/MU-03-31.1 [DOI] [PubMed] [Google Scholar]
- 4.Houle J.-M., Strong A., “Clinical pharmacokinetics of verteporfin,” J. Clin. Pharmacol. 42(5), 547–557 (2002). 10.1177/00912700222011607 [DOI] [PubMed] [Google Scholar]
- 5.Samkoe K. S., et al. , “Imaging tumor variation in response to photodynamic therapy in pancreatic cancer xenograft models,” Int. J. Radiat. Oncol. Biol. Phys. 76(1), 251–259 (2010). 10.1016/j.ijrobp.2009.08.041 [DOI] [PMC free article] [PubMed] [Google Scholar]
- 6.Davis S. C., et al. , “Magnetic resonance-coupled fluorescence tomography scanner for molecular imaging of tissue,” Rev. Sci. Instrum. 79(6), 064302 (2008). 10.1063/1.2919131 [DOI] [PMC free article] [PubMed] [Google Scholar]
- 7.Alic L., et al. , “Facilitating tumor functional assessment by spatially relating 3D tumor histology and in vivo MRI: image registration approach,” PLoS One 6(8), e22835 (2011). 10.1371/journal.pone.0022835 [DOI] [PMC free article] [PubMed] [Google Scholar]
- 8.Meyer C. R., et al. , “A methodology for registration of a histological slide and in vivo MRI volume based on optimizing mutual information,” Mol. Imaging 5(1), 16–23 (2006). [PMC free article] [PubMed] [Google Scholar]
- 9.Zhan Y., et al. , “Registering Histologic and MR Images of Prostate for Image-based Cancer Detection,” Acad. Radiol. 14(11), 1367–1381 (2007). 10.1016/j.acra.2007.07.018 [DOI] [PMC free article] [PubMed] [Google Scholar]
- 10.Jermyn M., et al. , “Photodynamic therapy light dose analysis of a patient based upon arterial and venous contrast CT scan information,” Proc. SPIE 8568, 85680Z (2013). 10.1117/12.2004003 [DOI] [Google Scholar]
- 11.Gunn J., et al. , “Pancreas tumor model in rabbit imaged by perfusion CT scans,” Proc. SPIE 8568, 85681E (2013). 10.1117/12.1518470 [DOI] [Google Scholar]


