

DISCUSSION POINTS
-
The National Hospital Ambulatory Medical Care Survey (NHAMCS) is an annual, federally funded survey of a national, representative, multistage, stratified sample of hospital visits, including emergency department (ED) visits, in the United States. Data are collected in real time by local hospital staff or by a Census Bureau field representative. In light of multiple recent high-profile articles published based on publicly available NHAMCS data, we revisit observational study design, with a particular emphasis on the use of large, publicly available data such as NHAMCS. In this journal club exercise, we use 2 recent publications to help guide the discussion: Pitts et al, [1] “National Trends in Emergency Department Occupancy, 2001 to 2008: Effect of Inpatient Admissions Versus Emergency Department Practice Intensity,” and McCaig et al, [2] “Understanding and Interpreting the National Hospital Ambulatory Medical Care Survey: Key Questions and Answers.”
(NOV) A. Review the general steps of the scientific method.
Discuss at least 2 goals that Pitts et al [1] report as motivation for conducting this study. What is the primary hypothesis? If you think there is more than 1 primary hypothesis in this study, comment on whether a study should have more than 1 primary hypothesis. What was the study design?
(NOV) B. Review the concepts of exposure variable, outcome variable, and confounding.
(NOV) C. What are the primary exposure(s) and outcome for each hypothesis?
(INT)D. What confounders are included in the models? Why might variables be included in an analysis even though they do not meet the definition of a confounder?
-
In the methods section, the authors note that they used aggregate data to construct the independent (exposure) and dependent (outcome) variables.
(NOV) A. What are aggregate data?
(INT) B. Compare and contrast individual-level data and aggregate-level data.
(ADV) C. What assumptions are being made when aggregate data are used to approximate individual data? Give an example of how using aggregate data rather than individual-level data might change how one would interpret study results.
(ADV) D. Describe the concept of ecologic fallacy. How might it affect the interpretation of data from NHAMCS to reflect the behavior of individual ED patients?
-
Consider the following when using an annual, weighted, random sample of ED visits:
(INT) A. How are the data combined across multiple years? (INT)
B. Describe 2 potential concerns when combining variables across multiple years.
-
NHAMCS is a publicly available data set accessible on the Centers for Disease Control and Prevention’s Web site (http://www.cdc.gov/nchs/ahcd/ahcd_questionnaires.htm). McCaig et al [2] noted that a restricted NHAMCS data set is available for a fee.
(NOV) A. Where is information about the restricted NHAMCS data set located?
(NOV) B. What additional variables are included in the NHAMCS restricted data set?
(INT) C. Discuss 2 hypotheses you might explore using the restricted NHAMCS data set that may not be feasible using the publicly available data set.
-
The systematic sampling of a national population is a great strength of NHAMCS. The quality of the data abstraction processes has been called into question, however.[3]
EDs often have different processes for patient flow and admission; some EDs have observation units, some use alternative locations for patient evaluations, and there is variability in when the transfer of care from the ED to the hospital team occurs. Different NHAMCS study sites might not use uniform definitions for these variables. For example, one center might classify a patient with chest pain who is admitted to an ED observation unit disposition as an admission, whereas another site might classify an identical patient as an ED treat and release, with a long length of stay.
(INT) A. Discuss how these different classifications might affect investigations of ED management metrics (eg, time to disposition, resource use, ED length of stay). How might these differences in NHAMCS variable classification be addressed?
(ADV) B. Assuming unlimited access to time, money, and resources, what study design(s) might you consider to explore the degree to which ED boarding and intensity of care contribute to ED crowding? Is a randomized, controlled trial a feasible option?
(ADV) C. What other variables would you like to include in the NHAMCS data set to explore the question of whether boarding and intensity of care are associated with or are causal factors in ED crowding?
ANSWER 1
The National Hospital Ambulatory Medical Survey (NHAMCS) is an annual, federally funded survey of a national representative, multistage, stratified sample of hospital visits, including ED visits, in the United States. Data are collected in real-time by local hospital staff or by a Census Bureau field representative. In light of multiple recent high-profile articles published based on publicly available NHAMCS data, we revisit observational study design, with a particular emphasis on the use of large, publicly available data such as NHAMCS. In this journal club exercise, we use two recent publications to help guide the discussion: Pitts et al., “National Trends in Emergency Department Occupancy, 2001 to 2008: Effect of Inpatient Admissions Versus Emergency Department Practice Intensity” and McCaig et al, “Understanding and Interpreting the National Hospital Ambulatory Medical Care Survey: Key Questions and Answers.”
1A (NOV)
Review the general steps of the scientific method. Discuss at least 2 goals that Pitts et al.1 report as motivation for conducting this study. What are the primary hypotheses? If you think there is more than one primary hypothesis in this study, comment on whether a study should have more than 1 primary hypothesis. What was the study design?
The scientific method is a structured approach to conducting a research study that strives to maximize internal validity of the study. Many studies in health services research seek to assess the relationship between an exposure and an outcome, and what might explain the relationship (i.e. the cause of a particular shortcoming in the quality of healthcare delivery). For example, Pitts et al1 sought to understand the causes of ED crowding. Using the scientific method, researchers accumulate evidence regarding the association between an exposure and an outcome. If the study is properly structured, an argument can be made that this association may represent a causal relationship.4,5
As a systematic approach to exploring and attempting to answer questions, the scientific method may be simplified to the following general steps: ask a question → perform background research/literature search → construct a testable hypothesis → conduct a test/experiment → analyze results → interpret results in the context of previous work in the field→ disseminate findings. Although the randomized clinical trial (RCT) can be a robust study design to test an hypothesis, many questions of clinical interest cannot be examined with an RCT due to ethical and practical reasons; for example, it is neither practical nor ethical to randomize patients into prolonged boarding v. shorter boarding times to assess whether boarding increases mortality. Instead, we analyze and interpret results obtained by observing “natural experiments,” observing patients after exposures to see if they develop an outcome/disease of interest. Detailed discussion of these issues is found in the original Hill Burton manuscript,4 as well as in the compilation of editorials by epidemiology experts in Causal Inference.5
In their paper, Pitts et al1 hypothesized that “mean ED occupancy was increasing even faster than the annual increase in ED visits, principally because of longer stays for admitted patients.” This statement contains two hypotheses: 1) that ED occupancy is increasing over time, and 2) the increased occupancy is due longer lengths of stays in the ED for admitted patients, which is related to ED boarding. The authors compared cross-sectional data across multiple years to explore these hypotheses. The data source for the study was the National Hospital Ambulatory Medical Survey (NHAMCS), which is an important and commonly used database for observational studies of US health care delivery. The large sample size and nationwide sampling technique of NHAMCS increase the ability to detect important relationships that may otherwise be undetected within a single hospital or health system. Several hundred papers have been published using NHAMCS data.6 NHAMCS is “designed to collect data on the utilization and provision of ambulatory care services in hospital emergency and outpatient departments”.7 Studies that explore specific questions related to this goal are most likely to be accurate and hence useful. When using this database, care should be taken to design a study that plays to the strengths of NHAMCS and minimizes the potential for bias.3
1B. (NOV) Review the concepts of exposure variable, outcome variable, and confounding
An exposure variable is the independent variable of primary interest. Researchers conduct studies to understand the relationship between exposures and outcomes and to consider whether such relationships may infer causation. In randomized controlled clinical drug trials, the exposure variable is the drug being studied. In observational studies, potentially modifiable risk factors (eg, ED boarding) are usually selected as exposure variables. The outcome variable is the dependent variable, that is, the disease or event of interest. In drug trials, the outcome variable is often a measurement of clinical improvement. In observation health services studies, the outcome variable is frequently an aspect of healthcare delivery that researchers would like to change (eg, reducing medication administration errors).
A confounder is a characteristic that distorts, or biases, the relationship between the exposure and outcome variables. In etiologic studies, confounding should be reduced as much as possible. There are multiple operational definitions of confounding, but a common definition is any characteristic associated with (ie, correlates with) the exposure and outcome that is not on the causal pathway between the exposure and outcome (Figure 1).8
Figure 1.
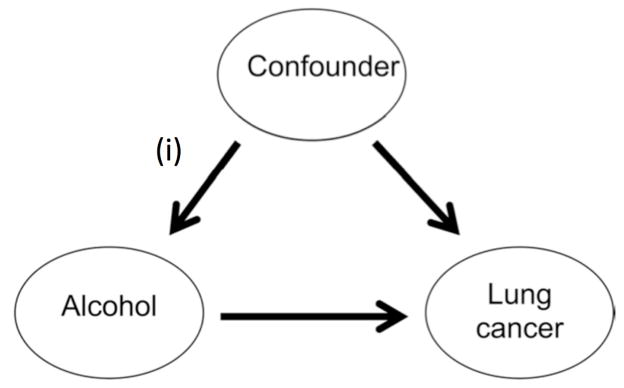
Randomized trials attempt to reduce confounding by eliminating arrow (i) and any relationship between the confounder and exposure; this is true only when the exposure occurs by a random process.9 Randomization balances both measured confounders and unmeasured confounders. This technique will be imperfect if the sample size in an RCT is too small to balance confounders across exposure groups, and it cannot be used with other study designs. Consequently, investigators must attempt to adjust studies to address the confounding to obtain an unbiased estimate of the pure relationship between exposure and outcome. Although there are many complex methods for controlling confounding, all rely on some form of stratification of the confounding variable. In other words, if smoking status is a confounder, analysis of the outcome and exposure can be conducted first in non-smokers and then again in smokers. Since smoking status is constant within each strata, smoking status cannot confound the associations observed within each strata (though other factors still could).
1C: (NOV) What are the primary exposure(s) and outcome for each hypothesis?
-
Hypothesis 1
ED crowding is increasing over time
Exposure: Time (year: 2001–2008)
Outcome: ED occupancy, defined as the total hours of ED bed occupancy by patients. In this study, the authors used ED occupancy as a measure of ED crowding.
-
Hypothesis 2
ED crowding is due to ED boarding.
Primary exposure: ED length of stay for admitted patients (a proxy for ED boarding); comparisons include treatments (blood laboratory testing, advanced imaging, intravenous fluids, medications, procedures); demographic shifts; shifts in severity of illness (ie, triage levels); and other factors (i.e. number of visits during office hours).
Outcome: ED crowding, defined as mean hourly occupancy aggregated across all sampled EDs.
1D: (INT) What confounders are included in the models? Why might variables be included in an analysis even though they do not meet the definition of a confounder?
The authors chose variables to include in their models based on plausibility or “potential implications in ED crowding.” 1 A theoretical confounder of the relationship between year and ED occupancy is disease severity; as medical treatments progress, patients may live longer but also be sicker and require more intense diagnostic and therapeutic interventions in the ED, which may prolong ED stays leading to increased ED occupancy.
Urgency of the visit and behavioral diagnoses were included in the model a priori “because of potential implication in ED crowding.” Although these variables may not meet criteria of a confounder, they may have been included in order to maximize the amount of variance explained by the model (improving the ability to predict the outcome). In this component of the study, rather than seeking the causes of ED crowding, the authors explored broad factors associated with ED crowding. This is analogous to finding that blue eyes are associated with increased risk of melanoma; blue eyes do not cause melanoma, but the finding that blue eyes are associated with an increased risk of melanoma may be helping in identifying causes.
2. In Materials and Methods, the authors note that they used aggregate data to construct the independent (exposure) and dependent (outcome) variables
2A: (NOV) What are aggregate data?
Aggregate data are data summarized for an entire population; in contrast, individual level data apply to a single unit of measure, for example a single patient or a single ED visit.
2B: (INT) Compare and contrast individual level data and aggregate level data
The number of tests ordered on one patient during a single ED visit is an example of individual-level data. The average number of tests ordered for all ED patients from September 2011 is an example of aggregate data.
2C: (ADV) What assumptions are being made when using aggregate data to approximate individual data? Give an example of how using aggregate data rather than individual level data might change how one would interpret study results
Investigators who use aggregate data often assign a population summary such as an average, to every member of the population, an assumption that may be incorrect. For example, imagine two nations. In one, the typical citizen eats 100 pounds of beef per year and the incidence of colon cancers is 40/1,000/year. In the other the average citizen eats 20 pounds of similar beef per year and the incidence of colon cancer is 8/1,000/year. These aggregate data do not prove that eating beer is associated with getting colon cancer. Such a conclusion would invoke the assumption that within each country the more carnivorous individuals have a higher probability of getting colon cancer than their counterparts who eat less meat. There is nothing about these data that implies this and making such an assumption is known as the ecological fallacy because it erroneously assumes that associations observed in populations (more beef = more cancer) can be extended to individuals in those populations.
2D: (ADV) Describe the concept of ecological fallacy. How might it impact the interpretation of data from NHAMCS to reflect the behavior of individual ED patients?
Ecological fallacy, also known as cross-level inference, occurs when aggregate, population-level data are used to make erroneous inferences about individuals.8 For example, consider a study evaluating the association of ED length of stay and medication errors. This hypothetical study included 2 EDs, which each had 4 patients. The ED lengths of stay for each patient are listed in Table 1. ED “A” experienced 2 medication errors, which occurred in patients A.2 and A.3. ED “B” had 1 medication error, occurring in patient B.4. After aggregating the data, ED “A” had a mean length of stay of 65 minutes and 50% of patients had a medication error. ED “B” had a mean length of stay of 45 minutes and 25% of patients experience a medication error. Looking solely at the aggregate data, it appears that longer ED length of stay is associated with increased risk of medication errors. However, analyzing length of stay individually for each patient results in a different conclusion. Across both EDs, 3 individual patients experienced a medication error; the mean length of stay for these 3 patients was 22 minutes. The mean length of stay for the 5 patients who did not experience a medication error was 75 minutes, suggesting longer length of stay was not associated with increased risk of a medication error. ED “A” had a longer mean length of stay and more patients with a medication error; however, the patients with long length of stay were not the same patients as those who experience the medication errors. In this case aggregate level data and individual level data suggest opposite associations between length of stay and medication errors.
| ED A | ED B | ||||
|---|---|---|---|---|---|
| Patient Number | ED Length of Stay (mins) | Medication error? | Patient Number | ED Length of Stay (mins) | Medication error? |
| A.1 | 120 | No | B.1 | 90 | No |
| A.2 | 30 | Yes | B.2 | 15 | No |
| A.3 | 20 | Yes | B.3 | 60 | No |
| A.4 | 90 | No | B.4 | 15 | Yes |
| Mean ED LOS | 65 | Mean ED LOS | 45 | ||
| Percentage of patients with medication errors | 50% | Percentage of patients with medication errors | 25% | ||
In this case, assuming increased ED length of stay is associated with medication errors is an example of ecological fallacy.
3. Consider the following when using an annual, weighted, random sample of ED visits
3A: (INT) How are the data combined across multiple years?
The survey instruments used to collect data for NHAMCS have changed over time. Therefore, care must be taken if multiple years of data are to be combined. In some cases, it may not be appropriate to combine variables over multiple years because the definitions have changed markedly over time. In others, small differences can be accounted for by recoding the variables. For example, documentation of triage acuity changed from “immediate/1–14 minutes/15–60 minutes/>1 hour–2 hours/>2hours–24 hours/no triage/unknown in 2008 to a triage level 1–5/no triage/unknown in 2009.10 Use of this variable over multiple years requires generating a new variable that incorporates all the available categories, for example, recoding “immediate” in 2008 and “level 1” in 2009 to a common variable. This raises the question of whether a visit coded as “immediate” in 2008 was truly the same acuity level as a “level 1” in 2009. In addition, combining data over the years involves adjusting the standard errors to account for the complex survey design. Descriptions of how to do this can be found on the NCHS website.
3B: (INT) Describe 2 potential concerns when combining variables across multiple years
As discussed in the previous question, the definition and statistical coding for variables may have change over time. For example, meaning of the term “admit” has changed over time as use of observation status and observation units has become more common.10 Prior to inclusion of an observation unit in the NHAMCS disposition documentation, were observation status patients scored as “Admit to this hospital” “Other?” Some variables change so drastically over time, they cannot be used consistently across years. In Part 3 of Appendix E1, Pitts et al1 provide details of how variables were recoded and combined across multiple years.
A second problem with combining data across years is that patterns of practice and documentation may have change over time (i.e. a shift from a paper record to an electronic one) so that identical cases in two different years would be recorded in NHAMCS differently.
4. NHAMCS is a publicly available dataset available on the CDC’s website (http://www.cdc.gov/nchs/ahcd/ahcd_questionnaires.htm). McCaig et al4 note that a restricted NHAMCS data set is available for a fee
4A: (NOV) Where is information regarding the restricted NHAMCS dataset located?
The CDC website, http://www.cdc.gov/rdc/, contains information about the restricted dataset, including its recommended use and steps to request access. These steps include undergoing a review process to determine the need for access, the best mode of access, development of a research proposal, submission of the proposal, amendment when needed, travel to Hyattsville, MD, removal of the output, and payment of fees.
4B: (NOV) What additional variables are included in the NHAMCS restricted dataset?
Additional, restricted variables included in the NHAMCS and other National Center for Health Statistics (NCHS) datasets are found at http://www.cdc.gov/rdc/B1DataType/Dt1224a.htm and http://www.cdc.gov/rdc/B1DataType/Dt122.htm, respectively. These include, but are not limited to, the type of emergency service area (2001-current), annual ED visit volume (2001-current), medical school affiliation (yes/no) (2001-current), and geographic variables and census variables. After completing proper processes, other variables (eg, separating boarding from total ED LOS) (ED yearly volume or a unique identifier that can link hospitals across study years) may also be obtained. Additional fees apply to access of the restricted data.
4C: (INT) Discuss 2 hypotheses you might explore using the restricted NHAMCS dataset that may not be feasible using the publicly available dataset
A potential hypothesis is:
Is ED occupancy due to greater growth of length of stay at larger volume EDs ? ED volume is not available in the public use dataset because of the concern that it may allow the hospitals to be identified. Using the restricted dataset, dividing data by ED volume bands (i.e. < 20K, 20–40K, etc.) may be another way to assess what types of ED are experiencing the largest increases in length of stay.
5. The systematic sampling of a national population is the great strength of NHAMCS. The quality of the data abstraction processes has been called to question, however.3 EDs often have different processes for patient flow and admission; some EDs have observation units, some use alternative locations for patient evaluations, and there is variability in when the transfer of care from the ED to the hospital team occurs
Different NHAMCS study sites might not use uniform definitions for these variables. For example, one center might classify a patient with chest pain admitted to an ED observation unit disposition as an admission while another site might classify an identical patient as an ED treat-and-release with a long length of stay
5A: (INT) Discuss how these different classifications might impact investigations of ED management metrics (eg, time to disposition, resource utilization and ED length of stay). How might these differences in NHAMCS variable classification be addressed?
Difference in coding and categorization of disposition from the ED may lead to misclassification bias. If at one site ED discharge is defined as the time of discharge from an observation unit, while at another ED discharge is defined as the time of transfer to the observation unit, then time spent in the ED will appear much longer at the first ED, even if there is no actual difference in ED length of stay between the sites. These differences are likely to lead to biased estimates.
Practice variation among hospitals adds additional complexity. Rather than having a separate chest pain unit, some hospitals perform full chest pain evaluations including stress tests from within the ED; these hospitals have longer ED length of stay, but fewer patients may be hospitalized for chest pain evaluations. Not including measures of overall cost and reduced alternative resource utilization will result in a partial representation of overall healthcare provided. Explicit, detailed definitions of ED arrival, ED discharge, and observation unit may reduce the risk of misclassification.
5B: (INT) Assuming unlimited access to time, money, and resources, what study design(s) might you consider to explore the degree to which ED boarding and intensity of care contribute to ED crowding? Is a randomized, controlled trial a viable option?
Conducting an RCT to answer these questions is not possible. It is neither feasible nor ethical to randomize patients to high intensity of care vs. low intensity of care or to board vs. not board in the ED. However, with unlimited time and resources, it would be possible to perform a multi-center prospective cohort study in which an extensive list of variables associated with intensity of care are recorded; there are many factors that determine the intensity of care and boarding, many of which are unavailable in traditional medical records but would be important to capture in a prospective cohort study (eg, patient’s social situation). ED length of stay and ED crowding should be systematically measured in a detailed, standardized fashion, explicitly defining the meaning the “ED arrival” for the multiple routes of ED arrival (eg, by ambulance, via triage, as transfer from other hospitals, as a rapid response within a hospital) and “ED discharge” (eg, time of the order for ED discharge vs. time of physical departure from the ED for discharged patients; time of bed request vs. time of physical departure from the ED for hospitalized or transferred patients), as well as multiple other important modifying and confounding variables.
5C: (ADV) What other variables would you like to include in the NHAMCS dataset in order to explore the question of whether boarding and intensity of care are associated with or are causal factors in ED crowding?
Multiple, inter-related factors contribute to intensity of care and ED crowding, and it is possible that these factors vary by hospital and patient type. While still maintaining current levels of de-identification, it would be possible to include the following information in the NHAMCS dataset to provide additional information regarding contributing factors for ED crowding and LOS: number of minutes between key steps in ED evaluation, detailed information regarding crowding characteristics at the time of the ED visit, and more detail regarding clinical decisions and imaging types. Whether boarded patients are primarily under the care of the ED versus hospital teams would also be helpful. These data would more accurately reflect disease severity and complexity, as well as the complexity of the overall system within which the ED functions. It is important to note, however, that many of these data points, particularly the time stamps, are not collected in some EDs, and every additional data point included in the NHAMCS data set consumes resources.
Footnotes
Editor’s Note: You are reading the 33rd installment of Annals of Emergency Medicine Journal Club This Journal Club refers to the Pitts et al and McCaig et al articles published in the December 2012 edition. [1, 2] In previous journal clubs, the editors have often reached out to the article’s authors for additional information or data to enhance our critique of the manuscript. This month is the first time that we have one of the article’s authors contributing to the Answers. Dr. Jesse Pines, an author on the Pitts et al paper[1], is an expert on research with large federal databases and has advised the agencies that administer these surveys in the past. Dr. Pines did not participate in the development of any questions related to the article that he co-authored. Dr. Pines has agreed to offer his expertise to this Journal Club. Information about journal club can be found at http://www.annemergmed.com/content/journalclub. Readers should recognize that these are suggested answers. We hope they are accurate; we know that they are not comprehensive. There are many other points that could be made about these questions or about the article in general. Questions are rated “novice,” (
 ) “intermediate,” (
 ) and “advanced (
 ) so that individuals planning a journal club can assign the right question to the right student. The “novice” rating does not imply that a novice should be able to spontaneously answer the question. “Novice” means we expect that someone with little background should be able to do a bit of reading, formulate an answer, and teach the material to others. Intermediate and advanced questions also will likely require some reading and research, and that reading will be sufficiently difficult that some background in clinical epidemiology will be helpful in understanding the reading and concepts. We are interested in receiving feedback about this feature. Please e-mail journalclub@acep.org with your comments.
References
- 1.Pitts, et al. National Trends in Emergency Department Occupancy, 2001 to 2008: Effect of Inpatient Admissions Versus Emergency Department Practice Intensity. Ann Emerg Med. 2012;60:679–686. doi: 10.1016/j.annemergmed.2012.05.014. [DOI] [PubMed] [Google Scholar]
- 2.McCaig, et al. Understanding and Interpreting the National Hospital Ambulatory Medical Care Survey: Key Questions and Answers. Ann Emerg Med. 2012;60:716–721. doi: 10.1016/j.annemergmed.2012.07.010. [DOI] [PubMed] [Google Scholar]
- 3.Cooper RJ. NHAMCS: Does It Hold Up to Scrutiny? Ann Emerg Med. 2012;60:722–725. doi: 10.1016/j.annemergmed.2012.10.013. [DOI] [PubMed] [Google Scholar]
- 4.Hill AB. The Environment and Disease: Association or Causation? Proc R Soc Med. 1965;58:295–300. doi: 10.1177/003591576505800503. [DOI] [PMC free article] [PubMed] [Google Scholar]
- 5.Rothman KJ. Causal Inference. Chestnut Hill: Massachusetts: Epidemiology Resources Inc; 1988. [Google Scholar]
- 6. [Accessed April 29, 2013.];National Ambulatory Medical Care Survey (NAMCS) and National Hospital Ambulatory Medical Care Survey (NHAMCS) List of Publications. http://www.cdc.gov/nchs/data/ahcd/namcs_nhamcs_publication_list.pdf.
- 7. [Accessed June 26, 2013.];National Ambulatory Medical Care Survey (NAMCS) and National Hospital Ambulatory Medical Care Survey (NHAMCS): Ambulatory Health Care Data. http://www.cdc.gov/nchs/ahcd.htm.
- 8.Rothman KJ, Greenland S, Lash TL. Modern Epidemiology. 2. Philadelphia, PA: Lippincott Williams & Wilkins; [Google Scholar]
- 9.Barrett TW, Schriger DL. Acutely Decompensated Heart Failure in a County Emergency Department: A Double-blind Randomized Controlled Comparison of Nesiritide Versus Placebo Treatment: Answers to May 2008 Journal Club Questions. Ann Emerg Med. 2008;52:458–472. doi: 10.1016/j.annemergmed.2008.05.001. [DOI] [PubMed] [Google Scholar]
- 10. [accessed April 26, 2012.];Questionnaires, Datasets, and Related. Documentation. :31. http://www.cdc.gov/nchs/ahcd/ahcd_questionnaires.htm, 2008 NAHMCS, doc08.