

Significance
Morphogenesis is a biological process that generates the physical form and structure of multicellular organisms. Although many of the genes controlling morphogenesis are known, little is understood of the mechanisms that define tissue shape and size. Prominent among these mechanisms is the contact signaling between cells mediated by two cell adhesion-type proteins Dachsous and Fat, which regulate cell division in response to the spatially graded distribution of morphogens, factors governing tissue patterning and growth. Here, based on the known behavior of this signaling pathway, we develop a model of the underlying mechanism that relates signaling to the polarization of Dachsous/Fat heterodimers on cell interfaces. This model explains observed phenotypes, makes quantitative predictions, and provides a framework for further experimental studies.
Keywords: morphogenesis, cell–cell signaling, modelling
Abstract
Dachsous-Fat signaling via the Hippo pathway influences proliferation during Drosophila development, and some of its mammalian homologs are tumor suppressors, highlighting its role as a universal growth regulator. The Fat/Hippo pathway responds to morphogen gradients and influences the in-plane polarization of cells and orientation of divisions, linking growth with tissue patterning. Remarkably, the Fat pathway transduces a growth signal through the polarization of transmembrane complexes that responds to both morphogen level and gradient. Dissection of these complex phenotypes requires a quantitative model that provides a systematic characterization of the pathway. In the absence of detailed knowledge of molecular interactions, we take a phenomenological approach that considers a broad class of simple models, which are sufficiently constrained by observations to enable insight into possible mechanisms. We predict two modes of local/cooperative interactions among Fat–Dachsous complexes, which are necessary for the collective polarization of tissues and enhanced sensitivity to weak gradients. Collective polarization convolves level and gradient of input signals, reproducing known phenotypes while generating falsifiable predictions. Our construction of a simplified signal transduction map allows a generalization of the positional value model and emphasizes the important role intercellular interactions play in growth and patterning of tissues.
A striking aspect of morphogenesis is the coordination of growth and patterning within an organism to achieve correct size, shape, and polarity (1). Classic studies of appendage regeneration (2–4) led to the idea that there must exist cell-autonomous factors, so-called positional values that vary monotonically along tissues, effectively defining a coordinate system for cells (5, 6). The steepness of the spatial gradient of this positional value factor was hypothesized to control cell proliferation, and its direction was hypothesized to guide tissue polarity (4, 6, 7). It was subsequently discovered that spatial patterning during development was guided by secreted proteins, coined “morphogens,” that were found to form graded concentration profiles (reviewed in ref. 8) and shown to control, in a concentration-dependent manner, the expression of key developmental genes. The same morphogens [e.g., Decapentaplegic and Wingless (9, 10)] in the Drosophila wing imaginal disk (Fig. 1A) were shown to be required for cell proliferation and survival. However, diffusing morphogens are not cell-autonomous, and a more fitting candidate for a positional value-type factor may be sought among cell–cell contact signaling systems. Prominent among them is a pathway based on the protocadherins Fat and Dachsous (Ds) that bind to each other in a heterophilic manner. Fat and Ds expression levels are regulated by morphogens and other patterning signals (11, 12), and are therefore also graded across the tissue. Cell contact interactions, such as the juxtacrine signaling via the Fat/Ds system, are an obvious conduit of information, coordinating tissue development and linking the intracellular developmental program, stored in DNA, to the macroscopic level of organ shape and morphology.
Fig. 1.

Schematic of Drosophila wing imaginal disk and core Fat pathway components. (A) Morphogens Decapentaplegic (Dpp; yellow) and Wingless (Wg; green) are secreted at anterior-posterior and dorsal-ventral compartment boundaries, respectively, setting up gradients of Fat pathway components like Ds. (B) Protocadherin Ds binds to Fat, which, in active form, inhibits the membrane localization of Dachs (green). Dachs promotes growth by enhancing accumulation of Yorkie (red) in the nucleus.
A key downstream component of Fat signaling (Fig. 1B) is the unconventional myosin, Dachs. Membrane accumulation of Dachs is inhibited by Fat activity and promotes the nuclear buildup of a growth-inducing transcription factor, Yorkie (11–16). Dachs localization is strongly polarized, defining a direction on the scale of a cell that has been shown to bias the orientation of mitotic spindles (17), and regulates planar cell polarity (PCP), which controls orientation of cellular structures such as hairs and bristles (18, 19). Polarized localization of Dachs is caused by asymmetrical localization of Fat and Ds themselves, which have been observed directly (14, 15, 20). Furthermore, localized perturbations of protocadherin expression levels result in the induction of growth in the vicinity of the expression border (12, 21), effects consistent with local gradients, or discontinuities, driving a growth signal. Transcriptional gradients of Four-jointed (Fj), a Golgi kinase that alters the heterophilic affinity of Fat and Ds (22–25) and influences Fat-PCP and growth phenotypes (16, 18, 20), provide additional directional cues in a tissue. Taken together, these observations indicate that Fat pathway-mediated activation of growth is intrinsically related to the strong polarization of its membrane-associated components in response to the graded inputs of morphogens and other patterning signals. However, Fat-Ds signaling depends not only on the concentration gradients of morphogens and protocadherins but on their absolute levels. fat and ds are both tumor suppressors: Their mutants produce an overgrowth phenotype and a loss of cell polarity, whereas uniform overexpression inhibits growth (12, 16, 21, 26).
It has been proposed that the direction of Fj and Ds gradients instructs PCP by orienting Dachs membrane polarization, whereas the steepness of Fj and Ds gradients controls growth by modulating the amount of Dachs membrane accumulation (12, 13, 16, 21). However, the mechanism of pathway response, which accounts for its observed dependence on both levels and gradients of input signals, has not yet been elucidated. The goal of our work is to provide a framework that would help to interpret the complex phenotypes associated with the pathway and make falsifiable predictions that can help focus and guide further experimental study. To achieve this, we focus on the central element of the Fat-Ds signaling pathway: the formation and polarization of Fat-Ds intercellular heterodimers. Although little is known presently about the mechanistic details of this process, we shall examine several general scenarios, arguing in favor of a mechanism where heterodimers facilitate formation of neighboring heterodimers of like orientation but destabilize the opposite orientation. Together, these interactions make a population of Fat-Ds heterodimers on a membrane readily polarizable. We go on to examine the effects of protocadherin levels and gradients on Fat-Ds heterodimers and, via a simple phenomenological model of Dachs action, relate the state of heterodimers to activation of growth. Although we do not venture into the bigger picture of shape and size determination in which the Fat-Ds system clearly plays a role, we do focus on the way it detects and responds to directional cues, which, in turn, regulates growth and is intrinsically connected with the generation of PCP within the tissue.
Framework for Modeling the Fat Pathway
We begin by defining a rather general model that allows us to explore polarizing heterodimer interactions systematically. As illustrated in Fig. 2A, we define Uij to be the concentration of bound complexes involving Fat in cell i and Ds in cell j (27, 28). Each interface can support complexes of two orientations, wherein the opposite orientation is consistently defined as Uji. Heterodimer formation kinetics can be accounted for as follows:
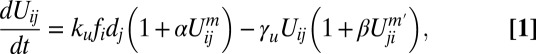 |
where fi and dj are (surface) concentrations of free Fat and Ds in cells i and j, respectively, assembling into heterodimers at a rate ku that, in turn, can disassemble at a rate  . The term
  represents facilitation of assembly by already assembled heterodimers with the same polarization on the same cellular interface. The term
  corresponds to possible inhibitory interaction between oppositely oriented heterodimers via accelerated disassembly of Uij in the presence of Uji. The terms m and m′ define the degree of cooperativity of these interactions. In the absence of any detailed knowledge about actual molecular interactions, our aim here is to construct a phenomenological model that can capture the generic consequences of general and relevant classes of interactions in the simplest possible way (29). The model can be extended to include other realizations of basic “facilitatory” and “inhibitory” interactions between dimers. For example,
  would describe, in addition to facilitation of heterodimer assembly by like heterodimer, the inhibition by the oppositely polarized moiety. However, we find that the most basic consequences of mutual inhibition between oppositely polarized heterodimer moieties are adequately captured by the β term in Eq. 1, making introduction of an additional
  parameter an unnecessary complication. Following the same logic of keeping to a minimal number of parameters, we chose m = 1 and m′ = 1. Effects of Fj can be included within this framework, which we outline in SI Text, section 7.
Fig. 2.
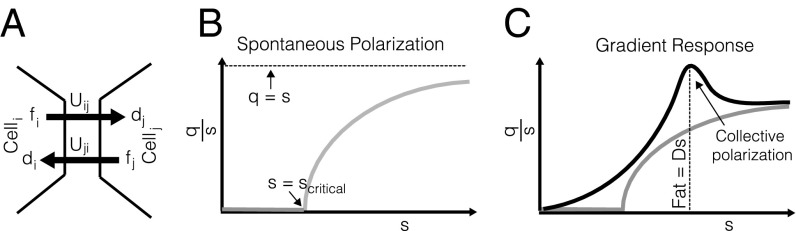
Modeling notation and response of collective polarization to uniform and graded inputs. (A) Fat in cell i (fi) binds to Ds in cell j (dj) to form complexes Uij. (B) Gray curve shows polarization (q/s) as a function of heterodimer levels in the absence of any graded input signals. Spontaneous polarization at critical heterodimer concentration in response to a uniform input, as described by Eq. 6, is shown. (C) Black curve shows polarization (q/s) as a function of heterodimer levels under graded expression. The polarization response to a gradient is level-dependent. Robust polarization enhancement occurs when Fat = Ds.
Heterodimer polarization on interfaces of a given cell are coupled through a stoichiometric constraint on the total cellular pool of Fat,  , and Ds,
  . This reservoir of protocadherins is partitioned into free/unbound and complexed/bound states along cellular interfaces, as described by Eq. 2:
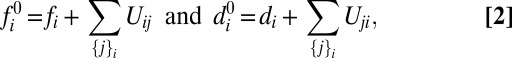 |
where {j}i denotes the set of cells that share an interface with cell i.
Eq. 2 defines a stoichiometric constraint that couples different interfaces of a cell, providing a mechanism by which signals propagate across tissues: In one dimension, a large excess of Fat-Ds heterodimers of one orientation at a cell interface produces a depletion of protocadherin along the other interface, thereby biasing heterodimers with the same orientation. The same effect will propagate into the neighboring cell. We show in SI Text, section 1 that this propagation of polarization on the scale of many cells is effectively diffusive. This behavior is a generic consequence of coupling heterodimer polarization along the different interfaces of a cell. The fact that propagation of Fat-Ds polarization across tissues, and consequent influences on Yorkie activity, is observed in experiments (12, 14, 15, 20, 21) supports the assumed intracellular coupling. Other more complex intracellular mechanisms could couple Fat-Ds heterodimers on different interfaces within a cell, even if Fat and Ds have a short lifetime and are quickly recycled. We return to this elsewhere in this paper (Discussion). Our hypothesis is, however, the simplest within a class of plausible mechanisms that can produce such a coupling. Naturally, a decoupling of interfaces, which would abolish “nonautonomous” propagation of polarization, is contradictory to experimental observations.
It is important to consider the characteristic time scales associated with different aspects of Fat signaling: (i) Fat–Ds complex formation,  ; (ii) protocadherin diffusion with a diffusion constant D across a cell of size a,
  ; (iii) protocadherin transcription,
  ; and (iv) signal transduction through the Fat pathway and growth,
  . The validity of Eqs. 1 and 2 rests on a separation of these time scales. Eq. 1 assumes rapid diffusion,
  , allowing the free population of Fat protocadherins to be available for complex formation. Eq. 2 assumes slow protocadherin transcription,
  , allowing us to define a total concentration of Fat to be partitioned up into free and bound populations. Our analysis of the model will focus on the steady-state concentrations of Fat-Ds heterodimers, on the assumption that the kinetics of heterodimer formation are faster than all other processes.
Growth regulation downstream of Fat-Ds is controlled by Dachs recruitment to cell interfaces. Following genetic and molecular evidence (12, 13), we infer that Dachs localizes to a membrane, unless inhibited by local Fat activity (Fat is active when bound to Ds). Were Dachs free to diffuse along membranes, any asymmetry in active Fat levels would be washed away, in contradiction to observed Dachs polarization; hence, we posit that each junction has a local pool of Dachs that accumulates at a membrane unless inhibited by Fat activity. The junctional pools of Dachs are therefore decoupled from each other, and are thus sensitive to the local depletion in Fat activity due to polarization of Fat-Ds heterodimers.
Denoting the level of localized Dachs in cell i adjacent to cell j with cij, we adopt a simple Hill-function description of its inhibition by the activity of Fat:
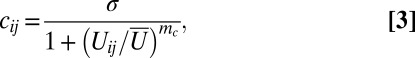 |
Derivation of this relation can be found in SI Text, section 8. The rest of our analysis will consider the linear inhibition of Dachs by active Fat, that is, mc = 1.
Although a Dachs polarity vector, quantifying the cellular asymmetry in Dachs localization to membranes of a cell, is easy to define mathematically, it is less obvious what biochemical mechanism could sense such a vectorial, geometry-dependent aspect of the distribution of Dachs around the cell. Based on this argument and on the fact that the rate of cell division is a scalar cell-level response, its dependence on the upstream interfacial Dachs signal must be symmetrical with regard to all sides of the cell. Hence, denoting the transcriptional readout of Fat-Ds signaling in cell i by yi (the nuclear concentration of Yorkie), its dependence on Dachs activity is, in full generality, given by 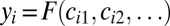 , where the function F is symmetrical with respect to interfaces. We use the simplest possible form of this function, where the sum of membrane-accumulated Dachs in a cell regulates the buildup of Yorkie in the nucleus:
 |
This simple relation between the transcriptional readout and interfacial Dachs levels subsumes all unknown molecular details of the Hippo pathway (16), allowing us to focus on Fat-Ds heterodimer polarization and its signaling consequences.
Symmetry Considerations: Inputs and Responses
The relevant variables defining heterodimer assembly at the interface between cells i and j are the products of free protocadherin concentrations in the adjacent cells. It is convenient to define the mean (over two heterodimer configurations), 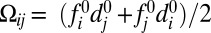 , and the difference,
  . Because the latter vanishes in the case of uniform protocadherin expression, it picks out the graded component of the input. Because differences across a cell–cell interface are small,
  , the challenge is to sense these weakly graded signals.
Our dissection of possible models for gradient sensing will be facilitated by symmetry considerations, which will distinguish between qualitatively different interfacial responses, encoded in the levels of Fat-Ds heterodimers, to graded,  , and nongraded,
  , input signals. First, we must define the interfacial orientational asymmetry of Fat-Ds heterodimers, qij = (Uij − Uji)/2, and its counterpart, sij = (Uij + Uji)/2, half of the total concentration of heterodimers on the ijth interface. Noting sij = sji and qij = −qji makes it apparent that they correspond to the even and odd parities (under i,j interchange) of heterodimer response, which, by their symmetry, naturally pick out, respectively, the mean
  (even) and graded
  (odd) components of input signals. Because input gradients are quite weak and differences in, say, Ds levels between adjacent cells are relatively small, linear kinetics, corresponding to the scenario where
  and
and  in Eq. 1, would produce only a small bias of Fat-Ds heterodimers of one orientation at an interface (
 and
and  ), resulting in
  (explicit solutions can be found in SI Text, section 2.1). Hence, linear kinetics do not readily explain strong sensitivity to graded input signals, which is evident in the observed “all-or-nothing” nature of polarized localization of Dachs. The latter, however, can be accomplished by introducing nonlinearities, corresponding to local interactions, in heterodimer formation kinetics to produce a greater excess of one orientation over the other in response to the same weakly graded input. We now systematically explore these.
Case  and
and  corresponds to a positive feedback in the heterodimer assembly process but involves no local interactions between oppositely oriented heterodimers. In SI Text, section 2.2, we show that in the absence of interaction between heterodimers of opposite orientation, the response to input signals is qualitatively similar to a linear model: A weakly graded input produces a small excess of heterodimers of one orientation over the other.
Case  and
and  corresponds to mutual inhibition of oppositely oriented heterodimers, a type of “cis inhibition.” The limit of very strong cis inhibition,
  , gives rise to the complete depletion of the less abundant heterodimer orientation, leaving only the more abundant one stabilized at the interface:
  ,
,  , and
, and  (details are provided in SI Text, section 2.3). As a result, the only population of heterodimers left at an interface is precisely the imbalance between available Fat and Ds numbers (on the interface), and hence picks out the graded input signal, making an elegant gradient sensor. However, the cis inhibition limit is inconsistent with the all-important role of the Fat pathway as a tumor suppressor: growth inhibition at high uniform expression and overgrowth when removed. In the absence of a graded input (
 ), cis inhibition would ensure the complete suppression of both heterodimer moieties, with the consequent elimination of Fat-mediated inhibition of Dachs localization, resulting in activation of maximum growth. This is inconsistent with observations, falsifying the cis inhibition limit as a plausible model.
Case  and
and  describes cis inhibition and positive feedback acting together. As we shall show below, this makes possible the local spontaneous polarization of heterodimers that can amplify the sensitivity to input gradients. We shall now focus on the analysis of this case, exploring the response to variations in the level and gradient of input signals, comparing results with experiments, and making falsifiable predictions.
Collective Polarization
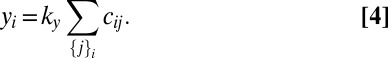
The polarization (q/s) of a population of heterodimers as a function of the normalized total concentration (s/scritical, defined below) at an interface is depicted in Fig. 2B. Once a critical concentration of heterodimers is exceeded, in the absence of any graded input signal ( ), they spontaneously polarize through the positive feedback of the like and cis inhibition of the opposite moiety (numerically confirmed in Fig. S1). Mathematically, the curve in Fig. 2B is described by
  , where
  (subscripts have been dropped owing to a translational invariance in the absence of graded signals). The explicit dependence on the mean input only, Ω, highlights that polarization does not require any graded input: The polarization is spontaneous, meaning that its orientation is decided by chance alone. Of course, the presence of a graded input will pick the orientation and further enhance the polarization, as we shall discuss below.
This mechanism can, for sufficiently large s/scritical, result in the polarization of nearly all heterodimers at an interface (q → s), which, according to our model (Eq. 3), would elicit disinhibition of Dachs and induction of growth in response to a uniform level of protocadherins, provided it is sufficiently high. This is not observed, so we must assume that this level is not reached under realistic conditions, which implies an upper bound on the total concentration of heterodimers,  , that limits the extent of polarization in response to ungraded inputs alone. Alternatively, modifying the interaction terms in Eq. 1 to include saturation could produce the desired suppression of spontaneous polarization at high protocadherin levels.
Fig. 2C illustrates the polarization response as a function of total heterodimer concentration with a fixed graded input. The change in polarization due to a small spatial gradient in the input is controlled by the susceptibility, which is maximal at the critical point corresponding to the onset of spontaneous polarization (29). Associated with this is a divergence in the length scale over which interfacial polarization is coupled, termed the “correlation length.” We explicitly derive the relevant correlation length in SI Text, section 4 and verify it numerically. Although it is tempting to tune cells to this critical point, and to use its gradient amplification and collective polarization features, we recognize that fluctuations are also amplified here (29), resulting in disadvantageous signal-to-noise properties.
There exists a second peak in the correlation length and susceptibility, that being when Fat and Ds are available in similar abundance (numerically confirmed in Fig. S2). Physically, this is a consequence of the stoichiometric constraints imposed through Eq. 2: Depletion of protocadherins from neighboring interfaces due to the polarization of a given interface is maximized when the interacting protocadherins are similar in abundance. As elaborated in SI Text, section 6, the enhanced susceptibility at this special point does not amplify fluctuations owing to a self-averaging due to a separation of time scales. Correspondingly, the collective polarization of interfaces allows cells to measure gradients over scales larger than a cell size, ensuring a more robust detection of weak gradients (details are provided in SI Text).
Response Map for Fat Signal Transduction
Eqs. 1–4 define a map (Fig. 3A) from input signals to growth: The color corresponds to the concentration of the nuclear growth signal, yi, as a function of the graded and uniform inputs into the cell. To project the map onto two dimensions, we vary the level and gradient of Ds across an interface while holding Fat concentrations constant, defining the relevant input signals to be the relative (to Fat) mean Ds level across an interface and the relative (to Fat) difference in Ds across an interface. The color map ranges from 0 (blue), corresponding to inhibition of Dachs on all interfaces, to  (blue to red), corresponding to accumulation of Dachs on all interfaces (in a 1D array of cells, there are two interfaces for every cell).
Fig. 3.

Collective polarization map of Fat pathway signal transduction. (A) Predicted growth response assayed through level of nuclear Yorkie, y, as a function of relative (to Fat) Ds gradient and level. Color map ranges from 0 (blue), inhibition of Dachs on all interfaces, to  (blue to red), accumulation of Dachs on all interfaces (in a 1D array of cells, there are two interfaces for every cell). (B) Generic features of the signal transduction map in A are highlighted.
Although details of this map depend on parameters, it has certain generic features that we highlight in Fig. 2B: (i) Sufficiently low levels of protocadherins fail to inhibit Dachs accumulation to all interfaces,  , permitting overgrowth and a loss of polarity, both of which are consistent with fat and ds KO and RNAi phenotypes; (ii) robust response to a sufficiently graded input signal, which is maximal when protocadherins concentrations are similar; and (iii) high levels of Ds relative to Fat suppress sensitivity to its gradient.
To the extent that this general map readily accommodates observed phenotypes, the collective polarization model is consistent with the present body of knowledge. Below, we shall elaborate upon this general view and zoom into specific predictions that can be used to test the model.
Uniform Fat Pathway Activity
As is manifest in our analysis of the collective polarization model and Fig. 3A, the response depends on both the level and gradient of input signals. This suggests the following inverse question: What protocadherin profiles, for a given set of heterodimer interactions, will lead to spatially uniform Fat pathway activity? This question is of particular interest because growth is known to be relatively uniform during wing development. These profiles are, of course, the iso-signaling contours in a signal transduction map. Fig. 3A’s contours are well approximated by straight lines along which the ratio of the graded to level input signal is constant, which we confirm in a theoretical analysis reproduced in SI Text, section 5. Iso-signaling contours therefore correspond to exponentially distributed protocadherin profiles, parameterized by a single parameter λ (illustrated in Fig. S3A). More physically, along these contours, the increasing gradient of an exponential counters the reduction in sensitivity owing to its increasing abundance, thus maintaining a constant output (details are provided in SI Text, section 5).
A particular value of λ corresponds to a contour in Fig. 3A, along which the ratio of graded to level input signals is approximately preserved,  . Increasingly steep exponentials elicit higher pathway activity levels that generically follow a relation similar to the one shown in Fig. S3B.
Evidence for Collective Polarization Model
Fig. 3 presents a complex map from the gradients and levels of input signals to a growth response. Slicing vertically across the signal transduction map, as indicated by the solid black line in Fig. 4A (Inset) sweeps out a predicted growth curve as a function of relative protocadherin levels at a fixed gradient (Fig. 4A). The curve is nonmonotonic; in particular, it predicts that partial protocadherin KOs ought to elicit undergrowth relative to WT. This nonmonotonicity is, of course, an outcome of heterodimer interactions and the corresponding nonlinearities in Eq. 1.
Fig. 4.

Protocadherin-level effects on the Fat pathway. (A) Vertical slice along the response map (Inset) predicts a nonmonotonic dependence of growth as a function of protocadherin level at a fixed gradient. (B and C) Representative wings and their area statistics for the two partial fat knockdown genotypes. Contrary to the naive expectation that Fat suppression would enhance growth, hypomorphs of increasing severity, ft1/ft1 and ft1/ft8, decrease wing size.
This prediction is not intuitive, given Fat’s role as a tumor suppressor, and to test it, we measured the area of mature fly wings in two partial fat KOs and WT: (i) homozygous hypomorph, fat1/fat1 (fat1 is a nonlethal fat allele); (ii) heterozygous null fat1/fat8 (fat8 is a lethal null allele); and (iii) WT. Fig. 4 B and C verifies our prediction that partial suppression of fat can reduce, rather than enhance, growth and highlights that the response is quantitative: Stronger partial KOs result in less growth. This emphasizes that it is not the level of Fat that alone influences growth; instead, levels of Fat alter asymmetries in Fat–Ds complexes that influence growth.
Nonautonomous Response
Experiments conducted in imaginal disks report a nonautonomous response upon localized perturbations to expression levels of core Fat pathway components. For example, localized overexpression of Ds, in an otherwise WT imaginal disk, leads to growth in a “halo” around the clone (12, 21). Our model reproduces this halo: Growth suppression within the region of overexpression corresponds to the high relative Ds regions in Fig. 2A, and the propagation of signals away from the boundary of overexpression is facilitated by the stoichiometric constraints in Eq. 2. Although our model is not unique in reproducing this phenotype, we go further and predict that the spatial extent of nonautonomy ought to be a function of the relative Fat and Ds levels in the surrounding cells; in particular, it is expected to be maximal when they are equally abundant (Fig. S4). Hence, induction of clones in different regions of imaginal disks (with contrasting relative protocadherin levels) ought to induce nonautonomous responses of varying spatial extent. This prediction can be directly tested by suitably designed experiments.
Discussion
This study puts forward a mechanism that explains the observed Fat/Ds phenotypes and makes directly falsifiable predictions, both with respect to quantitative aspects of signaling and its underlying molecular mechanisms. The purpose, and style, of the modeling used here is to help dissect the manifestly complex Fat signaling system by identifying its key features. Reducing the latter to their simplest, skeletal form is essential, but we remember that in the process, we have set aside a number of interesting and potentially very relevant mechanisms, which we will now comment on.
The collective polarization model analyzed here is highly simplified and glosses over the presently unknown molecular details of the Fat/Hippo pathway. Interactions between heterodimers, Fat-mediated inhibition of Dachs, and transduction through the Hippo pathway can all be extended to provide a more accurate approximation, once more detailed and quantitative measurements can justify such an elaboration of the model; among them would be a correlation of bound Fat and Dachs levels at individual junctions. On the other hand, the proposed model puts forward specific hypotheses concerning cooperation and mutual inhibition between the like and oppositely oriented heterodimers; focusing experimental efforts on elucidating such interactions would generate important mechanistic insight. This is a nontrivial but essential experimental challenge.
As it stands currently, the collective polarization model is purely “feedforward.” It is clear that the actual system is more complex and likely to include multiple feedback mechanisms. One important molecular player omitted in the present model is the kinase, Fj, whose expression level is graded in Drosophila imaginal disks (19) and is known to modulate Fat and Ds affinity for each other (22, 25). Fj may be playing the role of a feedback intermediary that boosts the dynamic range of signaling, because Fj transcription is regulated by Fat and Yorkie activity (30, 31). A very different feedback circuit may involve mechanical stress and deformation arising from growth as hypothesized by Shraiman (32) and Hufnagel et al. (33). Interestingly, a number of recent studies, reviewed in Halder et al. (34), clearly implicate the Hippo pathway as a conduit of mechanotransduction into the regulation of growth.
The planar polarization observed in the Fat/Ds system clearly evokes analogies with the PCP mediated by Frizzled/Strabismus (19, 35). Although the key molecular plays are very different, the collective polarization model that we have proposed has a similar mechanism of action as previous models of PCP (28, 36). In both cases, cooperative and inhibitory interactions make possible spontaneous polarization, which can align across the cell and effectively propagate from a cell to its neighbors. This similarly underscores the universal features of spontaneous polarization phenomena, well known in physics, most prominently in the context of ferromagnetism (29). Contrary to models of PCP, our emphasis here is to provide insight into signal transduction of the level and gradient of input signals, thereby allowing us to constrain further the mechanisms at play. It will be interesting to attempt direct in situ superresolution measurements of heterodimer polarization of both of these systems. Further study will elucidate the extent of similarity in the mechanism of action of these two systems.
The notion of an iso-signaling input profile that we have introduced generalizes the existing cartoon models, such as the positional value model that associates uniform growth signal with a constant gradient (hence, a linear profile) of positional value. We argue that that the growth signal depends on both level and gradient but the result, the approximately exponential shape of iso-signaling profiles, is still quite simple. A direct comparison with experiments would require quantitative assays for relative Fat pathway component expression levels and pathway activity levels.
Our simplification-driven phenomenological approach stands in contrast to high-dimensional models of protein interactions and genetic circuits. Along with exploring the consequences of known molecular and genetic interactions, our approach predicts the existence of molecular mechanisms based on phenomenological considerations. A theoretical approach can therefore become a predictive and exploratory tool that supplements experimental investigations. Our main predictions are as follows: (i) two distinct modes of heterodimer interactions, cis inhibition and positive feedback, are required for the local spontaneous polarization of Fat-Ds heterodimers; in addition, (ii) the ensuing collective polarization of Fat-Ds heterodimers, through a cell-level coupling, allows a gradient response; (iii) there exists a nonmonotonic dependence of the cellular proliferation rate on the protocadherin level; and (iv) there is a dependence of the spatial extent of a nonautonomous response on the relative protocadherin level. Focusing experimental attention on these questions would advance our understanding of Fat pathway signaling.
Supplementary Material
Acknowledgments
We thank Jing Lin for mounting and measuring fly wings. M.M. is supported by a Simons Postdoctoral Fellowship. B.I.S. acknowledges support of National Science Foundation Grant PHY-0844989. Research in the laboratory of K.D.I. is supported by National Institutes of Health Grant 2R01GM078620 and the Howard Hughes Medical Institute.
Footnotes
The authors declare no conflict of interest.
*This Direct Submission article had a prearranged editor.
This article contains supporting information online at www.pnas.org/lookup/suppl/doi:10.1073/pnas.1307459110/-/DCSupplemental.
References
- 1. Thompson D (1992) On growth and form. The complete revised edition (Dover Publications, Mineola, NY)
- 2.Bohn H. Extent and properties of the regeneration field in the larval legs of cockroaches (Leucophaea maderae) III. Origin of the tissues and determination of symmetry properties in the regenerates. J Embryol Exp Morphol. 1974;32(1):81–98. [PubMed] [Google Scholar]
- 3.French V, Bryant PJ, Bryant SV. Pattern regulation in epimorphic fields. Science. 1976;193(4257):969–981. doi: 10.1126/science.948762. [DOI] [PubMed] [Google Scholar]
- 4.Bryant SV, French V, Bryant PJ. Distal regeneration and symmetry. Science. 1981;212(4498):993–1002. doi: 10.1126/science.212.4498.993. [DOI] [PubMed] [Google Scholar]
- 5.Wolpert L. Positional information and the spatial pattern of cellular differentiation. J Theor Biol. 1969;25(1):1–47. doi: 10.1016/s0022-5193(69)80016-0. [DOI] [PubMed] [Google Scholar]
- 6.García-Bellido AC, García-Bellido A. Cell proliferation in the attainment of constant sizes and shapes: The Entelechia model. Int J Dev Biol. 1998;42(3):353–362. [PubMed] [Google Scholar]
- 7.Day SJ, Lawrence PA. Measuring dimensions: The regulation of size and shape. Development. 2000;127(14):2977–2987. doi: 10.1242/dev.127.14.2977. [DOI] [PubMed] [Google Scholar]
- 8.Ashe HL, Briscoe J. The interpretation of morphogen gradients. Development. 2006;133(3):385–394. doi: 10.1242/dev.02238. [DOI] [PubMed] [Google Scholar]
- 9.Zecca M, Basler K, Struhl G. Direct and long-range action of a wingless morphogen gradient. Cell. 1996;87(5):833–844. doi: 10.1016/s0092-8674(00)81991-1. [DOI] [PubMed] [Google Scholar]
- 10.Teleman AA, Cohen SM. Dpp gradient formation in the Drosophila wing imaginal disc. Cell. 2000;103(6):971–980. doi: 10.1016/s0092-8674(00)00199-9. [DOI] [PubMed] [Google Scholar]
- 11.Cho E, Irvine KD. Action of fat, four-jointed, dachsous and dachs in distal-to-proximal wing signaling. Development. 2004;131(18):4489–4500. doi: 10.1242/dev.01315. [DOI] [PubMed] [Google Scholar]
- 12.Rogulja D, Rauskolb C, Irvine KD. Morphogen control of wing growth through the Fat signaling pathway. Dev Cell. 2008;15(2):309–321. doi: 10.1016/j.devcel.2008.06.003. [DOI] [PMC free article] [PubMed] [Google Scholar]
- 13.Mao Y, et al. Dachs: An unconventional myosin that functions downstream of Fat to regulate growth, affinity and gene expression in Drosophila. Development. 2006;133(13):2539–2551. doi: 10.1242/dev.02427. [DOI] [PubMed] [Google Scholar]
- 14.Ambegaonkar AA, Pan G, Mani M, Feng Y, Irvine KD. Propagation of Dachsous-Fat planar cell polarity. Curr Biol. 2012;22(14):1302–1308. doi: 10.1016/j.cub.2012.05.049. [DOI] [PMC free article] [PubMed] [Google Scholar]
- 15.Bosveld F, et al. Mechanical control of morphogenesis by Fat/Dachsous/Four-jointed planar cell polarity pathway. Science. 2012;336(6082):724–727. doi: 10.1126/science.1221071. [DOI] [PubMed] [Google Scholar]
- 16.Reddy BVVG, Irvine KD. The Fat and Warts signaling pathways: New insights into their regulation, mechanism and conservation. Development. 2008;135(17):2827–2838. doi: 10.1242/dev.020974. [DOI] [PubMed] [Google Scholar]
- 17.Mao Y, et al. Planar polarization of the atypical myosin Dachs orients cell divisions in Drosophila. Genes Dev. 2011;25(2):131–136. doi: 10.1101/gad.610511. [DOI] [PMC free article] [PubMed] [Google Scholar]
- 18.Thomas C, Strutt D. The roles of the cadherins Fat and Dachsous in planar polarity specification in Drosophila. Dev Dyn. 2012;241(1):27–39. doi: 10.1002/dvdy.22736. [DOI] [PubMed] [Google Scholar]
- 19.Goodrich LV, Strutt D. Principles of planar polarity in animal development. Development. 2011;138(10):1877–1892. doi: 10.1242/dev.054080. [DOI] [PMC free article] [PubMed] [Google Scholar]
- 20.Brittle A, Thomas C, Strutt D. Planar polarity specification through asymmetric subcellular localization of Fat and Dachsous. Curr Biol. 2012;22(10):907–914. doi: 10.1016/j.cub.2012.03.053. [DOI] [PMC free article] [PubMed] [Google Scholar]
- 21.Willecke M, Hamaratoglu F, Sansores-Garcia L, Tao C, Halder G. Boundaries of Dachsous Cadherin activity modulate the Hippo signaling pathway to induce cell proliferation. Proc Natl Acad Sci USA. 2008;105(39):14897–14902. doi: 10.1073/pnas.0805201105. [DOI] [PMC free article] [PubMed] [Google Scholar]
- 22.Brittle AL, Repiso A, Casal J, Lawrence PA, Strutt D. Four-jointed modulates growth and planar polarity by reducing the affinity of dachsous for fat. Curr Biol. 2010;20(9):803–810. doi: 10.1016/j.cub.2010.03.056. [DOI] [PMC free article] [PubMed] [Google Scholar]
- 23.Ishikawa HO, Takeuchi H, Haltiwanger RS, Irvine KD. Four-jointed is a Golgi kinase that phosphorylates a subset of cadherin domains. Science. 2008;321(5887):401–404. doi: 10.1126/science.1158159. [DOI] [PMC free article] [PubMed] [Google Scholar]
- 24.Strutt H, Mundy J, Hofstra K, Strutt D. Cleavage and secretion is not required for Four-jointed function in Drosophila patterning. Development. 2004;131(4):881–890. doi: 10.1242/dev.00996. [DOI] [PubMed] [Google Scholar]
- 25.Simon MA, Xu AG, Ishikawa HO, Irvine KD. Modulation of fat:dachsous binding by the cadherin domain kinase four-jointed. Curr Biol. 2010;20(9):811–817. doi: 10.1016/j.cub.2010.04.016. [DOI] [PMC free article] [PubMed] [Google Scholar]
- 26.Matakatsu H, Blair SS. Separating the adhesive and signaling functions of the Fat and Dachsous protocadherins. Development. 2006;133(12):2315–2324. doi: 10.1242/dev.02401. [DOI] [PubMed] [Google Scholar]
- 27.Abley K, et al. An intracellular partitioning-based framework for tissue cell polarity in plants and animals. Development. 2013;140(10):2061–2074. doi: 10.1242/dev.062984. [DOI] [PubMed] [Google Scholar]
- 28.Burak Y, Shraiman BI. Order and stochastic dynamics in Drosophila planar cell polarity. PLOS Comput Biol. 2009;5(12):e1000628. doi: 10.1371/journal.pcbi.1000628. [DOI] [PMC free article] [PubMed] [Google Scholar]
- 29. Landau LD, Lifshits EM (1980) Statistical Physics. Landau and Lifshitz Course of Theoretical Physics (Elsevir Ltd, Burlington, MA)3rd Ed, Part 1, Vol 5.
- 30.Cho E, et al. Delineation of a Fat tumor suppressor pathway. Nat Genet. 2006;38(10):1142–1150. doi: 10.1038/ng1887. [DOI] [PubMed] [Google Scholar]
- 31.Yang CH, Axelrod JD, Simon MA. Regulation of Frizzled by fat-like cadherins during planar polarity signaling in the Drosophila compound eye. Cell. 2002;108(5):675–688. doi: 10.1016/s0092-8674(02)00658-x. [DOI] [PubMed] [Google Scholar]
- 32.Shraiman BI. Mechanical feedback as a possible regulator of tissue growth. Proc Natl Acad Sci USA. 2005;102(9):3318–3323. doi: 10.1073/pnas.0404782102. [DOI] [PMC free article] [PubMed] [Google Scholar]
- 33.Hufnagel L, Teleman AA, Rouault H, Cohen SM, Shraiman BI. On the mechanism of wing size determination in fly development. Proc Natl Acad Sci USA. 2007;104(10):3835–3840. doi: 10.1073/pnas.0607134104. [DOI] [PMC free article] [PubMed] [Google Scholar]
- 34.Halder G, Dupont S, Piccolo S. Transduction of mechanical and cytoskeletal cues by YAP and TAZ. Nat Rev Mol Cell Biol. 2012;13(9):591–600. doi: 10.1038/nrm3416. [DOI] [PubMed] [Google Scholar]
- 35.Strutt D, Strutt H. Differential activities of the core planar polarity proteins during Drosophila wing patterning. Dev Biol. 2007;302(1):181–194. doi: 10.1016/j.ydbio.2006.09.026. [DOI] [PMC free article] [PubMed] [Google Scholar]
- 36.Schamberg S, Houston P, Monk NAM, Owen MR. Modelling and analysis of planar cell polarity. Bull Math Biol. 2010;72(3):645–680. doi: 10.1007/s11538-009-9464-0. [DOI] [PubMed] [Google Scholar]
Associated Data
This section collects any data citations, data availability statements, or supplementary materials included in this article.