

Abstract
A microscale mathematical model of blood clot dissolution based on coarse-grained molecular dynamics is presented. In the model, a blood clot is assumed to be an assembly of blood cells interconnected with elastic fibrin bonds, which are cleaved either biochemically (bond degradation) or mechanically (bond overstretching) during flow-mediated thrombolysis. The effect of a thrombolytic agent on biochemical bond degradation was modeled phenomenologically by assuming that the decay rate of an individual bond is a function of the remaining noncleaved bonds in the vicinity of that bond (spatial corrosion) and the relative stretching of the bond (deformational corrosion). The results of simulations indicate that the blood clot dissolution process progresses by a blood-flow-promoted removal of clot fragments, the sizes of which are flow-dependent. These findings are in good agreement with the results of our recent optical-microscopy experimental studies on a model of blood clot dissolution, as well as with clinical observations. The findings of this study may contribute to a better understanding of the clot fragmentation process and may therefore also help in designing new, safer thrombolytic approaches.
Introduction
Thrombolysis (blood clot dissolution) is a widely used clinical approach for the restoration of vessel patency after a partial or complete blood-flow obstruction in massive thrombosis. It is used in the treatment of ischemic cerebrovascular stroke and pulmonary embolism or as a supportive treatment in acute arterial and deep-vein thrombosis (1–4). Thrombolysis is initiated by the administration of a thrombolytic agent (e.g., recombinant tissue plasmin activator (rt-PA)) into the circulatory system. Biochemically, thrombolysis is the proteolysis of a fibrin network, which is triggered by a thrombolytic agent initiating a conversion of the inactive proenzyme plasminogen to the active serine plasmin.
Although thrombolysis is a cascadelike biochemical process with a number of various proteins involved, it is also highly dependent on the hemodynamic conditions at the site of the clot. The authors of several experimental in vitro studies that used various imaging modalities (magnetic resonance imaging, optical photography) and analyzed vessel occlusion during thrombolysis of model blood clots as a function of time concluded that the rate of thrombolysis is positively correlated with the flow rate of streaming blood (5–8). These results motivated the development of various mathematical models of blood clot dissolution (7,9,10). The focus of study of these models was the change in concentrations of the major components of the fibrinolytic system, as well as energy deposition into the clot’s superficial layers by way of streaming blood. In experimental studies, imaging resolution has allowed observation of blood clot dissolution only macroscopically, and theoretical models of thrombolysis have considered blood clot to be a homogeneous continuous medium. As blood clots have a complex microscopic structure, additional analysis of thrombolysis at the microscopic level is needed.
Optical microscopy has been found to be convenient for studying blood clot structure and interactions between different blood clot components. These components (platelets, red blood cells (RBCs), and fibrin meshwork) were discriminated through the use of different fluorescent dyes (11). Platelets play a crucial role in the formation and compactness of the fibrin meshwork in the clot. However, platelets are not the most abundant blood cells in the clot. According to Bajd and co-workers (12), the abundance of RBCs is >90% of the clot volume, whereas the abundance of platelets and fibrin meshwork is <10% of the volume. Recently, optical microscopy was also employed in a study of ultrasound-enhanced thrombolysis with rt-PA-loaded echogenic liposomes (13). Similar studies using optical microscopy were done on a retracted model of whole-blood clots in an artificial perfusion system (14,15). In these studies, blood clot degradation during rt-PA-mediated thrombolysis enabled both size measurement of a nonlysed blood clot as a function of time and analysis of the size of the removed clot fragments. The size may range from single blood cells up to large blood cell clusters of several thousand blood cells when thrombolysis is promoted by fast blood flow. The presence of such fragments poses a possible risk for further embolization in the microvasculature downstream from the site of the clot (16).
The fragmentation of different materials, e.g., plastic micrometer-size spheres impacting a hard wall (17) and the erosion of a nonpassive alloy with microscopic solid particles (18), has been studied successfully by numerical simulation. Both of the studies cited used the discrete-element method, in which the studied material was composed of interacting microscopic spheres. The interaction included different phenomena (stretching, bending, and twisting), and the dynamics of each sphere was calculated using a modified coarse-grained molecular dynamics (MD) approach based on Newton’s laws (19). A similar numerical study using the discrete-element method approach was performed by Miyazaki and colleagues. In that study, thrombosis and thrombolysis processes were simulated by modeling mechanical interactions between blood flow, platelets, vessel wall, and the von Willebrand factor (20). An alternative method to simulation of thrombosis was proposed by Filipovic et al., who used a dissipative particle dynamics approach to simulate thrombosis in a microvessel with a solid narrowing (21). Moreover, advanced numerical algorithms based on mobility matrix formalism were successfully applied to simulate platelet adhesion and platelet aggregation that were regulated by fibrinogen and the von Willebrand factor in a simple uniform shear background flow in a two-dimensional microvessel (22). This formalism enables an elegant consideration of hydrodynamic interactions among particles immersed in a fluid medium. However, it is applicable only in systems with few particles (23) due to its high computational load.
The goal of this study is to introduce a microscale mathematical model of blood clot dissolution that explains the experimental findings of our previous studies on the dissolution of retracted model blood clots (14,15). In those studies, sequential images of whole-blood clot microscale fragmentation in simulated venous hemodynamic conditions were obtained by optical microscopy (Fig. 1). Our hypothesis is that blood clot dissolution is a corrosion-erosion process. In the model, blood clot was composed of randomly distributed, spherically shaped blood cells interconnected by elastic fibrin bonds, and the dynamics of the cells was calculated by coarse-grained MD. The concomitant effect of biochemical corrosion and mechanical erosion was analyzed in terms of noncleaved bonds between blood cells and fragments formed as a function of time.
Figure 1.
A sequence of optical microscopy images of a retracted model blood clot during rt-PA-mediated thrombolysis with faster plasma flow (top-down view) acquired at 15-s intervals. The images show removal of clot fragments from the clot in the observation chamber, which is connected to a perfusion system. The removed fragments traveled with plasma flow (white arrow). Scale bar, 250 μm.
Materials and Methods
Initial blood clot structure
The blood clot was modeled as an assembly of equal spherical blood cells with radius R = 5 μm. The cells were arranged in a three-dimensional wedge-shaped assembly that had the regular structure of a simple cubic Bravais lattice with a side a0 = 20 μm. The assembly was placed in a perfusion chamber with its nondiagonal long faces placed against the bottom and side chamber walls (Fig. 2 A). For each blood cell in the assembly, the nearest-neighbor cells, as well as the next-nearest-neighbor and third-next-nearest-neighbor cells, were determined. A nonsuperficial cell in the assembly had 6 nearest-neighbor bonds, 12 next-nearest-neighbor bonds, and 8 third-next-nearest-neighbor bonds, which yielded 26 bonds/cell. Cells were then randomly displaced from their original positions using displacement vectors of random direction and random amplitude ranging from 0 to 0.2 a0. This was followed by a calculation of the equilibrium lengths of the fibrin fibers interconnecting neighboring blood cells. The initial equilibrium structure of the blood clot with interconnected blood cells is shown in Fig. 2 B, and a detailed view of the model clot interior is depicted in Fig. 2 C. In the figure, red spheres correspond to blood cells, and gray bars correspond to fibrin bonds interconnecting the neighboring cells.
Figure 2.
Modeling of the initial blood clot structure. (A) Blood cells were arranged in a wedge-shaped assembly positioned along one edge of a rectangular flow channel. (B) Blood cells were randomly displaced from their original positions in the cubic grid arrangement and interconnected with elastic fibrin bonds. (C) Each blood cell was connected to neighboring cells by up to 26 bonds.
Equation of motion
The blood cell dynamics was calculated using Newton’s second law, which is a fundamental equation in molecular dynamics simulations (19). For a selected (ith) blood cell within a blood clot, the governing equation of motion is therefore
| (1) |
where m is the mass of the blood cell and is the cell acceleration, which is proportional to the sum of all forces exerted on the cell. In the model, it is assumed that five forces act on each blood cell in the clot: binding force, , as a consequence of fibrin fibers interconnecting neighboring blood cells; net drag force, , proportional to the velocity of the blood cell relative to background plasma velocity; stochastic Brownian force, , induced by random collisions between the blood cells; and the surrounding plasma medium gravitational and buoyant forces.
The binding force was modeled by the Kelvin-Voigt model, which takes into account the viscoelastic properties of fibrin fibers (22):
| (2) |
Here, coefficients kFb and ηFb correspond to effective fibrin-bond stiffness (or a spring constant) and a fibrin viscous coefficient, respectively; and and correspond to the present and the initial difference, respectively, between the positions of neighboring (ith and jth) blood cells.
The net drag force on the spherical blood cell includes the fluid-structure interaction between plasma flow and the blood clot (24):
| (3) |
where ηp is blood plasma viscosity, is the current velocity of the blood cell, and is the background plasma velocity at the site of the blood cell.
The net effect of stochastic Brownian force on each cell, , was approximated by normally distributed vectors with variance . Here, kB = 1.38 × 10⁻²³ J/K is the Boltzmann constant; T = 310 K is an absolute physiological temperature; and is the Dirac delta function (24). The gravitational force was equal to , and the buoyant force was equal to . Here, g = 9.81 m/s2 is the gravitational acceleration; is a unit vector in the z direction; and mp denotes a mass of displaced blood plasma.
In the simulation, initial blood cell positions were defined by the above-described blood clot structure while the initial blood cell velocities were equal to zero. Blood cells next to the chamber walls remained fixed at their initial positions during all simulation steps, whereas the positions of the other blood cells were calculated using the explicit integration method at each simulation time step (18,25). Cell positions were calculated at the next simulation step from their previous positions using the Verlet algorithm (26),
| (4) |
and their corresponding velocities were calculated using the relation . Collisions of blood cells with chamber walls were modeled by a bounce-back reflection (21). In the model, contact steric forces between cells were neglected to reduce the computational load. Hydrodynamic interactions among neighboring blood cells, which resulted from plasma flow alterations due to the presence of blood cells, were also neglected for the same reason. The rotational motion of individual blood cells was neglected as well (18,22).
Hemodynamic conditions
The background plasma flow velocity, , in the observation chamber was calculated by solving the Womersley equation (27), i.e., the Navier-Stokes equation for incompressible Newtonian fluid in the Stokesian approximation
| (5) |
The pressure gradient was assumed to involve the superposition of a constant pressure gradient (with amplitude A1) that maintains a net flow rate through the chamber and a pulsatile sinusoidal pressure gradient that mimics heart pulsations (with amplitude A2 and frequency ), i.e., . Flow in a rectangular flow channel with no-slip boundary conditions can be solved analytically using Eq. 5 and the Fourier series approach (28):
| (6) |
where the contributions associated with a time-independent pressure gradient and that associated with a time-dependent pressure gradient were equal to
and
respectively. Here, 2a and 2b are the channel cross-section width and height; and are the corresponding wave numbers; is a frequency-dependent constant; is the complex unity; and K is the upper summation limit.
Modeling corrosion and erosion processes
A corrosion process promotes blood clot dissolution by inducing the decay of fibrin bonds. In the model, a binary value corresponding to the existence of a bond between two neighboring cells (the ith and jth cells) is assigned the parameter , i.e., 1 for an existing bond and 0 for the removed bond. Therefore, for each cell in the assembly, the integrity of its all-interconnecting bonds can be defined by the cell-bond integrity (CBI) function,
| (7) |
This function controls the rate at which the corrosion process progresses. Namely, it is assumed that a decay rate of a given bond is reciprocal to the CBI of both blood cells interconnected by the bond. This effect of bond decay is referred to as spatial corrosion. In addition to spatial corrosion, bond decay was also assumed to be dependent on relative bond stretching, the effect referred to as deformational corrosion. Spatial and deformational corrosion therefore determine the bond decay rate (BDR):
| (8) |
where is the relative bond stretching, and αi and βi,j correspond to spatial corrosion and deformational corrosion parameters, respectively. The parameters are random numbers uniformly distributed in intervals and . The degree of BD due to both corrosion processes can therefore be obtained as a time integral of the BDR:
| (9) |
A bond is removed either when it is chemically totally degraded (BDi,j = 1) or when it is mechanically overstretched. Fibrin fibers are extremely elastic due to the coiled structure of fibrin macromolecules (29), and they can be elastically stretched up to 300% (30). Therefore, it is assumed in the model that a fibrin bond breaks at εi,j > 2, in which case the bond is no longer present at all subsequent times:
| (10) |
Bond removal due to fibrin-bond overstretching can be considered the cause of an erosion process. The process is induced by the mechanical forces of streaming plasma.
As corrosion and erosion processes act in parallel, their combined effect can be modeled by a modified fibrin-fiber spring constant for corrosion and a modified viscous coefficient for the fibrin fiber:
| (11) |
Blood cells next to the chamber walls were not subjected to the corrosion processes.
Simulation parameters
In the simulation, a wedge-shaped blood clot with dimensions (length, width, and height) was composed of 4950 blood cells of a density equal to RBC density, i.e., ρ = 1110 kg/m3 (31). The fibrin-bond spring constant, , of the Kelvin-Voigt model was calculated from the results of fibrin-fiber stretching experiments (32). In those studies, the Young modulus, E = 1.9 MPa, was measured on fibrin segments of length L = 9.2 μm and radius rFb = 143 nm. Another parameter of the Kelvin-Voigt model is a viscous coefficient of a fibrin fiber, which was assumed to be equal to ηFb = 4.6 × 10⁻³ N/(m/s) (22).
The clot was positioned in a flow chamber with dimensions of width 2a = 5 mm and height 2b = 1 mm. The chamber was perfused with blood plasma of density ρp = 1035 kg/m3 and viscosity ηp = 1.4 × 10⁻³ Pas (33). A pressure-gradient-driven plasma flow was calculated, using Eq. 6, for slow (A1 = 145 Pa/m = 1.1 mmHg/m), faster (A1 = 1450 Pa/m = 11.0 mmHg/m), and extremely fast plasma flow (A1 = 60,000 Pa/m = 4580 mmHg/m). In all three flow regimes, the amplitude of the pulsatile flow component was assumed to be A2 = 0.1A1, with a frequency of flow pulsations of υ = 2 Hz.
The upper summation limit K = 5 and the optimal simulation time step Δt = 3 μs were determined from parallel simulations. The first parameter represents the best compromise between calculation precision and computational load, whereas the second parameter corresponds to the largest simulation time step at which the clot assembly was numerically stable. A total of 90,000 simulation time steps were performed for each plasma-flow regime, which corresponded to 270 ms of real-time clot dissolution.
The numerical simulations were implemented in the C-programming code, which was compiled and run on a desktop PC (2.0 GHz, 3 GB RAM). On average, each simulation took 3 h.
Visualization and quantification of the simulation results
Blood cell positions, along with the corresponding noncleaved bonds, were dynamically sampled every 300 simulation time steps, stored, and later rendered using the Persistence of Vision Raytracer (POV-Ray) program (Victoria, Australia). Visualization of the corrosion process was based on an average bond decay defined by ; i.e., cells were colored according to the value of the average bond decay: 0–0.33 (red), 0.33–0.66 (orange), 0.66–0.99 (yellow), and 0.99–1.00 (blue). Blood clot dissolution was quantified in terms of the total bond integrity (TBI), which corresponds to the proportion of existing bonds:
| (12) |
Bond degradation that is mainly a consequence of biochemical clot degradation and mechanical overstretching is accompanied by removal of single blood cells, as well larger cell clusters, from the clot surface. In our simulation, the remaining clot and the removed clot fragments were calculated by a recursion-based subroutine every 300 simulation time steps. In the subroutine, the blood cells of the removed fragments had no bonds to the remaining clot ; however, they could still have bonds between cells within the fragment . Clot-dissolution (CD) curves were calculated as proportions of blood cells in the remaining clot assembly, and the removed clot fragments were sampled and sorted into clot-fragment size (CFS) distributions. In addition, for each time interval, the maximum clot fragment size (CFS-max) was calculated. For each set of simulation parameters, three simulation runs were performed, each with a different random generator seed, and the results of these runs were combined. Thus, the blood cell count for the CD dynamics was three times larger than the number of cells in the individual clot assembly.
Results
TBI and CD curves
The effect of spatial corrosion and deformational corrosion on the progression of blood clot dissolution is presented in Fig. 3 as a series of simulation results showing TBI curves (open symbols) and CD curves (solid symbols). The simulations were performed with either slow (Fig. 3, A and C) or faster (Fig. 3, B and D) plasma flow and with a prevalence of either spatial corrosion (αmax ≠ 0 s−1 and βmax = 0 s−1; Fig. 3, A and B) or deformational corrosion (αmax = 0 s−1 and βmax ≠ 0 s−1; Fig. 3, C and D). TBI and CD curves are initially flat (BD was initially close to zero), whereas in the subsequent simulation time steps, the curves decreased with increased dissolution time. By the end of dissolution, the curves gradually reach plateaus due to slowed dissolution of the remaining blood clot.
Figure 3.
TBI curves (open symbols) and the corresponding CD curves (solid symbols) with slow (A and C) and faster (B and D) plasma flow and with either spatial corrosion only (A and B) or deformational corrosion only (C and D). Each leap in CD curves is associated with removal of one or more larger fragments from the clot. Dashed arrows indicate an increasing trend of corrosion parameters.
In the simulations of Fig. 3, the slopes of TBI and CD curves decrease with increased corrosion parameters and . TBI curves are below the corresponding CD curves, i.e., the removal of blood cells is conditioned by a sufficient degradation of the bonds connecting the cells. Assuming a Boltzmann sigmoidal shape of these curves, , the largest decrease (i.e., at t = t0) in the TBI curve occurred on average 2.1 ± 0.1 times faster than the largest decrease of the corresponding CD curve. From the results, it can be seen that plasma flow velocity has a negligible effect on dissolution curves in simulations with spatial corrosion only (Fig. 3, A and B). However, in simulations with deformational corrosion only, the effect of flow on dissolution curves is considerable (Fig. 3, C and D). In Fig. 3, A, B, and D, some CD curves are discontinuous, i.e., curves have several leaps. Each leap is associated with a removal of at least one larger clot fragment.
Fig. 4 depicts the combined effect of spatial and deformational corrosion (αmax = 10 s−1 and βmax = 1000 s−1) on the progression of blood clot dissolution for slow and faster plasma flow. The progression is presented in terms of TBI, CD, and normalized (to the total number of cells in the assembly) CFS-max curves (Fig. 4 A), and by CFS distributions at four selected simulation time steps (Fig. 4 B). As can be seen from the graphs in Fig. 4 A, the TBI and CD curves decrease with increased simulation time in both flow regimes. The TBI was initially unimpaired, for ∼0.05 s with both flow regimes, and then started to decrease. As expected, the corresponding CD curves follow the profiles of the TBI curves, but with a time delay. CD curves were initially equal to unity, meaning that no fragments were removed from the clot assembly, and they started decreasing at 0.15 s and 0.10 s, respectively, with slow and faster plasma flow. The TBI slope, CD slope, and normalized CFS-max peak values, as well as the corresponding final TBI and CD values, are presented in Table 1. As can be seen from the graphs of CFS distributions in Fig. 4 B, which depict size distributions of all the fragments removed until the specified observation time point, the sizes of the removed fragments and their count change with time as well as with the hemodynamic conditions of streaming plasma. In the simulations with faster plasma flow, both the single-cell fragment count and the CFS-max value were considerably larger. The removed single-cell fragments still dominated, and their count increased; CFS-max also changed with dissolution time, the peak coinciding with the most intense CD-curve decrease. The count of single-cell fragments and CFS-max values for slow and faster flow at four different dissolution times corresponding to CFS distributions in Fig. 4 B are given in Table 2.
Figure 4.
(A) TBI curves (open symbols), CD curves (solid symbols), and normalized CFS-max curves (symbols connected by lines) as a function of time for slow flow (squares) and faster flow (diamonds), with both corrosion parameters nonzero. (B) The corresponding CFS distributions at selected simulation times: t = 0.10, 0.15, 0.20, 0.25 s.
Table 1.
Clot dissolution rates and final proportions of a dissolved clot with slow vs. faster flow
| Slow flow | Faster flow | ||
|---|---|---|---|
| Peak values | dTBI/dt (s−1) | −9.7 | −18 |
| dCD/dt (s−1) | −23 | −108 | |
| normalized CFS-max (1) | 0.04 | 0.25 | |
| Final values | TBI (1) | 0.13 | 0.10 |
| CD (1) | 0.53 | 0.34 |
Peak values of TBI and CD slopes and of normalized CFS-max curves for slow and faster flow, as well as the corresponding final values of TBI and CD curves. The values correspond to simulation results presented in Fig. 4A.
Table 2.
Counts of single-cell fragments and CFS-max at various dissolution times with slow versus faster flow
| Time (s) | Slow flow |
Faster flow |
||
|---|---|---|---|---|
| Single-cell fragments | CFS-max | Single-cell fragments | CFS-max | |
| 0.10 | 13 | 3 | 114 | 5 |
| 0.15 | 197 | 5 | 2269 | 660 |
| 0.20 | 1180 | 20 | 4690 | 114 |
| 0.25 | 3230 | 50 | 6498 | 94 |
Count of single-cell fragments and the corresponding CFS-max for slow and faster flow at four different dissolution times. The values correspond to CFS distributions in Fig. 4B.
Clot-dissolution snapshots
Fig. 5 depicts snapshots of a partially dissolved blood clot assembly along with the removed clot fragments at different times of dissolution (matching those in Fig. 4 B at t = 0.1 and 0.2 s) with slow and faster plasma flow. The dissolution process was simulated with nonzero spatial and deformational corrosion parameters (αmax = 10 s−1, βmax = 1000 s−1). From the simulated snapshots it can be seen that with slow plasma flow no blood cells were removed from the clot at t = 0.1 s, whereas the number of fragments removed increased at t = 0.2 s; the sizes of the removed fragments ranged from single-cell fragments to fragments composed of a few interconnected blood cells and finally to larger fragments. With faster plasma flow, smaller fragments were removed from the clot by t = 0.1 s, whereas by t = 0.2 s the fragment sizes were on average considerably larger; however, some of the removed fragments traveled out of the field of view and thus are not shown. All larger fragments were composed of two or more blood cells still interconnected by partially dissolved fibrin bonds. This can also be seen well from the colors of the blood cells in the fragments. Blue-colored cells were removed after the completed corrosion process. Therefore, those cells always appear as single-cell fragments and cannot appear in larger fragments. Single-cell fragments may also have been of a color other than blue, indicating an involvement of the erosion process in their formation, i.e., the cells were removed after mechanical bond breakage. Larger fragments are always composed of cells with active bonds to other cells in the fragment. Therefore, according to color coding of average bond decay, defined previously, their color is other than blue. It can also be seen that the remaining clot is considerably smaller in the simulation with faster plasma flow than in the simulation with slow plasma flow. In neither flow regime did dissolution progress beyond the first layer of blood cells (red-colored cells), which remained attached to the chamber wall according to the conditions of the simulation.
Figure 5.
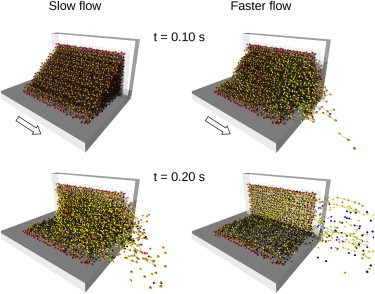
Snapshots of the three-dimensional blood clot assembly during its dissolution with slow and faster plasma flow at two selected simulation times (t = 0.1 and 0.2 s). The total number of removed clot fragments, as well as their average size, increased with increased plasma flow velocities. Individual bonds in partially dissolved clot fragments can be seen clearly in simulations with both plasma flow regimes. Some of the removed clot fragments are not visible, as they traveled out of the selected field of view.
Snapshots of the cell assembly at the first few moments after exposure to the strong mechanical forces of streaming plasma are shown in Fig. 6. In the simulation, the corrosion process was excluded (αmax = 0 s−1 and βmax = 0 s−1), although the forces of streaming plasma to the clot were above the threshold for mechanical stability of the clot. In the simulation, the flow corresponded to a pressure gradient of A1 = 60,000 Pa/m, which is ∼40 times higher than in simulations with faster flow. Blood cells next to the chamber wall remained attached to the wall at all simulation times. The central part of the clot started dislocating in the flow direction, which soon resulted in local bond breakage from mechanical overstretching (t = 0.3 ms). The dislocation became excessively large to the point that the remaining bonds between cells attached to the wall and the central part of the clot could no longer resist the forces of flow (t = 0.9 ms). The central part of the clot ultimately separated from the clot in the form of an extremely large clot fragment. All cells in the assembly are red-colored at all simulation times due to the absence of a corrosion process.
Figure 6.
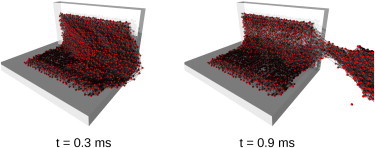
Snapshots of the three-dimensional blood clot assembly, which was exposed to the erosion process only, at two selected simulation times (t = 0.3, 0.9 ms). Clot corrosion was inhibited (αmax = 0 s−1 and βmax = 0 s−1), while the erosion process was induced by plasma flow of an extreme velocity, which was above the threshold of clot mechanical stability. The conditions enabled removal of a giant clot fragment (t = 0.9 ms).
Discussion
In this study, we proposed a microscale mathematical model to explain the effect of hemodynamic conditions on clot fragmentation. The effect was observed experimentally in our previous studies, in which the fragmentation of model blood clots during rt-PA-mediated thrombolysis was studied by optical microscopy (14,15). In the mathematical model, a blood clot was assumed to be a dynamically changing assembly of blood cells interconnected with elastic fibrin bonds that were exposed to biochemical degradation (corrosion) as well as to mechanical forces of streaming plasma (erosion). The principal findings of this study are that 1), blood clot dissolution is promoted in environments of high-velocity plasma flow; 2), blood clot dissolution progresses by the removal of clot fragments that are still interconnected by a partially dissolved fibrin meshwork; and 3), the sizes of the removed fragments are dependent on the velocity of plasma flow.
In the model, thrombolytic activity was governed by two corrosion parameters, spatial and deformational . Simulated TBI curves and the corresponding CD curves shown in Fig. 3 demonstrate separately the effect of each corrosion parameter on CD. With both corrosion parameters, the rates of decrease of TBI and CD curves increase with each of the parameters. However, for both curves, the effect of flow on the rate of decrease was noticeable only with deformational corrosion, whereas practically no effect on the rate decrease was observed with spatial corrosion only. This result is in agreement with Eq. 8, in which the first term, corresponding to spatial corrosion, is not dependent on plasma flow velocity, whereas the second term, corresponding to deformational corrosion, is indirectly dependent on plasma flow velocity (via the position difference in ). In most simulations (Fig. 3, A–C), the conditions were such that the fragments removed from the clot were mostly small; therefore, the CD curves are mostly continuous, with only a few smaller leaps (Fig. 3, A and B, solid triangles and solid circles). However, in the simulation in Fig. 3 D, the conditions were favorable for the removal of larger fragments, resulting in discontinuous CD curves. The simultaneous action of both corrosion parameters on blood clot dissolution promoted the process, resulting in a faster decrease of the TBI and CD curves (Fig. 4 A, Table 1) compared to the decrease with nonzero spatial corrosion only (Fig. 3, A and B) or that with nonzero deformational corrosion only (Fig. 3, C and D). This can be explained by a more efficient fibrin-bond cleavage with both corrosion parameters at nonzero.
The CFS distribution with faster plasma flow at t = 0.15 s in Fig. 4 B has many fragments with sizes of several tens to several hundred blood cells, as well as one larger fragment with a size of ∼1000 blood cells. Interestingly, later distributions do not have fragments of that size, as they disintegrated into smaller fragments. Evidence of fragment disintegration after removal from the clot is clinically relevant, as the fragments may pose a risk for embolization in microvessels. In an extreme situation, the removal of a giant fragment consisting of nearly the entire blood clot could induce a life-threatening event, such as pulmonary embolism (16). It cannot be expected that such fragments will be disintegrated solely by mechanical forces of streaming blood. As can be seen in the simulation in Fig. 5, blood clots are mechanically stable structures and can be disintegrated into smaller fragments without the presence of a thrombolytic agent (i.e., without corrosion) only at extreme hemodynamic conditions that can be established in vivo neither physiologically nor pathologically, but only artificially, e.g., during catheter-guided embolectomy (34). The level of mechanical force needed for clot disintegration can be significantly reduced by the application of a thrombolytic agent that induces clot corrosion and also promotes its erosion. Thus, with the use of the thrombolytic agent, clot disintegration under normal hemodynamic conditions becomes feasible.
In the model, the shape of the initial blood clot assembly and the selection of the parameters of hemodynamic conditions were motivated by the experimental setup of our previous studies (14,15), in which quantification of the results was also performed by CD curves and CFS distributions obtained from a measured nonlysed blood clot area (Fig. 1). In contrast to simulations of primary platelet thrombus formation using mobility matrix formalism, which is two-dimensional and includes a relatively limited number of blood cells (22), this study utilized an initial blood clot assembly modeled as a three-dimensional structure with a larger number of blood cells. Moreover, the corrosion parameters between different bonds were randomly distributed to break the equivalency between the bonds, thus increasing clot heterogeneity (12).
In the model, RBCs were assumed to be spherical, whereas their real shape is discoid. Therefore, it was not possible to retain both the mass and dimension of the RBC. It was decided to overestimate RBC mass (from 1 × 10⁻¹³ kg to 5.8 × 10⁻¹³ kg) rather than to underestimate its dimension (RBC radius), as this was more preferable in view of computational stability. Stability is conditioned by a short enough simulation time step, which should not exceed the characteristic timescale of the system (35). For the model, the timescale was estimated by the oscillation period of a blood cell pair interconnected by a fibrin fiber bond, which is of the order of several microseconds. Based on parallel simulations at various simulation time steps, the simulation time step of 3 μs was found to be the best compromise between numerical stability and computational speed. As many simulations were needed for the study (results of the study comprise 51 simulation runs), it was decided to keep the computational time/simulation below 4 h, which corresponded to 90,000 simulation steps, or a simulation time of 0.27 s on a standard PC. The size of the remaining clot and of the removed fragments was calculated only after every 300 simulation steps, thus reducing computational time while retaining the precision of the simulated results.
Our previous experiments using optical microcopy (see Fig. 1) (14,15) were done on artificial blood clots with cross-section areas of 1 mm2 that were dissolving for 30 min, whereas in the simulation, the clot cross-section area was 0.06 mm2 and the simulation time was 0.27 s. Therefore, the dissolution rate in the simulation was two orders of magnitude faster than that in the experiments. This is mainly due to the large corrosion coefficients α and β. If the coefficients were two orders of magnitude smaller, the expected dissolution rate in the simulation would approach that of the experiment. The corrosion coefficients were set high to reduce the number of simulation steps needed (thus saving computational time) to obtain reasonable clot volume reduction within the simulation time. Parallel simulations that were done with corrosion coefficients five times lower (each thus taking 15 h) resulted in a qualitatively equal progression of CD, with, however, a five-times-longer simulation time. Therefore, it may be expected that any further reduction of the corrosion coefficients, even a significant reduction, e.g., a reduction by a factor of 1000, would result in a similar progression of CD in a proportionally longer simulation time.
Another limitation of our study was the phenomenological modeling of biochemical bond decay. Specifically, fibrin bonds decayed with a BDR reciprocal to the local CBI. In addition, the decay rate was also proportional to relative bond stretching. Using this approach, calculation of the migration dynamics of individual thrombolytic-agent molecules and their interaction with fibrin bonds was avoided. Instead, an average effect of the thrombolytic agent was considered, thus significantly reducing computational load. However, in contrast to the study of nonpassive alloy erosion-corrosion wear loss (25), in our study a complete determination of the parameters determining BDR, i.e., corrosion parameters α and β, was not possible due to lack of experimental data. The values of the corrosion parameters were based on parallel simulations in which CD and fragmentation were obtained within the simulation time. Computational load was reduced further by neglecting steric interaction between blood cells and by simplifying the fluid-structure interaction to the drag force proportional to velocity differences between blood cells and fluid medium. In addition, we did not consider the effect of blood clot and removed fragments on the plasma-flow-velocity profile, i.e., the profile was calculated for the situation where there is no blood clot or fragments in the flow channel. One of the model limitations is also an exclusion of the hydrodynamic interaction, which may influence clot fragmentation, especially at higher plasma flow velocities. It may be expected that the hydrodynamic interaction would result in somewhat larger fragments (36). In addition, an inclusion of the physiological RBC mass, and especially RBC discoid shape, in the model would enable a better estimation of RBC motion, as well as of RBC-flow interactions. Since the calculation of hydrodynamic interactions in a system with a large number of particles is computationally very demanding (22,37,38), and because of the low power of the available computer, hydrodynamic interactions were not included in the model. Such interactions could be included in the model after a significant reduction of the clot assembly size. Another limitation of the study is the assumption of a Newtonian fluid medium, since blood is nonNewtonian, as it includes significant shear-thinning effects. The model for clot fragmentation presented here could be further improved by including more advanced fluid-structure interaction (22,23,39) combined with biochemical reactions governing dissolution kinetics (40). In addition, the use of parallel computing could help further reduce computational time, thus enabling simulation of problems with a higher complexity (41).
Conclusion
In this study, a microscale mathematical model of blood clot dissolution was developed to elucidate the mechanism of clot fragmentation in flow-mediated thrombolysis. The results of the simulations indicate that blood clot dissolution is faster with faster plasma flow, and that blood clot disintegration occurs in the form of clot fragments of various flow-dependent sizes. These findings are qualitatively in good agreement with the experimental results of our previous studies (14,15), supporting the hypothesis of this study, that blood clot dissolution is a corrosion-erosion process in which the biochemical reactions of a fibrinolytic system (corrosion) and the mechanical forces of streaming plasma (erosion) act in parallel. The findings of this study may contribute to a better understanding of the process of clot fragmentation and may also therefore be of help in the designing of new safer thrombolytic approaches.
Acknowledgments
The authors thank Prof. Aleš Blinc and Dr. Jernej Vidmar for fruitful discussions.
This study was supported by the Slovenian Research Agency (Contract No. J3-0610).
References
- 1.Sekoranja L., Loulidi J., Sztajzel R.F. Intravenous versus combined (intravenous and intra-arterial) thrombolysis in acute ischemic stroke: a transcranial color-coded duplex sonography-guided pilot study. Stroke. 2006;37:1805–1809. doi: 10.1161/01.STR.0000227358.37094.46. [DOI] [PubMed] [Google Scholar]
- 2.van Es J., Douma R.A., Buller H.R. Acute pulmonary embolism. Part 2: treatment. Nat. Rev. Cardiol. 2010;7:613–622. doi: 10.1038/nrcardio.2010.141. [DOI] [PubMed] [Google Scholar]
- 3.Ouriel K., Veith F.J., Sasahara A.A., Thrombolysis or Peripheral Arterial Surgery (TOPAS) Investigators A comparison of recombinant urokinase with vascular surgery as initial treatment for acute arterial occlusion of the legs. N. Engl. J. Med. 1998;338:1105–1111. doi: 10.1056/NEJM199804163381603. [DOI] [PubMed] [Google Scholar]
- 4.Comerota A.J. Thrombolysis for deep venous thrombosis. J. Vasc. Surg. 2012;55:607–611. doi: 10.1016/j.jvs.2011.06.005. [DOI] [PubMed] [Google Scholar]
- 5.Blinc A., Kennedy S.D., Francis C.W. Flow through clots determines the rate and pattern of fibrinolysis. Thromb. Haemost. 1994;71:230–235. [PubMed] [Google Scholar]
- 6.Sakharov D.V., Rijken D.C. The effect of flow on lysis of plasma clots in a plasma environment. Thromb. Haemost. 2000;83:469–474. [PubMed] [Google Scholar]
- 7.Sersa I., Vidmar J., Blinc A. Modelling the effect of laminar axially directed blood flow on the dissolution of non-occlusive blood clots. Phys. Med. Biol. 2007;52:2969–2985. doi: 10.1088/0031-9155/52/11/003. [DOI] [PubMed] [Google Scholar]
- 8.Tratar G., Blinc A., Sersa I. Turbulent axially directed flow of plasma containing rt-PA promotes thrombolysis of non-occlusive whole blood clots in vitro. Thromb. Haemost. 2004;91:487–496. doi: 10.1160/TH03-07-0447. [DOI] [PubMed] [Google Scholar]
- 9.Pleydell C.P., David T., Berridge D.C. A mathematical model of post-canalization thrombolysis. Phys. Med. Biol. 2002;47:209–224. doi: 10.1088/0031-9155/47/2/303. [DOI] [PubMed] [Google Scholar]
- 10.Diamond S.L. Engineering design of optimal strategies for blood clot dissolution. Annu. Rev. Biomed. Eng. 1999;1:427–462. doi: 10.1146/annurev.bioeng.1.1.427. [DOI] [PubMed] [Google Scholar]
- 11.Dale G.L., Remenyi G., Friese P. Quantitation of microparticles released from coated-platelets. J. Thromb. Haemost. 2005;3:2081–2088. doi: 10.1111/j.1538-7836.2005.01528.x. [DOI] [PubMed] [Google Scholar]
- 12.Bajd F., Vidmar J., Serša I. Impact of altered venous hemodynamic conditions on the formation of platelet layers in thromboemboli. Thromb. Res. 2012;129:158–163. doi: 10.1016/j.thromres.2011.09.007. [DOI] [PubMed] [Google Scholar]
- 13.Shaw G.J., Meunier J.M., Holland C.K. Ultrasound-enhanced thrombolysis with tPA-loaded echogenic liposomes. Thromb. Res. 2009;124:306–310. doi: 10.1016/j.thromres.2009.01.008. [DOI] [PMC free article] [PubMed] [Google Scholar]
- 14.Bajd F., Vidmar J., Sersa I. Microscopic clot fragment evidence of biochemo-mechanical degradation effects in thrombolysis. Thromb. Res. 2010;126:137–143. doi: 10.1016/j.thromres.2010.04.012. [DOI] [PubMed] [Google Scholar]
- 15.Bajd F., Sersa I. A concept of thrombolysis as a corrosion-erosion process verified by optical microscopy. Microcirculation. 2012;19:632–641. doi: 10.1111/j.1549-8719.2012.00198.x. [DOI] [PubMed] [Google Scholar]
- 16.Herrera S., Comerota A.J. Embolization during treatment of deep venous thrombosis: incidence, importance, and prevention. Tech. Vasc. Interv. Radiol. 2011;14:58–64. doi: 10.1053/j.tvir.2011.01.002. [DOI] [PubMed] [Google Scholar]
- 17.Timár G., Blömer J., Herrmann H.J. New universality class for the fragmentation of plastic materials. Phys. Rev. Lett. 2010;104:095502. doi: 10.1103/PhysRevLett.104.095502. [DOI] [PubMed] [Google Scholar]
- 18.Chen Q., Li D.Y. Computer simulation of solid particle erosion. Wear. 2003;254:203–210. [Google Scholar]
- 19.Rapaport D.C. Cambridge University Press; Cambridge, United Kingdom: 1995. The Art of Molecular Dynamics Simulation. [Google Scholar]
- 20.Miyazaki H., Yamaguchi T. Formation and destruction of primary thrombi under the influence of blood flow and von Willebrand factor analyzed by a discrete element method. Biorheology. 2003;40:265–272. [PubMed] [Google Scholar]
- 21.Filipovic N., Kojic M., Tsuda A. Modelling thrombosis using dissipative particle dynamics method. Philos. Transact. A Math. Phys. Eng. Sci. 2008;366:3265–3279. doi: 10.1098/rsta.2008.0097. [DOI] [PMC free article] [PubMed] [Google Scholar]
- 22.Mori D., Yano K., Yamaguchi T. Simulation of platelet adhesion and aggregation regulated by fibrinogen and von Willebrand factor. Thromb. Haemost. 2008;99:108–115. doi: 10.1160/TH07-08-0490. [DOI] [PubMed] [Google Scholar]
- 23.Vilfan M., Potocnik A., Babic D. Self-assembled artificial cilia. Proc. Natl. Acad. Sci. USA. 2010;107:1844–1847. doi: 10.1073/pnas.0906819106. [DOI] [PMC free article] [PubMed] [Google Scholar]
- 24.Succi S. Oxford University Press; Oxford, United Kingdom: 2001. The Lattice Boltzmann Equation for Fluid Dynamics and Beyond. [Google Scholar]
- 25.Chen Q., Li D.Y. Computer simulation of erosion-corrosion of a non-passive alloy using a micro-scale dynamic model. Mater. Sci. Eng. A Struct. Mater. 2004;369:284–293. [Google Scholar]
- 26.Toxvaerd S., Heilmann O.J., Dyre J.C. Energy conservation in molecular dynamics simulations of classical systems. J. Chem. Phys. 2012;136:224106. doi: 10.1063/1.4726728. [DOI] [PubMed] [Google Scholar]
- 27.Wilmer W.N., O'Rourke M.F. Hodder Arnold; London: 2005. McDonald's Blood Flow in Arteries. [Google Scholar]
- 28.Haji-Sheikh A. Fully developed heat transfer to fluid flow in rectangular passages filled with porous materials. J. Heat Transfer. 2006;128:550–556. [Google Scholar]
- 29.Lim B.B.C., Lee E.H., Schulten K. Molecular basis of fibrin clot elasticity. Structure. 2008;16:449–459. doi: 10.1016/j.str.2007.12.019. [DOI] [PubMed] [Google Scholar]
- 30.Liu W., Jawerth L.M., Guthold M. Fibrin fibers have extraordinary extensibility and elasticity. Science. 2006;313:634. doi: 10.1126/science.1127317. [DOI] [PMC free article] [PubMed] [Google Scholar]
- 31.Grover W.H., Bryan A.K., Manalis S.R. Measuring single-cell density. Proc. Natl. Acad. Sci. USA. 2011;108:10992–10996. doi: 10.1073/pnas.1104651108. [DOI] [PMC free article] [PubMed] [Google Scholar]
- 32.Collet J.P., Shuman H., Weisel J.W. The elasticity of an individual fibrin fiber in a clot. Proc. Natl. Acad. Sci. USA. 2005;102:9133–9137. doi: 10.1073/pnas.0504120102. [DOI] [PMC free article] [PubMed] [Google Scholar]
- 33.Grobelnik B., Vidmar J., Sersa I. Flow-induced permeation of non-occlusive blood clots: an MRI study and modelling. Eur. Biophys. J. 2008;37:1229–1233. doi: 10.1007/s00249-008-0342-8. [DOI] [PubMed] [Google Scholar]
- 34.Kuo W.T., van den Bosch M.A., Sze D.Y. Catheter-directed embolectomy, fragmentation, and thrombolysis for the treatment of massive pulmonary embolism after failure of systemic thrombolysis. Chest. 2008;134:250–254. doi: 10.1378/chest.07-2846. [DOI] [PubMed] [Google Scholar]
- 35.Fincham D. Choice of timestep in molecular-dynamics simulation. Comput. Phys. Commun. 1986;40:263–269. [Google Scholar]
- 36.Furukawa A., Tanaka H. Key role of hydrodynamic interactions in colloidal gelation. Phys. Rev. Lett. 2010;104:245702. doi: 10.1103/PhysRevLett.104.245702. [DOI] [PubMed] [Google Scholar]
- 37.Buxton G.A. The fate of a polymer nanoparticle subject to flow-induced shear stresses. Europhys. Lett. 2008;84:26006. [Google Scholar]
- 38.Kim K., Nakayama Y., Yamamoto R. Direct numerical simulations of electrophoresis of charged colloids. Phys. Rev. Lett. 2006;96:208302. doi: 10.1103/PhysRevLett.96.208302. [DOI] [PubMed] [Google Scholar]
- 39.Pivkin I.V., Richardson P.D., Karniadakis G. Blood flow velocity effects and role of activation delay time on growth and form of platelet thrombi. Proc. Natl. Acad. Sci. USA. 2006;103:17164–17169. doi: 10.1073/pnas.0608546103. [DOI] [PMC free article] [PubMed] [Google Scholar]
- 40.Diamond S.L. Systems biology to predict blood function. J. Thromb. Haemost. 2009;7(Suppl 1):177–180. doi: 10.1111/j.1538-7836.2009.03463.x. [DOI] [PubMed] [Google Scholar]
- 41.Koradi R., Billeter M., Guntert P. Point-centered domain decomposition for parallel molecular dynamics simulation. Comput. Phys. Commun. 2000;124:139–147. [Google Scholar]