

Abstract
The dorsal anterior cingulate cortex (dACC) is a key hub of the brain's executive control system. Although a great deal is known about its role in outcome monitoring and behavioral adjustment, whether and how it contributes to the decision process remain unclear. Some theories suggest that dACC neurons track decision variables (e.g., option values) that feed into choice processes and is thus “predecisional.” Other theories suggest that dACC activity patterns differ qualitatively depending on the choice that is made and is thus “postdecisional.” To compare these hypotheses, we examined responses of 124 dACC neurons in a simple foraging task in which monkeys accepted or rejected offers of delayed rewards. In this task, options that vary in benefit (reward size) and cost (delay) appear for 1 s; accepting the option provides the cued reward after the cued delay. To get at dACC neurons' contributions to decisions, we focused on responses around the time of choice, several seconds before the reward and the end of the trial. We found that dACC neurons signal the foregone value of the rejected option, a postdecisional variable. Neurons also signal the profitability (that is, the relative value) of the offer, but even these signals are qualitatively different on accept and reject decisions, meaning that they are also postdecisional. These results suggest that dACC can be placed late in the decision process and also support models that give it a regulatory role in decision, rather than serving as a site of comparison.
Introduction
The dorsal anterior cingulate cortex (dACC) is a key node in the brain's executive control system. It is situated at the interface of the reward and motor systems and thus likely plays an important role in using reward information to influence action (Paus, 2001). There is a great deal of information on its role in monitoring and adjustment (Ito et al., 2003; Rushworth et al., 2004; Quilodran et al., 2008; Alexander and Brown, 2011; Bernacchia et al., 2011; Hayden et al., 2011a,b; Shenhav et al., 2013). It is sensitive to received rewards, errors, and to differences between expected and obtained rewards (Amiez et al., 2005, 2006; Matsumoto et al., 2007; Hayden et al., 2011a). These signals appear to summate to indicate the balance of evidence in favor of adjustments to action or the need for control (Shima and Tanji, 1998; Kerns et al., 2004; Hayden et al., 2011b; Shenhav et al., 2013).
There is relatively less information on the direct contributions, if any, of dACC to the value representation and comparison processes that constitute reward-based choice. On one hand (as we will argue here), dACC may not be directly involved, and instead function as a monitor and controller of both the decisions we make and of their outcomes. If so, we would expect that its responses around the time of the decision to signal variables related to the chosen option and to depend qualitatively on the choice that is made (Cai and Padoa-Schioppa, 2012). On the other hand, dACC may represent values of offers. This information would presumably be used for a downstream comparison process, to determine a choice (Wunderlich et al., 2009).
To test these ideas, we recorded activity of single dACC neurons in a diet selection task based on a famous problem from foraging theory (Krebs et al., 1977; Stephens and Krebs, 1987). On each trial, monkeys accept or reject a delayed reward. To solve this task, monkeys should compare the rate of the reward they expect to receive if they accept it (i.e., the profitability of the offer) to the rate of reward they would expect to receive in if they were to reject it (Krebs et al., 1977; Stephens and Krebs, 1987). The fundamental logic of this idea, that decisions should be compared with the opportunity cost of the next best alternative, is the same as the idea of economists that “all costs are opportunity costs” (Krugman et al., 2011). In the diet selection task, the foregone benefit of accepting an offer is a linear function of its delay and does not depend on its reward size, whereas the foregone benefit of rejecting is a linear function of its reward size and does not depend on its delay.
We find that around the time of the choice, neurons signal foregone benefit of rejected options. They also signal profitability, but do so in a different format (meaning neurons use different response patterns) for accept and reject decisions. Thus, variables encoded by dACC neurons around the time of the decision are predominantly postdecisional. These findings suggest that dACC does not serve as a site of value comparison. We conjecture that the brain uses these variables to monitor and evaluate the outcomes of decisions and perform strategic or regulatory adjustments, perhaps as it is being made. These results endorse the idea that dACC is fundamentally a controller, both during and after decisions.
Materials and Methods
Ethics statement.
All procedures were approved by the University of Rochester Institutional Animal Care and Use Committee and were designed and conducted in compliance with the Public Health Service's Guide for the Care and Use of Animals.
Task.
On each trial of our task, an option appeared at the top of the screen and moved smoothly at a constant rate downward. All options were horizontally oriented rectangles 80 pixels high and of variable width (60–300 pixels; Fig. 1). Option color indicated reward value: orange (0.075 ml), gray (0.135 ml), green (0.212 ml), or cyan (0.293 ml). In addition to these four colors, one-fifth of options were divided horizontally into half-cyan and half-red portions; these offered a 50% chance of receiving a 0.293 ml reward, and 50% chance of receiving no reward. Option width indicated delay associated with that option. Option widths were 60, 120, 180, 240, and 300 pixels and corresponded to delays of 2, 4, 6, 8, or 10 s, respectively. Each possible option (30 options, 5 widths by 6 colors) appeared with equal frequency; width and color were selected randomly and independently on each trial.
Figure 1.

Task and recording location. A, Task design. Options moved smoothly down the screen. Subjects fixated options to choose them. Rewards were given if fixation was maintained for a fixed delay (indicated by option width). Color indicated reward available. Two example trials are shown. In the first, the subject does not fixate (i.e., he rejects). In the second, the subject fixates to completion and receives a reward (i.e., he accepts). B, Reward sizes and handling times used. C, Recording site in dACC.
Two male rhesus macaques (Macaca mulatta; Monkeys B and J) performed the task. On each trial, a subject could select an option by fixating it or reject the option by avoiding direct gaze on it. In the absence of any action, each option took 1 s to move vertically downward from the top of the display area of the computer monitor to the bottom, after which time it disappeared and could no longer be chosen. In this case, the trial would end and a 1.5 s intertrial interval (ITI) would begin. If the monkey selected an option by fixating it, the option would stop moving wherever it was and then would begin to shrink horizontally. Shrinking rate was constant (30 pixels/s) and thus option width served to identify total remaining delay associated with each option.
If the monkey averted gaze from the option during the shrinking phase, the option would (after a 0.25 s grace period) continue its movement toward the bottom of the screen. As it moved, its width would remain at what it had been when gaze was averted, and if it was fixated upon again, it would again pause and begin shrinking from its new, smaller width. If at any point the monkey held an option until it shrunk entirely, the appropriate reward would be delivered, the trial would end, and a 1.5 s ITI would follow.
Behavioral techniques.
Horizontal and vertical eye positions were sampled at 1000 Hz by an infrared eye-monitoring camera system (EyeLink 1000, SR Research). We wrote our experiments in MATLAB (MathWorks), using the Psychophysics and Eyelink Toolbox extensions. A standard solenoid valve (Parker) controlled the duration of water delivery. Immediately before recording, we performed a careful calibration of our solenoid system to establish a precise relationship between solenoid open time and water volume in our rigs.
Surgical procedures.
Two male rhesus monkeys (Macaca mulatta) served as subjects. Initially, a head-holding mount was implanted using standard techniques. Four weeks later, animals were habituated to laboratory conditions and trained to perform oculomotor tasks for liquid reward. A second surgical procedure was then performed to place a 19 mm plastic recording chamber (Crist Instruments) over dorsal anterior cingulate cortex (32 mm anterior, 7 mm medial interaural). Animals received analgesics and antibiotics after all surgeries. The chamber was kept sterile with regular antibiotic washes and sealed daily with sterile plastic caps.
Microelectrode recording techniques.
Single electrodes (Frederick Haer; impedance range 0.8–4 MΩ) were lowered using a microdrive (NAN Instruments) until the waveform of one or more (1–3) neuron(s) was isolated. Individual action potentials were identified by standard criteria and isolated on a Plexon system. Neurons were selected for study solely based on the quality of isolation and never on task-related response properties.
We approached dACC through a standard plastic recording grid (Crist Instruments). dACC was identified by structural magnetic resonance images taken before the experiment and concatenated using Brainsight (Rogue Research). Neuroimaging was performed at the Rochester Center for Brain Imaging, on a Siemens 3T MAGNETOM Trio TIM using 0.5 mm voxels. Chamber placement was reconciled with Brainsight. We also used Brainsight to guide placement of grids and to determine the location of our electrodes. We confirmed recording locations by listening for characteristic sounds of white and gray matter during recording, which in all cases matched the loci indicated by the Brainsight system with an error of <1 mm. Our recordings came from areas 6/32 and 9/32 according to the Paxinos atlas.
Optimal foraging calculations.
We based our estimates of the optimal threshold for acceptance of an option off the algorithm described by Stephens and Krebs, 1987. First, a ranked ordering of the possible kinds of options (4 reward sizes × 5 delay sizes) was generated based on each option's profitability. We left out gamble options due to difficulties estimating the value of them (discussed in more detail at the end of this section).
According to the Prey Algorithm (Stephens and Krebs, 1987), options should be added to the diet as long as where e is reward size, h is handling time (or delay, as we refer to it), and thus gives the profitability of option 1. l gives the option's frequency, which is equal for all options in our task. Options are sorted, such that . Thus, the algorithm dictates that one goes through the options from most to least profitable, continually updating the current strategy to include the option being considered until the above inequality is no longer satisfied. At that point, the left side of the inequality, is the optimal threshold.
The model assumes that there is no cost to rejecting an option. In our task, this assumption does not hold true. Thus, our task violates one of the assumptions of the prey model, so we made one small alteration to the above algorithm. Rejecting an option imposes a small time cost of up to 1 s for the option to fall to the bottom of the screen, plus a 250 ms grace period where the option stays in place, plus time required to make a decision (and look away), which generally takes 500 ms. Thus, we estimated the time cost of rejection at 1.75 s. To take this cost into account, we simply subtracted it from the handling time, to get the added cost of acceptance. This step never resulted in a negative handling time, as all handling times were 2 or more seconds.
The exclusion of gambling options from this optimality analysis was due to the lack of a suitable method for including them. In principle, one could use the expected profitability of the options (the expected reward size divided by the delay). However, we know from a large number of previous results (Hayden et al., 2008, 2011a; Hayden and Platt, 2009), as well as the monkeys' behavior in the present task that they overvalue gambles (see Results, Behavioral results). Thus using the profitability provides a poor measure of the subjective value of these options. Alternatively, we could use the monkeys' own behavior to determine the subjective value of these options. However, using this method would produce spurious correlations between the estimated optimal behavior and the animals' behavior. Thus, we simply chose to exclude these options from the optimality analysis. Note that doing so has no bearing on our major results presented in this paper.
Results
Behavioral results
Both monkeys rapidly learned and mastered the diet selection task. They appeared to have an understanding of the task within a few dozen trials and developed a consistent strategy within 3 d of training. Both monkeys were trained for at least 3 weeks before recording began to ensure that preferences were stable. All data reported here come from well after the completion of this training period. We continued to monitor and verify stability throughout recordings
Normative behavior in this task demands sensitivity to both reward size and delay of offers. Both monkeys showed sensitivity to reward size (Fig. 2A; linear regression, acceptance rate regressed onto reward size, in μl: b = 0.02165, t(49973) = 107.653, p < 0.0001) and delay length (linear regression, acceptance rate regressed onto time in seconds; b = −0.099, t(49973) = −147.3, p < 0.0001) in their choices. Although monkeys could, in theory, abandon an option after it was chosen they seldom chose to do this (they ended up abandoning after fixating for 750 ms on 6.6% of all trials, 8.3% in Monkey B and 4.0% in Monkey J).
Figure 2.

Behavior. A, Proportion of options accepted varied with both reward amount and delay. Colors indicate reward sizes as indicated by Figure 1B. B, Acceptance rate rose with profitability of option. Gamble options were excluded from this analysis. Blue line indicates best-fit logistic line. Red line is the optimal threshold (see Materials and Methods for optimality calculation details). C, Monkeys had a larger acceptance rate for gambles than would be expected based on the profitability of gambles. Blue line indicates the estimated acceptance rate for gamble options based on line fit from B. Blue-red dashed line indicates actual gamble acceptance rate. For all panels, error bars are smaller than the lines.
According to foraging theory, profitability (defined as the reward size divided by the amount of time required to obtain it) is the key variable foragers should use to make their decision in a stable environment (Stephens and Krebs, 1987). Both monkeys showed behavior that was consistent with normative foraging theory: a strong relationship between acceptance rates and profitability (Fig. 2B; logistic regression, b = 141.56, z(49973) = 103.0, p < 0.0001). The optimal policy in this task is to set a specific fixed accept/reject threshold whose value depends on the average richness of the environment (Stephens and Krebs, 1987). Animals should therefore accept all prey items more profitable than a specific value and reject all less profitable items.
Thus, we might expect a step–function shaped accept–reject curve. Foraging theory gives an the optimal threshold in this task of 23.7 μl/s (see Materials and Methods for estimation method; Stephens and Krebs, 1987). The two animals' transition point (the point at which we estimate a 0.5 acceptance rate) was 26.3 μl/s, 11% above the optimal threshold (Fig. 2B). The transition point for subject J is 23.6 μl/s, transition point for Monkey B is 29.1 μl/s. Thus, Monkey B was biased to accept slightly more often than he should have; Monkey J nearly matched the optimal threshold. Acceptance rates were not well fit by a step function, but instead showed a relatively shallow sigmoidal curve (Fig. 2B). This pattern is reminiscent of that observed in a well known earlier testing of foraging preferences using a similar task (Krebs et al., 1977). This is not surprising, given that stochasticity in preference behavior is a general trait of biological decision-makers (Busemeyer and Townsend, 1993).
In addition to the four prey options with predictable outcomes, 20% of the prey options were gambles: these offered a 50% chance of the largest reward size (293 μl) and 50% chance of no reward (Fig. 1B). The monkeys' acceptance rate for gamble options was much higher than would be predicted given their expected values (67.7% acceptance rate of all gamble options, where an acceptance rate of 53.4% is expected, this is highly significant, p < 0.0001, binomial test; Fig. 2C). Previous studies have reported risk-seeking behavior in two-option choice contexts; that is, monkeys are more likely to choose a risky option than one would predict based on its expected value (Hayden and Platt, 2009; Hayden et al., 2010; O'Neill and Schultz, 2010; So and Stuphorn, 2010; Heilbronner and Hayden, 2013). These data thus indicate that monkeys' risk-seeking bias extends beyond binomial choice tasks to arguably more naturalistic foraging-line tasks, and thus demonstrate the robustness of monkeys' risk-seekingness (Heilbronner and Hayden, 2013).
Time course of neural responses
We recorded the activity of 124 neurons from dACC while monkeys performed the diet selection task (74 neurons from Monkey B, 50 from Monkey J). The recording location is shown in Figure 1C and described in Materials and Methods. During each trial, we typically observed an initial burst of spikes followed by an extended period of low activity and then a second period of high activity around the time of the reward (Fig. 3A). These basic patterns are consistent with the perisaccadic activations we have reported previously in this region (Hayden et al., 2011b).
Figure 3.

General neural response properties. A, The typical time course of the firing rate of an example neuron. An initial period of high activity follows the appearance of the option. Activity then stays steady for a fixed period, before ramping up in reward anticipation. The gray box indicates the first second, which is the focus this paper. The middle period is condensed for higher delay options, to show trials on the same scale. Only trials that are accepted and have delays of 6–10 s are included, to show the full time course leading up to reward. B, Percentage of cells that reach significant (p < 0.05) correlation between firing rate and delay (red), reward (green), and both (yellow) significant correlation for both delay and reward. Sliding boxcar analysis; window size is 100 ms, time 0 is the time of option appearance, and the green area indicates our best estimate of when the decision it being made.
We first sought to estimate the amount of time it took the monkeys to make their decisions. Monkeys generally adopted a strategy of fixating the option as soon as it appeared and then either maintaining gaze to accept it or averting their eyes to reject it (the rare trials where the monkey never fixated the option were not analyzed). Because the time of the accept decision is not observable, we estimated decision time by measuring when the animals typically looked away during reject trials. We found that mean reject time was 495 ±6 ms (SE). Given that oculomotor planning and execution presumably takes at least 100 ms (Stanford et al., 2010), we estimated that the decision generally occurred approximately between 300 and 400 ms after stimulus onset.
We first looked at the population frequency of encoding of the two parameters that defined each option, its delay and its reward size (fluid volume). We reasoned that neurons encode a variable if their firing rates correlate with the value of that variable and so performed a correlation with running boxcar (100 ms windows, 10 ms step). Because spiking patterns are non-Gaussian (Dayan and Abbott, 2005), we used Poisson regression (including an estimated dispersion coefficient to account for overdispersion in our data) to relate the number of spikes onto z-scored values of delay and reward size (Fig. 3B).
We found that the proportion of neurons encoding either task variable peaked ∼500 ms, shortly after the estimated decision time, and then remain fairly stable for the next 500 ms. We therefore used the epoch from 500 to 1000 ms after the onset of the stimulus summarize the effects we see in the boxcar analysis. (Similar although weaker patterns were found in other adjacent epochs; data are not shown here). A high proportion of neurons encoded either delay (37.9%, 47 of 124 neurons) or reward (42.7%, n = 53/124), and many encoded both simultaneously (24.2%, n = 30/124).
Of those neurons significantly encoding reward size in the 500–1000 ms epoch, 64.1% (n = 34/53) correlated positively with reward size, and the remaining 35.9% (n = 19/53) negatively correlated with reward size. This bias toward positive encoding approaches, but does not reach, significance (p = 0.0534, two-sided binomial test). Of those significantly encoding delay, 55.3% (n = 26/47) correlated positively with delay, and the remaining 44.7% (n = 21/47) correlated negatively with delay. This bias toward positive encoding is not significant (p = 0.560, two-sided binomial test).
Neurons in dACC preferentially encode delay on accept trials
In the diet selection task, accepting an option provides a reward but also imposes an opportunity cost in the form of a certain delay. This delay is costly because monkeys lose the opportunity to harvest other rewards while they are waiting (Charnov, 1976; Stephens and Krebs, 1987). Given the well established role of dACC in encoding fictive rewards and values of unchosen options, we hypothesized that immediately following accept decisions, dACC neurons would encode the option's delay but not its reward size (Hayden et al., 2009; Boorman et al., 2011). We found this to be generally true (Fig. 4A,B; see example neurons).
Figure 4.
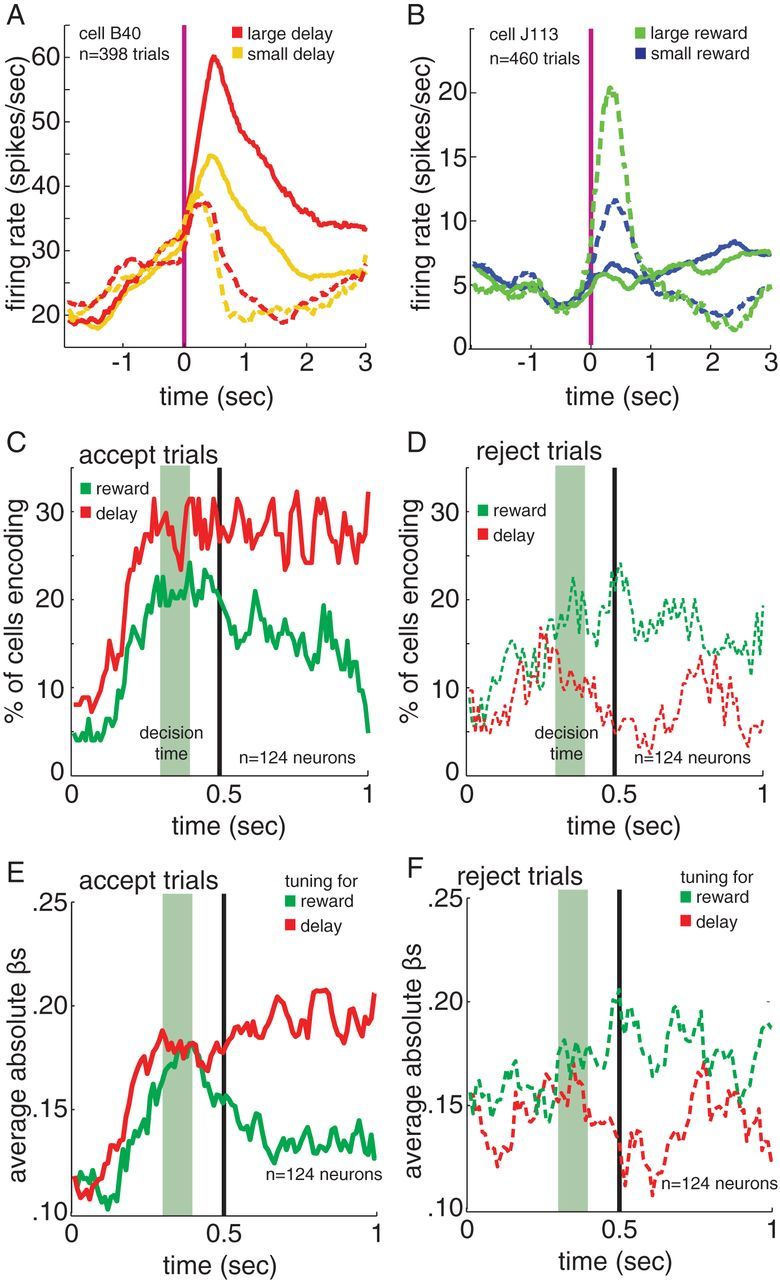
On accept trials neurons are biased toward encoding delay, on reject trials neurons are biased toward encoding reward size. A, B, Average trial onset-aligned firing rates from example neurons. Solid lines indicate accept trials, dashed indicate reject trials. Example cells show, A, sensitivity to delay size during accept trials but not reject trials, and B, sensitivity to reward size on reject trials but not accept trials. Vertical red line indicates option onset. C, D, The percentage of neurons encoding reward (green) and delay (red) on C, accept trials and D, reject trials. In all cases, time 0 indicates time of option onset. E, F, The average strength of the regression coefficients for reward and delay, separated by E, accept trials and F, reject trials. In all cases, a plotted dashed line refers to reject trials and solid refers to accept trials. Sliding boxcar analysis: window size is 100 ms, time 0 is the time of option appearance, and the green area indicates our best estimate of when the decision it being made. Green area indicates estimated decision time. Vertical black line indicates 0.5 s, the beginning of the 500–1000 ms epoch analyzed and detailed in the text.
We first used a running boxcar analysis (100 ms sliding window, steps of 10 ms), only including the data from accept trials (Fig. 4C,E). We again used Poisson regression to relate the number of spikes onto z-scored values of delay and reward size on each window. We found that, at around the time of the decision, there was a divergence between the number of neurons significantly signaling reward size and the number significantly signaling delay, with more signaling delay (Fig. 4C). The strength of this signaling, as measured by regression coefficients, followed the same pattern (Fig. 4E). To quantify these effects, we again focused on the 500 ms epoch beginning immediately after choice (t = 500–1000 ms). We found that on accept trials the regression coefficient for delay was significant for 37.1% of neurons (n = 46/124; criterion for significance, α = 0.05). The coefficient for reward size was significant for only 24.2% (n = 30/124) neurons. This difference between the proportion of neurons encoding delay and reward size was significant (p = 0.028, z test for two population proportions). These data indicate that, while neurons encode both delay and reward information following choices, encoding of delay is more prevalent.
Of those neurons significantly encoding reward size in the 500–1000 ms epoch on accept trials, 50% (n = 15/30) correlated positively with reward size, and the remaining 50% (n = 15/30) negatively correlated with reward size. Of those significantly encoding delay, 60.9% (n = 28/46) correlated positively with delay, and the remaining 39.1% (n = 18/46) correlated negatively with delay. This bias toward positive encoding is not significant (p = 0.184, two-sided binomial test).
We used the absolute value of the regression coefficient (i.e., β-weight) as a measure of effect size. This rectified regression coefficient indicates how much the firing rate of a neuron changes as a function of delay or reward size. Note that this definition is agnostic about the direction of tuning; the goal of this analysis is to estimate how much information is available in average neuronal firing rates, regardless of tuning direction. Our effect size measure was consistent with our prevalence measure. The average absolute values of the β-weights were stronger for delay than reward size in accept trials (Fig. 4C–F). Across all neurons, the average of the β-weights in the 500–1000 ms time window was 0.157 for the delay coefficient and 0.105 for the reward size coefficient (note that, because the regressors were z-scored, these coefficients are directly comparable and have no units). In other words, delay was 49.5% more effective in driving neural activity than was reward size. This difference was significant (paired sample t test on individual values, p < 0.001).
Neurons in dACC preferentially encode reward size on reject trials
If dACC encodes foregone rewards, then following reject decisions, we should see a preferential encoding of reward size even though the reward is unavailable and is not expected. We again used a running boxcar analysis (100 ms window, 10 ms steps) including only data from reject trials (Fig. 4D,F). In a reversal of what we saw in accept trials, around the time of the decision, dACC neurons became more sensitive to reward size than to delay.
We again focused on the 500–1000 ms epoch to quantify these effects. The average of the absolute values of the β-weights was stronger for reward size than delay in reject trials (Fig. 4F). Across all neurons, the average of the β-weights in the 500–1000 ms time window was 0.098 for the delay coefficient and 0.129 for the reward size coefficient. This difference was significant (p = 0.006, paired sample t test on individual values). Thus, in contrast to what we found on accept trials, reward size is more strongly encoded than delay on reject trials. We found that the coefficient for reward size was significant in 23.4% of neurons in our sample (n = 29/124). Encoding of reward size was more common than encoding of delay, which achieved significance in 12.9% of neurons (n = 16/124; p < 0.05). This difference between the proportion of neurons encoding delay and reward size is significant (p = 0.032, z test for two population proportions).
Of those neurons significantly encoding reward size in the 500–1000 ms epoch on reject trials, 75.9% (n = 22/29) correlated positively with reward size, and the remaining 24.1% (n = 7/29) negatively correlated with reward size. This bias toward positive encoding is significant (p = 0.008, two-sided binomial test). Of those significantly encoding delay, 37.5% (n = 6/16) correlated positively with delay, and the remaining 62.5% (n = 10/16) correlated negatively with delay. This bias toward positive encoding is not significant (p = 0.455, two-sided binomial test).
Foregone reward signals depend on whether monkeys choose to accept or reject
Our results so far indicate that neurons preferentially encode delays on accept trials and rewards on reject trials, and thus that their representational repertoires depend on the choice that is made. To test this idea directly, we ran a Poisson regression on all trials (as opposed to separating by accept and reject as done above). To compute regressors, we used a formal definition of foregone reward. For reject trials, this was simply defined as the reward of the rejected option; delay was irrelevant. For accept trials, this was defined as the average reward that would be expected to be gained during a time period as long as the delay period. Aside from its influence on the rate, any other cost of the delay itself was ignored. This is a key variable used to make the decision in foraging theory. To derive this measure empirically, we calculated (on a session-by-session basis) the total amount of reward (in milliliters) the animal received during the full session, and divided this by the length of the session (in seconds), to get the average rate of reward in milliliters per second during this session. We then multiplied this by the delay to estimate the reward forsaken by accepting an option. (This regressor is a linear function of delay, and is therefore linearly related to the normalized delay regressor used above). We then used Poisson regression to relate firing rate to these two opportunity cost measures, a decision term (coded as 1 for accept and 0 for reject), and two interaction terms, decision × each of the two opportunity cost terms. We again computed coefficients in a sliding boxcar analysis (100 ms windows and 10 ms steps; Fig. 5) and on the longer 500–1000 ms epoch. To compare the strength of encoding of the opportunity cost variables, we analyzed the absolute values of the regression coefficients (adding the coefficients of the decision interaction terms to the opportunity cost coefficients to derive the true coefficients for accept trials).
Figure 5.

A plot of the regression coefficients from the boxcar analysis of reject and accept opportunity costs. Dashed lines indicate reject trial coefficients, solid indicate accept trial coefficients. Sliding boxcar analysis; window size is 100 ms, time 0 is the time of option appearance, and the green area indicates our best estimate of when the decision it being made.
Consistent with our hypothesis, the foregone reward variable for accepting is more strongly encoded on accept trials and foregone reward of rejecting is more strongly encoded on reject trials. In the 500–1000 ms epoch, we found that the regression coefficient for the foregone reward of accepting was significantly higher for accept trials than reject trials (mean of 4.32 regression coefficient on accept trials versus 2.96 regression coefficient on reject trials, difference is significant, p < 0.001, paired sample t test on individual values). By taking the exponential of these coefficients, we can determine that an increase in this cost by 0.001 ml would modulate firing rate by 7.5% on accept trials, but only 1.9% on reject trials. In the same epoch, the coefficient for the foregone benefit of rejecting was significantly higher for reject trials than for accept trials (mean of 1.41 spikes/ml for accept trials, 1.90 spikes/ml for reject trials, difference is significant, p = 0.015, paired sample t test on individual values). An increase in this opportunity cost by 0.001 ml would modulate firing rate by 0.4% on accept trials and 0.7% on reject trials.
Note that with these non-normalized variables, it appears that the foregone benefit of accepting has a somewhat larger effect than the foregone benefit of rejecting, although we would not expect this based on our above analyses using the normalized versions. This is likely an artifact of the conservative methods we used to calculate the foregone reward of accepting; we used the average reward gained through an entire session, which includes periods where the animal is not engaged. Thus, this average reward gained is likely a low estimate and the regression coefficient must be larger to compensate for this.
Firing rate does not predict behavior on following trial
We have previously shown a that there is a relationship between firing rates and changes in strategy on the subsequent trial (Hayden et al., 2009, 2011a). We next examined whether these foregone reward signals predicted future choices. Using logistic regression, we regressed choice on a trial (accept or reject) onto firing rate during the 500–1000 ms epoch of the previous trial. We found no evidence that firing rate on the previous trial predicts choice. Specifically, only 4/124 neurons reached significance; this proportion is not significant (p = 0.504, binomial test). This lack of correlation between firing rate and choices mirrors the lack of an observed correlation between the foregone reward variable on this trial and choice on the next trial (logistic regression, p > 0.10). Thus, it appears that choices in the diet selection task are, to the limits of our analyses' ability to detect, independent across trials. We have previously speculated that postdecisional variables in dACC are encoded to the extent that they influence behavior (Hayden et al., 2011a). However, the present results suggest that, at least in this case, we find strong encoding of foregone cost in dACC even though this does not affect trial-to-trial variations in performance. These findings suggest that encoding of foregone reward is so basic that it is observed even when it is not measurably affecting behavior, and suggests that monitoring signals in dACC are subject to a downstream gating process (Hayden et al., 2011b).
Encoding of profitability
Formally speaking, decisions in this task should be based solely on profitability, or the ratio of reward to delay (Stephens and Krebs, 1987). Because profitability is a function of both reward and delay, it is difficult to distinguish profitability encoding from encoding of either of these two variables. Perhaps the most conservative test for profitability encoding is to examine the correlation between regression coefficients for reward and delay. A significant negative correlation at the population level would support the idea that dACC neurons, as a group, encode profitability.
This is indeed what we find. Using the reward size and delay coefficients from our initial 500–1000 ms Poisson regressions, we see a negative correlation between delay and reward size coefficients when looking at all trials together (r = −0.40, p < 0.0001; Fig. 6A), accept trials alone (r = −0.29, p < 0.0001; Fig. 6B), and reject trials alone (r = −0.47, p < 0.0001; Fig. 6C). This strong negative correlation is consistent with the idea that, in addition to opportunity cost, dACC also carries a profitability signal across both accept and reject conditions.
Figure 6.

Neurons encode profitability. A–C, Delay regression coefficients for each neuron plotted against that neuron's reward-size regression coefficient. The encoding of reward and delay are negatively correlated. Each point indicates an individual neuron's response to delay and reward; a negative coefficient means lower firing rate for higher values of the given variable. Points are color coded to indicate whether they reach significance (p < 0.05) for encoding of reward (green), delay (red), both (yellow), or neither (blue). Gray line indicates best-fit line. Showing data for A, all trials, B, accept trials, and C, reject trials. D, Percentage of neurons that have a significantly better fit with profitability added to the regression model than without.
To provide a more rigorous test of this idea, we ran further Poisson regressions using delay, reward size, and profitability (reward size divided by delay) as regressors. We regressed these variables against firing rate on accept and reject trials separately, and compared the deviance (a goodness of fit measure) of this model against a model that included delay and reward size, but did not include profitability (Fig. 6D). We then used a χ2 test (df = 1) on the difference in deviance to determine whether profitability significantly improved the fit of the model for that neuron. We found that profitability was encoded in both accept and reject trials, though more strongly in accept trials. In the 500–1000 ms epoch, we found that profitability improved the fit of the model for 29.0% of neurons (n = 36/124) for reject trials, and 46.0% of neurons (n = 57/124) for accept trials. This difference is significant (p = 0.006, z test for two population proportions). Of those 57 neurons that encoded profitability on accept trials, 43.9% (n = 25/57) positively encoded profitability and 56.1% (32/57) negatively encoded profitability. This difference between positive and negative encoding is not significant (p = 0.427, two-sided binomial test). Of those 36 neurons that encoded profitability on accept trials, 36.1% (n = 13/36) positively encoded profitability and 63.9% (23/36) negatively encoded profitability. This difference between positive and negative encoding is not significant (p = 0.133, two-sided binomial test). Our sliding boxcar analysis suggests that the time when profitability is encoded most strongly occurs at 420–450 ms.
We were curious to see whether the neurons that encoded profitability were more or less likely to also encode the other task variables, reward size, and delay. Because profitability is highly correlated with reward size and delay, we decided to again use deviance to see whether the same neurons that are modeled better by including profitability are more or less likely to be better modeled with profitability alone, or the full model (profitability, reward size, and delay). First, we tested how many neurons had their fits significantly improved by the addition of reward and delay to a model initially including only profitability, using the same procedure we used to look for improvements in model fit for profitability (χ2 test with df = 2, on the difference in deviance, using the 500–1000 ms epoch). We found that more neurons were significantly improved by going from a profitability-only model to the full model than were significantly improved by going from a reward size and delay model to the full model (on reject trials, of the population of 124 neurons, 62 neurons were significantly improved going from profitability to the full model, compared with the 36 being significantly improved going from reward size and delay to the full model; 85 neurons compared with 57 on accept trials; χ2 test on the difference in deviance, significance cutoff of p < 0.05). These differences were significant (p < 0.001 for both accept and reject, z test for two population proportions), suggesting reward size and delay are more important for modeling the neural responses than profitability is. Next, we looked at the relationship between how much the full model improved the fit of neurons over a model without profitability versus how much the full model improved the fit of neurons over a model without reward size and delay using the difference in deviance as a measure of the improvement in fit. We found the improvement gained by adding reward size and delay to a neuron's model was positively correlated with the improvement acquired by adding profitability to a neuron's model, for both accept and reject trials (r = 0.797, p < 0.0001 for accept trials, r = 0.304, p < 0.001 for reject trials; Fig. 7A,B). As one might expect from this correlation, most neurons that were significantly better modeled by including profitability were also significantly better modeled by including reward size and delay (on accept trials, 50 of 57 neurons that were significantly better fit with a model that included profitability were also significantly better fit with a model that included reward size and delay; 28 of 36 for reject trials). This pattern suggests that the population of neurons encoding profitability largely overlap with the population encoding other task variables.
Figure 7.
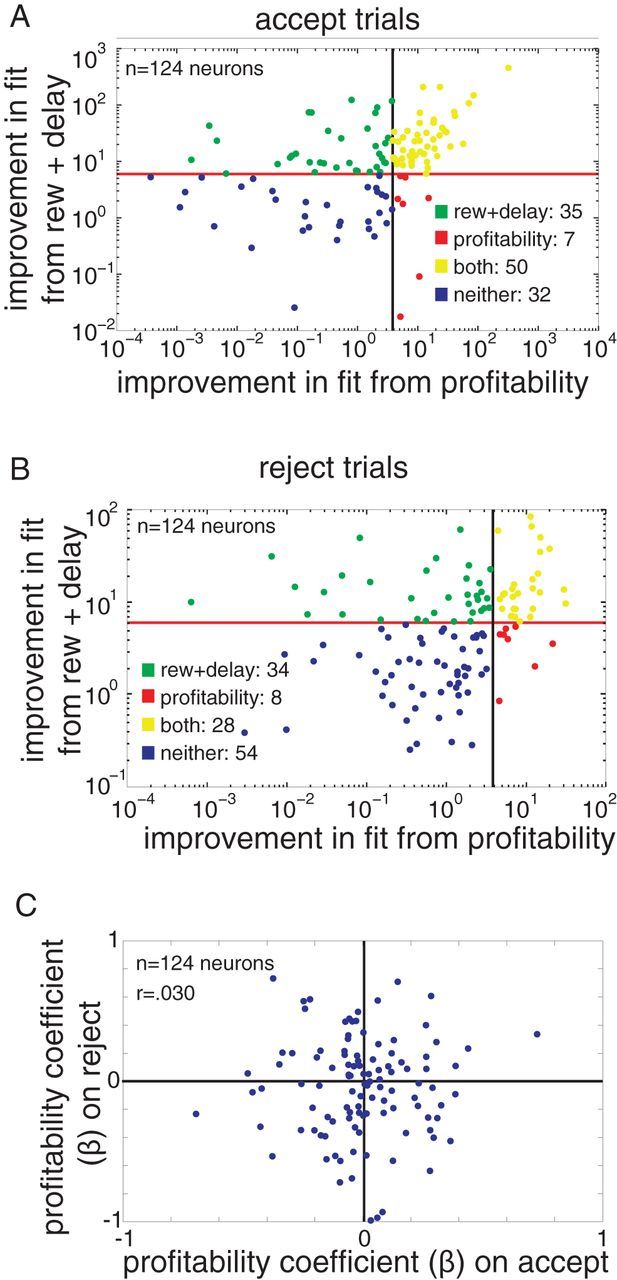
Profitability overlaps with reward size and delay encoding, and encoding is different on accept versus reject trials. A, B, The improvement in fit (as measured by difference in deviance) from adding profitability to a model including reward size and delay, plotted against the improvement of fit in adding reward size and delay to a model including only profitability, for A, accept trials, and B, reject trials. Lines indicate value required to reach significance. Points are color coded to indicate whether they reach significance (p < 0.05) for significant improvement in fit from adding reward size and delay (green), profitability (red), both (yellow), or neither (blue). C, The regression coefficient for each neuron on accept trials plotted against its regression coefficient on reject trials. There is no significant correlation.
We next investigated whether encoding of profitability was the same on accept and reject trials. If a neuron's firing rate was positively correlated with profitability on accept trials, it should also be positively correlated on reject trials. Surprisingly, this was not the case. Using the coefficients obtained with a Poisson regression (regressing spike count against reward size, delay, and profitability), we initially looked at the first 400 ms of the trials, as this captured the entirety of the estimated decision time. We found no correlation between the profitability regression coefficients (r = 0.030, p = 0.740; Fig. 7C). To ensure this negative result was not caused by a poor choice of time-window or model, we repeated this test on the first 250 ms, the first 500 ms, 250–500 ms, and 500–1000 ms, with and without reward size and delay included in the regression, and found no significant correlations or general trends (p > 0.35 in all cases).
Reward anticipation
We noticed that activity of many cells ramped up in anticipation of reward (Fig. 3A). This ramping up occurred 1–2 s before reward time (a later epoch than we have examined so far). To characterize this activity, we computed the firing rates of neurons in the 1000 ms window preceding reward delivery in accept trials. We excluded 2 s trials from this analysis to ensure that our anticipation time window was separated from the time of the initial decision. Thus, this prereward epoch begins 2–8 s after the ending of the epochs analyzed above.
We found that the firing rate significantly correlated with reward size in 24.2% of our neurons (n = 30/124, Poisson regression). Of those reaching significance, 63.3% (n = 19/30) correlated positively with reward, the remaining 36.7% (n = 11/30) correlated negatively with reward. This bias toward positive encoding is not significant (p = 0.200, two-sided binomial test).
We next considered the effect of delay on firing rate in the same regression analysis. We found that responses of few neurons encoded delay (16.9%, 21/124). Of the 21 neurons reaching significance, nine correlated positively with delay and 12 negatively.
Postreward response
Whereas most studies of dACC neuronal responses have focused on postreward responses, the present study has focused on prereward responses. We next characterized the postreward responses in this task using a procedure similar to our analysis of reward anticipation above. We computed the spike counts of neurons in the 500 ms window following reward delivery in accept trials. This postreward epoch occurs 1–9 s after the peridecisional epochs analyzed above.
We found that the firing rate significantly correlated with reward size in 28.2% of our neurons (n = 35/124, Poisson regression). Of those reaching significance, 57.1% (n = 20/35) correlated positively with reward, the remaining 42.9% (n = 15/35) correlated negatively with reward. This bias toward positive encoding is not significant, p = 0.500, two-sided binomial test.
We next considered the effect of delay on firing rate in the same regression analysis. We found that responses of few neurons encoded delay (11.3%, 14/124). Of the 14 neurons reaching significance, six correlated positively with delay, and 8 negatively.
Finally, we examined reward responses on the 20% of trials that offered a gamble. These trials uniquely provide a test of neural responses under uncertainty in our task. Twenty-two percent of neurons (27 of 121 neurons that had gamble trials) differentiated between receiving a reward and not receiving a reward (two-sample t test on neural activity 500 ms following reward delivery, or absence of reward delivery). Of these, 55.6% (15/27) showed increased firing rate for a gamble win, the remaining 44.4% (12/27) showed decreased firing rate. This bias was not significant (p = 0.414).
Discussion
Here we report the response properties of dACC neurons in an accept–reject foraging task whose structure is modeled on a classic foraging problem (Stephens and Krebs, 1987). On each trial, monkeys made an accept–reject decision and then waited several seconds for it to be resolved. Our goal was to understand the contributions of dACC to choice processes. We find that firing rates around the time of choice encode two distinct variables, option profitability, and foregone reward. Foregone reward, the inevitable reward missed by forsaking the unchosen option, is a postdecisional variable. That means it depends on the choice the animal makes, and cannot exist until the decision is made. Profitability encoding in this task is also postdecisional because its format (how neurons signal it and how strong the signal is) differs on accept and reject trials. Thus, although it can be computed, its format cannot be computed until the decision is made. Together, these results place dACC downstream of choice processes that evaluate options and compare them to make a decision. Based on its anatomical connections, we propose that profitability signals are generated in a ventral prefrontal area upstream of dACC that implements the decision process (Paus, 2001). Potential loci for this process include orbitofrontal cortex, ventromedial prefrontal cortex (vmPFC), and/or ventral striatum (Padoa-Schioppa and Assad, 2006; Rushworth et al., 2011).
If the dACC does not play a role in the current decision, then what does it do? Our results are consistent with the idea that dACC does much the same thing around the time of the decision that it does after the decision: it tracks variables related to outcomes of decisions that may have some influence on the need to adjust or alter behavioral strategies, or to bring greater cognitive control to bear (Botvinick et al., 2001; Kerns et al., 2004; Hayden et al., 2011a,b; Shenhav et al., 2013). Tracking foregone reward and profitability are valuable because, in a dynamic environment, switching is favored when foregone reward rises above the benefit of the chosen option (Boorman et al., 2011).
In a previous study, we showed that dACC computes these control variables even if the actual switching is weak and inconsistent (Hayden et al., 2011a). Others have also shown ACC activity is sensitive to task variables even when no choice is required (Sallet et al., 2007). Here, we extend these findings by showing that dACC computes these parameters in a task where they have no measurable effect on subsequent behavior. This finding suggests that, contrary to our earlier predictions, coding of putative control variables in dACC is not conditional on them being used to drive behavior (Hayden et al., 2011a). Instead, it suggests that they are subject to downstream gating processes that determine whether they are implemented. Thus, these results suggest that dACC is similar to the caudate nucleus, which can also compute control signals that are not used to guide behavior (Chiu et al., 2008). If the dACC control signals can, in the context of this task, have little to no effect on behavior they suggest that, although dACC is part of the control system, it plays a relatively early role (cf. Schall et al., 2002).
The broader idea that dACC plays a regulatory role, rather than serving as a comparator, is neither original nor new to us. Several other groups have previously argued that the essential role of dACC in cognition is to compute the need to adjust or alter strategy; in summary, it serves as a controller over choice strategy (Procyk et al., 2000; Botvinick et al., 2001; Holroyd and Coles, 2002; Kerns et al., 2004; Posner et al., 2007; Seo et al., 2007; Quilodran et al., 2008). This interpretation unites diverse findings linking dACC to the detection of errors, conflict, negative outcomes (in some tasks), and positive outcomes (in other tasks) by positing that dACC does not uniquely track any of these variables, but that its activity correlates with them incidentally, because they provide evidence in favor of switching (Hayden et al., 2011a).
These results are consistent with the conclusions, but not the specific results, of a recent important study on the role of dACC in choice (Cai and Padoa-Schioppa, 2012). Using a different task, the authors of that study found strong encoding of the chosen value, another postdecisional variable. Like us, they came to the conclusion that dACC does not play a direct role in choice. However, whereas we found that foregone reward was strongly encoded in our task, the most analogous variable in their task (“other value,” the value of the option not chosen) was not strongly represented. There are several possible explanations for the discrepancy between our study and theirs. One possibility is that, because the temporal structure of their task includes reward delivery shortly after choice (750 ms), reward expectancy signals may overlap with and hide any foregone value signals. Indeed, we report here that reward expectancy signals are present at least one second before reward delivery in our task. Another possibility is that the monkeys in that study followed a choice strategy that led to ignoring the unchosen option (or considering it very briefly), and so these signals do not have a chance to make their way from upstream areas to dACC. A third possibility is that accept–reject choices are framed differently from two-option choices, a possibility supported by recent fMRI work showing different functions of ACC and vmPFC in binary choices versus accept–reject foraging choices (Kolling et al., 2012) and in two seemingly similar gambling tasks (Hunt et al., 2013).
In an earlier study, we found that dACC neurons track fictive outcomes of decisions (Hayden et al., 2009). These fictive outcome findings are consistent with other results demonstrating coding of hypothetical outcomes in ACC (Boorman et al., 2011), and more broadly with the idea that dACC tracks decisional regret (Coricelli et al., 2005). Collectively, these results indicate that dACC does not simply carry a labeled line representation of actual reward size, but that it strongly represents rewards not received or not chosen. The present results suggest a different, and more general, interpretation of these earlier results: dACC does not track fictive outcomes (or any outcomes) per se, but signals the need to adjust strategies that comes from fictive outcomes. Fictive and hypothetical outcomes are often closely associated with switching or adjusting behavior (Hayden et al., 2009). We suspect that it is these signals originating within dACC that are responsible for the effects of hypothetical outcomes on behavioral changes and adjustments.
Footnotes
This work was supported by an NSF Career Award, an R00 (DA027718), and a Sloan Foundation fellowship to B.Y.H. We thank John Pearson and Alex Thomé for useful discussions, Marc Mancarella for assistance in data collection, and Caleb Strait for help with subject training.
The authors declare no competing financial interests.
References
- Alexander WH, Brown JW. Medial prefrontal cortex as an action-outcome predictor. Nat Neurosci. 2011;14:1338–1344. doi: 10.1038/nn.2921. [DOI] [PMC free article] [PubMed] [Google Scholar]
- Amiez C, Joseph JP, Procyk E. Anterior cingulate error-related activity is modulated by predicted reward. Eur J Neurosci. 2005;21:3447–3452. doi: 10.1111/j.1460-9568.2005.04170.x. [DOI] [PMC free article] [PubMed] [Google Scholar]
- Amiez C, Joseph JP, Procyk E. Reward encoding in the monkey anterior cingulate cortex. Cereb Cortex. 2006;16:1040–1055. doi: 10.1093/cercor/bhj046. [DOI] [PMC free article] [PubMed] [Google Scholar]
- Bernacchia A, Seo H, Lee D, Wang XJ. A reservoir of time constants for memory traces in cortical neurons. Nat Neurosci. 2011;14:366–372. doi: 10.1038/nn.2752. [DOI] [PMC free article] [PubMed] [Google Scholar]
- Boorman ED, Behrens TE, Rushworth MF. Counterfactual choice and learning in a neural network centered on human lateral frontopolar cortex. PLoS Biol. 2011;9:e1001093. doi: 10.1371/journal.pbio.1001093. [DOI] [PMC free article] [PubMed] [Google Scholar]
- Botvinick MM, Braver TS, Barch DM, Carter CS, Cohen JD. Conflict monitoring and cognitive control. Psychol Rev. 2001;108:624–652. doi: 10.1037/0033-295X.108.3.624. [DOI] [PubMed] [Google Scholar]
- Busemeyer JR, Townsend JT. Decision field theory: a dynamic-cognitive approach to decision making in an uncertain environment. Psychol Rev. 1993;100:432–459. doi: 10.1037/0033-295X.100.3.432. [DOI] [PubMed] [Google Scholar]
- Cai X, Padoa-Schioppa C. Neuronal encoding of subjective value in dorsal and ventral anterior cingulate cortex. J Neurosci. 2012;32:3791–3808. doi: 10.1523/JNEUROSCI.3864-11.2012. [DOI] [PMC free article] [PubMed] [Google Scholar]
- Charnov EL. Optimal foraging, the marginal value theorem. Theor Popul Biol. 1976;9:129–136. doi: 10.1016/0040-5809(76)90040-X. [DOI] [PubMed] [Google Scholar]
- Chiu PH, Lohrenz TM, Montague PR. Smokers' brains compute, but ignore, a fictive error signal in a sequential investment task. Nat Neurosci. 2008;11:514–520. doi: 10.1038/nn2067. [DOI] [PubMed] [Google Scholar]
- Coricelli G, Critchley HD, Joffily M, O'Doherty JP, Sirigu A, Dolan RJ. Regret and its avoidance: a neuroimaging study of choice behavior. Nat Neurosci. 2005;8:1255–1262. doi: 10.1038/nn1514. [DOI] [PubMed] [Google Scholar]
- Dayan P, Abbott LE. Theoretical neuroscience: computational and mathematical modeling of neural systems. Cambridge, MA: MIT; 2005. [Google Scholar]
- Hayden BY, Platt ML. The mean, the median, and the St. Petersburg paradox. Judgm Decis Mak. 2009;4:256–272. [PMC free article] [PubMed] [Google Scholar]
- Hayden BY, Heilbronner SR, Nair AC, Platt ML. Cognitive influences on risk-seeking by rhesus macaques. Judgm Decis Mak. 2008;3:389–395. [PMC free article] [PubMed] [Google Scholar]
- Hayden BY, Pearson JM, Platt ML. Fictive reward signals in the anterior cingulate cortex. Science. 2009;324:948–950. doi: 10.1126/science.1168488. [DOI] [PMC free article] [PubMed] [Google Scholar]
- Hayden BY, Heilbronner SR, Platt ML. Ambiguity aversion in rhesus macaques. Front Neurosci. 2010;4:166. doi: 10.3389/fnins.2010.00166. [DOI] [PMC free article] [PubMed] [Google Scholar]
- Hayden BY, Heilbronner SR, Pearson JM, Platt ML. Surprise signals in anterior cingulate cortex: neuronal encoding of unsigned reward prediction errors driving adjustment in behavior. J Neurosci. 2011a;31:4178–4187. doi: 10.1523/JNEUROSCI.4652-10.2011. [DOI] [PMC free article] [PubMed] [Google Scholar]
- Hayden BY, Pearson JM, Platt ML. Neuronal basis of sequential foraging decisions in a patchy environment. Nat Neurosci. 2011b;14:933–939. doi: 10.1038/nn.2856. [DOI] [PMC free article] [PubMed] [Google Scholar]
- Heilbronner SR, Hayden BY. Contextual factors explain risk-seeking preferences in rhesus monkeys. Front Neurosci. 2013;7:7. doi: 10.3389/fnins.2013.00007. [DOI] [PMC free article] [PubMed] [Google Scholar]
- Holroyd CB, Coles MG. The neural basis of human error processing: reinforcement learning, dopamine, and the error-related negativity. Psychol Rev. 2002;109:679–709. doi: 10.1037/0033-295X.109.4.679. [DOI] [PubMed] [Google Scholar]
- Hunt LT, Woolrich MW, Rushworth MF, Behrens TE. Trial-type dependent frames of reference for value comparison. PLoS Comput Biol. 2013;9:e1003225. doi: 10.1371/journal.pcbi.1003225. [DOI] [PMC free article] [PubMed] [Google Scholar]
- Ito S, Stuphorn V, Brown JW, Schall JD. Performance monitoring by the anterior cingulate cortex during saccade countermanding. Science. 2003;302:120–122. doi: 10.1126/science.1087847. [DOI] [PubMed] [Google Scholar]
- Kerns JG, Cohen JD, MacDonald AW, 3rd, Cho RY, Stenger VA, Carter CS. Anterior cingulate conflict monitoring and adjustments in control. Science. 2004;303:1023–1026. doi: 10.1126/science.1089910. [DOI] [PubMed] [Google Scholar]
- Kolling N, Behrens TE, Mars RB, Rushworth MF. Neural mechanisms of foraging. Science. 2012;336:95–98. doi: 10.1126/science.1216930. [DOI] [PMC free article] [PubMed] [Google Scholar]
- Krebs JR, Erichsen JT, Webber MI, Charnov EL. Optimal prey selection in the great tit (Parus major) Anim Behav. 1977;25:30–38. doi: 10.1016/0003-3472(77)90064-1. [DOI] [Google Scholar]
- Krugman PR, Wells R, Graddy KJ. Essentials of economics. New York: Worth; 2011. [Google Scholar]
- Matsumoto M, Matsumoto K, Abe H, Tanaka K. Medial prefrontal cell activity signaling prediction errors of action values. Nat Neurosci. 2007;10:647–656. doi: 10.1038/nn1890. [DOI] [PubMed] [Google Scholar]
- O'Neill M, Schultz W. Coding of reward risk by orbitofrontal neurons is mostly distinct from coding of reward value. Neuron. 2010;68:789–800. doi: 10.1016/j.neuron.2010.09.031. [DOI] [PubMed] [Google Scholar]
- Padoa-Schioppa C, Assad JA. Neurons in the orbitofrontal cortex encode economic value. Nature. 2006;441:223–226. doi: 10.1038/nature04676. [DOI] [PMC free article] [PubMed] [Google Scholar]
- Paus T. Primate anterior cingulate cortex: where motor control, drive and cognition interface. Nat Rev Neurosci. 2001;2:417–424. doi: 10.1038/35077500. [DOI] [PubMed] [Google Scholar]
- Posner MI, Rothbart MK, Sheese BE, Tang Y. The anterior cingulate gyrus and the mechanism of self-regulation. Cogn Affect Behav Neurosci. 2007;7:391–395. doi: 10.3758/CABN.7.4.391. [DOI] [PubMed] [Google Scholar]
- Procyk E, Tanaka YL, Joseph JP. Anterior cingulate activity during routine and non-routine sequential behaviors in macaques. Nat Neurosci. 2000;3:502–508. doi: 10.1038/74880. [DOI] [PubMed] [Google Scholar]
- Quilodran R, Rothé M, Procyk E. Behavioral shifts and action valuation in the anterior cingulate cortex. Neuron. 2008;57:314–325. doi: 10.1016/j.neuron.2007.11.031. [DOI] [PubMed] [Google Scholar]
- Rushworth MF, Noonan MP, Boorman ED, Walton ME, Behrens TE. Frontal cortex and reward-guided learning and decision-making. Neuron. 2011;70:1054–1069. doi: 10.1016/j.neuron.2011.05.014. [DOI] [PubMed] [Google Scholar]
- Rushworth MF, Walton ME, Kennerley SW, Bannerman DM. Action sets and decisions in the medial frontal cortex. Trends Cogn Sci. 2004;8:410–417. doi: 10.1016/j.tics.2004.07.009. [DOI] [PubMed] [Google Scholar]
- Sallet J, Quilodran R, Rothé M, Vezoli J, Joseph JP, Procyk E. Expectations, gains, and losses in the anterior cingulate cortex. Cogn Affect Behav Neurosci. 2007;7:327–336. doi: 10.3758/CABN.7.4.327. [DOI] [PMC free article] [PubMed] [Google Scholar]
- Schall JD, Stuphorn V, Brown JW. Monitoring and control of action by the frontal lobes. Neuron. 2002;36:309–322. doi: 10.1016/S0896-6273(02)00964-9. [DOI] [PubMed] [Google Scholar]
- Seo H, Barraclough DJ, Lee D. Dynamic signals related to choices and outcomes in the dorsolateral prefrontal cortex. Cereb Cortex. 2007;17:i110–i117. doi: 10.1093/cercor/bhm064. [DOI] [PubMed] [Google Scholar]
- Shenhav A, Botvinick MM, Cohen JD. The expected value of control: an integrative theory of anterior cingulate cortex function. Neuron. 2013;79:217–240. doi: 10.1016/j.neuron.2013.07.007. [DOI] [PMC free article] [PubMed] [Google Scholar]
- Shima K, Tanji J. Role for cingulate motor area cells in voluntary movement selection based on reward. Science. 1998;282:1335–1338. doi: 10.1126/science.282.5392.1335. [DOI] [PubMed] [Google Scholar]
- So NY, Stuphorn V. Supplementary eye field encodes option and action value for saccades with variable reward. J Neurophysiol. 2010;104:2634–2653. doi: 10.1152/jn.00430.2010. [DOI] [PMC free article] [PubMed] [Google Scholar]
- Stanford TR, Shankar S, Massoglia DP, Costello MG, Salinas E. Perceptual decision making in less than 30 milliseconds. Nat Neurosci. 2010;13:379–385. doi: 10.1038/nn.2485. [DOI] [PMC free article] [PubMed] [Google Scholar]
- Stephens DW, Krebs JR. Foraging theory. Ed 1. Princeton, NJ: Princeton UP; 1987. [Google Scholar]
- Wunderlich K, Rangel A, O'Doherty JP. Neural computations underlying action-based decision making in the human brain. Proc Natl Acad Sci U S A. 2009;106:17199–17204. doi: 10.1073/pnas.0901077106. [DOI] [PMC free article] [PubMed] [Google Scholar]