Abstract
Background
Participation and performance trends regarding the nationality of ultraendurance athletes have been investigated in the triathlon, but not in running. The present study aimed to identify the countries in which multistage ultramarathons were held around the world and the nationalities of successful finishers.
Methods
Finisher rates and performance trends of finishers in multistage ultramarathons held worldwide between 1992 and 2010 were investigated.
Results
Between 1992 and 2010, the bulk of multistage ultramarathons were held in Germany and France, with more than 30 races organized in each country. Completion rates for men and women increased exponentially, with women representing on average 16.4% of the total field. Since 1992, 6480 athletes have competed in Morocco, 2538 in Germany, and 1842 in France. A total of 81.9% of athletes originated from Europe, and more specifically from France (22.9%), Great Britain (18.0%), and Germany (13.4%).
Conclusion
European ultramarathoners dominated the athletes who completed multistage ultramarathons worldwide, with specific dominance of French, British, and German athletes. Future studies should investigate social aspects, such as sport tourism, among European athletes to understand why European athletes are so interested in participating in multistage ultramarathons.
Keywords: ultraendurance, run, nationality, distance, stage
Introduction
Numerous studies have investigated participation trends in ultraendurance races, such as ultramarathons,1,2 Ironman triathlons,3,4 and ultratriathlons,5–7 where ultraendurance performance is defined as athletic performance lasting longer than 6 hours.8 Successful performance in an ultraendurance event requires a high number of training hours,9 broad prerace experience,6,10 and adequate nutrition.11
The origin of the athletes might also be of importance for race outcome. Recent studies have investigated the influence of nationality on performance in ultraendurance athletes, in particular triathletes. Babbit reported that American athletes were the most represented in the “Ironman Hawaii” triathlon during the 80s, but that their rate of participation decreased from the 90s onwards.12 Rüst et al recently showed that European athletes have dominated the Double Iron ultratriathlon races since the first event was held in 1995.13 With regard to European ultratriathletes, those from Central Europe have dominated in both participation and performance.14 European triathletes have also dominated in the longer ultratriathlon distances, such as the Triple Iron ultratriathlon15 and the Deca Iron ultratriathlon.16,17 Further, central European athletes have dominated multisports races held in Central Europe at both the national18 and international19 levels.
For other endurance disciplines, such as running, the nationality of athletes participating in endurance performance has been investigated for runners competing between 800 m and the marathon distance, and Kenyan and Ethiopian runners have been found to dominate in these running distances for decades.20–23 The reasons why athletes from these countries have dominated are predominantly environmental,20–22,25 ie, they have had to travel further to school, and mainly by running. Genetic advantages are most likely irrelevant.24–26
Participation in ultramarathons has increased during recent decades.1,2 For 161 km ultramarathoners in the US, this trend is explained with an increase in athletes over 40 years of age, increased participation of women, and an increased number of finishes being completed by individual finishers.2 Regarding the gender difference in participation, it has been shown that the number of women participating in ultraendurance sports is still low. In fact, it seems that the longer the ultraendurance test, the lower the number of female finishers. For example, at the “Ironman Hawaii” triathlon, where athletes need to finish the race within 17 hours, the percentage of female finishers has been reported to be about 27%.3,4 For the 161 km ultramarathons, where athletes have to finish within 2 days, about 20% of the finishers were women.2 The lowest percentage of female finishers has been observed for ultratriathlons, varying from Double Iron ultratriathlons which are about 1.5 days in duration to Deca Iron ultratriathlons which are approximately 12 days in duration, with 8%–10% of those completing the total field being women.5
Physiological27–29 and nutritional30,31 factors have been investigated in multistage ultramarathons. However, aspects such as the nationality of finishers and the countries in which multistage ultramarathons were held have not been examined. Therefore, to fill this gap in the literature, we investigated trends in completion rates in multistage ultramarathons regarding the countries where races were held and the nationality of the athletes. The aims of this study were to identify the countries in which multistage ultramarathons were held and the finisher trends, with a special emphasis on the nationalities of finishers during the last two decades. We hypothesized an increase in the number of multistage ultramarathons over the years and an increase in the completion rate with a dominance of athletes originating from European countries.
Materials and methods
All runners who had ever finished a multistage ultramarathon worldwide between 1992 and 2010 were investigated for their nationality and gender. The data set for this study was obtained from Deutsche Ultramarathon Vereinigung32 and from race web sites. The study was approved by the institutional review board of St Gallen, Switzerland, with waiver of the requirement for informed consent, given that the study involved analysis of publicly available data. We considered a multistage ultramarathon event as a running race in which the total course was divided into multiple stages, with a length of around a marathon distance or more to cover, over several days. One stage is usually completed within one day. To get an overview of the changes in race conditions, the mean distance an athlete had to cover, as well as the mean number of stages per race, were also considered for each year.
In total, data were available for 13,260 athletes, including 2064 women and 11,196 men. We first identified all countries in which a multistage ultramarathon event had been held and the corresponding year. Athletes from 84 countries over the world participated in at least one multistage ultramarathon. We further considered the finishers from a country only if the country provided at least ten finishers over the years. We analyzed the changes in completion rates over the years for ten countries, ie, France, Great Britain, Germany, the US, Italy, Spain, Hungary, Austria, Switzerland, and Norway, with the highest number (≥293) of finishers.
Statistical analysis
In order to increase the reliability of the data analysis, each set of data was tested for normal distribution as well as for homogeneity of variances in advance of the statistical analysis. Normal distribution was tested using a D’Agostino and Pearson omnibus normality test, and homogeneity of variances was tested using the Levene’s test for two groups and the Bartlett’s test for more than two groups. To compare two groups with normal distribution and equal variances, a Student’s t-test was used. To compare two groups with non-normal distribution but equal variances, the Mann-Whitney U test was applied. In the event of not equal variances, an unpaired test with Welch’s correction was used. Linear regression was used to identify any significant changes in a variable across the years. Statistical analyses were performed using IBM SPSS Statistics version 19 (IBM SPSS Inc, Chicago, IL) and GraphPad Prism version 5 (GraphPad Software, San Diego, CA). Significance was accepted at P < 0.05 (two-sided for t-tests). Data in the text are given as the mean ± standard deviation.
Results
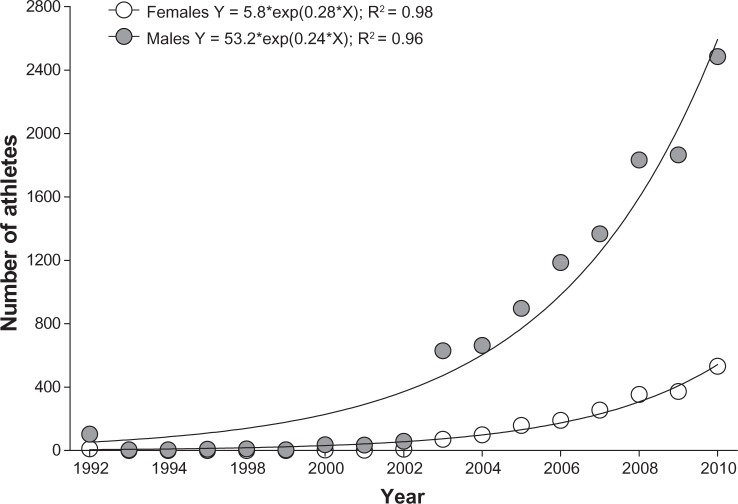
The number of finishers in multistage ultramarathons increased between 1992 and 2010 in an exponential manner for both women and men (Figure 1). In 1992, the number of finishers was 104 for men and 11 for women. Between 1993 and 1999, the annual number of finishers decreased to five for men and to less than one for women; and in 2000, to 37 for men and to four for women, respectively. Between 1992 and 2010, 2064 women and 11,196 men completed a multistage ultramarathon. Female runners represented on average 16.4% of the total field. The annual increase in the number of finishers was higher for men than for women.
Figure 1.
Annual number of male and female finishers in multistage ultramarathons between 1992 and 2010.
Figure 2 shows the changes in the number of finishers related to their continent of origin. For athletes originating from Europe, the US, Asia, Africa, Australia and South America, the number of finishers increased exponentially. Most of the 13,260 finishers in a multistage ultramarathon originated from Europe (10,860 finishers), followed by ultra-marathoners originating from the US (984 finishers), Asia (599 finishers), Africa (381 finishers), Australia (295 finishers) and South America (142 finishers). The greatest increase in completion rate took place in Europe, followed by Africa, South America, Asia, the US, and Asia. However, no change in participation was observed in Australia (Figure 3).
Figure 2.
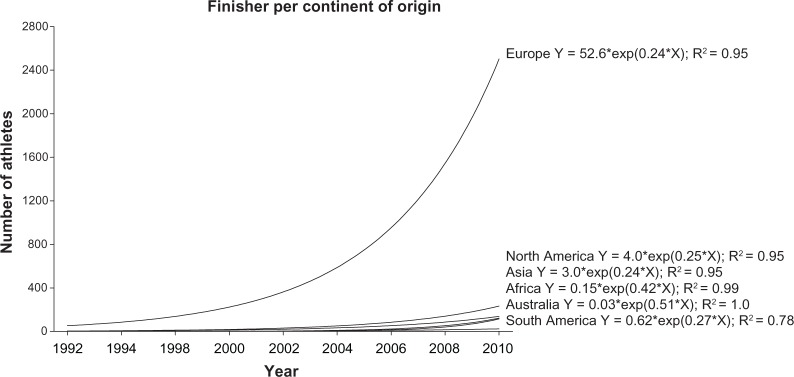
Number of finishers in multistage ultramarathons between 1992 and 2010 sorted by continent of origin of athletes.
Figure 3.
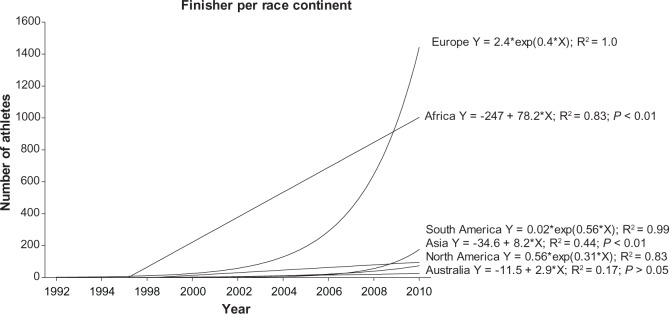
Number of finishers in multistage ultramarathons between 1992 and 2010 per continent.
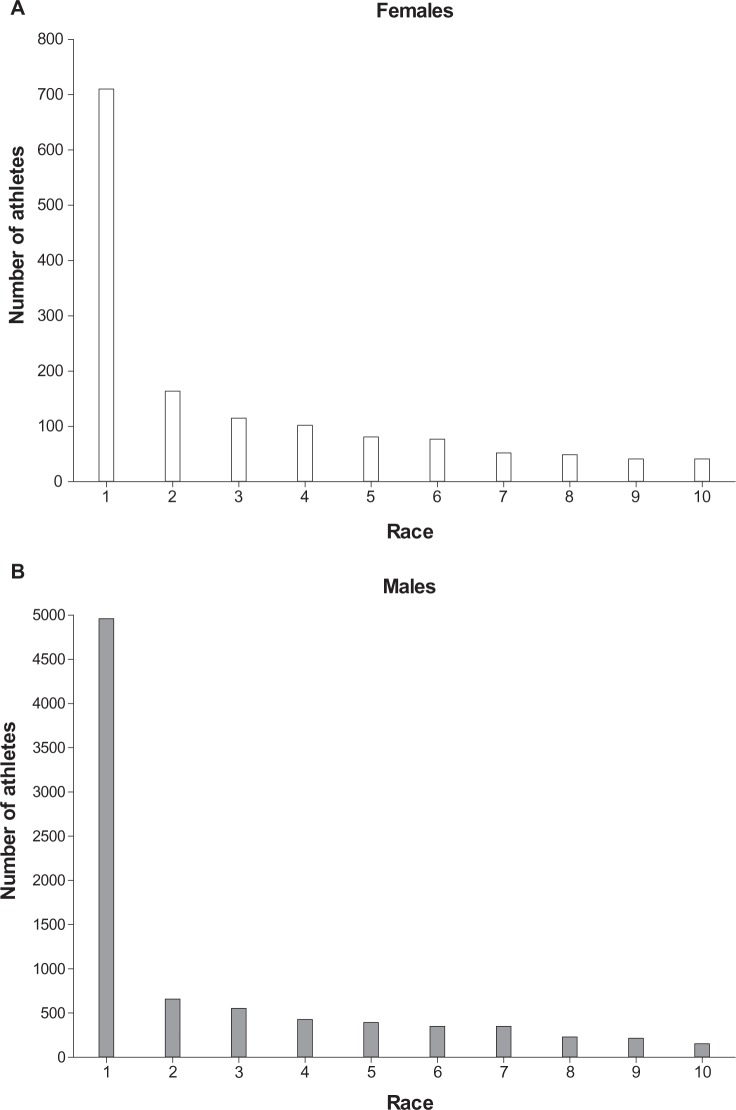
In 1992, the first multistage ultramarathons were held in Austria, Switzerland, and the US (Table 1). Until 2010, a high number of multistage ultramarathons took place all over the world, particularly in Europe. Multistage ultramarathons were held in 31 European countries. In France and Germany, a total of 33 races were held. However, most of the athletes (6624 finishers) participated in races held in Africa, followed by races held in Europe (5059 finishers). Considering the countries, the highest number of finishers competed in Morocco (6480 finishers), Germany (2538 finishers), and France (1842 finishers, Table 1). Most of the finishers started in the Marathon des Sables in Morocco, in the Transalpine Run from Austria to Italy, and in the La Trans Aquitaine held in France (Figure 4).
Table 1.
All continents and countries where multistage ultramarathons were organized and the years in which at least one race was organized in each country
| 1992 | 1993 | 1994 | 1995 | 1996 | 1997 | 1998 | 1999 | 2000 | 2001 | 2002 | 2003 | 2004 | 2005 | 2006 | 2007 | 2008 | 2009 | 2010 | Number of finishers | ||
|---|---|---|---|---|---|---|---|---|---|---|---|---|---|---|---|---|---|---|---|---|---|
| AF | MAR | 633 | 553 | 731 | 585 | 727 | 747 | 770 | 923 | 5,669 | |||||||||||
| EGY | 84 | 54 | 51 | 143 | 95 | 117 | 544 | ||||||||||||||
| NAM | 168 | 46 | 214 | ||||||||||||||||||
| RSA | 26 | 20 | 14 | 70 | 67 | 197 | |||||||||||||||
| AS | CHN | 157 | 147 | 124 | 428 | ||||||||||||||||
| OMA | 16 | 22 | 31 | 69 | |||||||||||||||||
| NEP | 25 | 25 | |||||||||||||||||||
| AU | AUS | 117 | 117 | ||||||||||||||||||
| EU | GER | 12 | 36 | 33 | 40 | 67 | 80 | 110 | 78 | 484 | 87 | 622 | 1,649 | ||||||||
| FRA | 20 | 14 | 7 | 74 | 245 | 240 | 218 | 247 | 247 | 1,312 | |||||||||||
| AUT | 32 | 32 | 54 | 51 | 98 | 90 | 86 | 70 | 60 | 573 | |||||||||||
| HUN | 6 | 65 | 123 | 150 | 344 | ||||||||||||||||
| SUI | 70 | 61 | 31 | 62 | 40 | 264 | |||||||||||||||
| NOR | 38 | 42 | 59 | 59 | 198 | ||||||||||||||||
| ESP | 34 | 99 | 133 | ||||||||||||||||||
| ITA | 54 | 72 | 126 | ||||||||||||||||||
| CZE | 17 | 11 | 25 | 16 | 21 | 13 | 103 | ||||||||||||||
| EU | 21 | 45 | 66 | ||||||||||||||||||
| SWE | 5 | 2 | 17 | 16 | 15 | 11 | 66 | ||||||||||||||
| BEL | 45 | 18 | 63 | ||||||||||||||||||
| GBR | 45 | 15 | 60 | ||||||||||||||||||
| NED | 5 | 5 | 5 | 1 | 1 | 1 | 2 | 5 | 4 | 7 | 9 | 45 | |||||||||
| SLO | 9 | 31 | 40 | ||||||||||||||||||
| SVK | 17 | 17 | |||||||||||||||||||
| NA | USA | 30 | 22 | 23 | 26 | 36 | 29 | 166 | |||||||||||||
| AM | 13 | 6 | 5 | 10 | 8 | 6 | 48 | ||||||||||||||
| CAN | 21 | 16 | 37 | ||||||||||||||||||
| SA | CHI | 57 | 109 | 57 | 63 | 67 | 122 | 475 | |||||||||||||
| ARG | 15 | 12 | 40 | 53 | 120 | ||||||||||||||||
| BRA | 37 | 55 | 92 | ||||||||||||||||||
| 13,260 |
Notes: Data are sorted by the total number of participants per race-holding country from the top downwards. The host continents of races are listed in the left column.
Abbreviations: AF, Africa; AS, Asia; AU, Australia; EU, Europe; NA, North America; SA, South America. The host countries with their ISO Alpha-3 code are listed in the second column.37 EU, Trans Europa Lauf; AM, Run across America; MAR, Morocco; EGY, Egypt; NAM, Namibia; RSA, South Africa; CHN, China; OMA, Oman; NEP, Nepal; AUS, Australia; GER, Germany; FRA, France; AUT, Austria; HUN, Hungary; SUI, Switzerland; NOR, Norway; ESP, Spain; ITA, Italy; CZE, Czech Republic; SWE, Sweden; BEL, Belgium; GBR, Great Britain; NED, The Netherlands; SLO, Slovenia; TUR, Turkey; SVK, Slovakia; USA, United States; CAN, Canada; CHI, Chile; ARG, Argentina; BRA, Brazil.
Figure 4.
Multistage ultramarathons with the greatest numbers of finishers. 1, Marathon des Sables; 2, Transalpine Run; 3, La Trans Aquitaine; 4, Sahara Race Egypt; 5, Atacama Crossing; 6, Ötscher-Ultramarathon; 7, Gobi March China; 8, Balaton Szupermaraton; 9, Swiss Jura Marathon; 10, Isarrun.
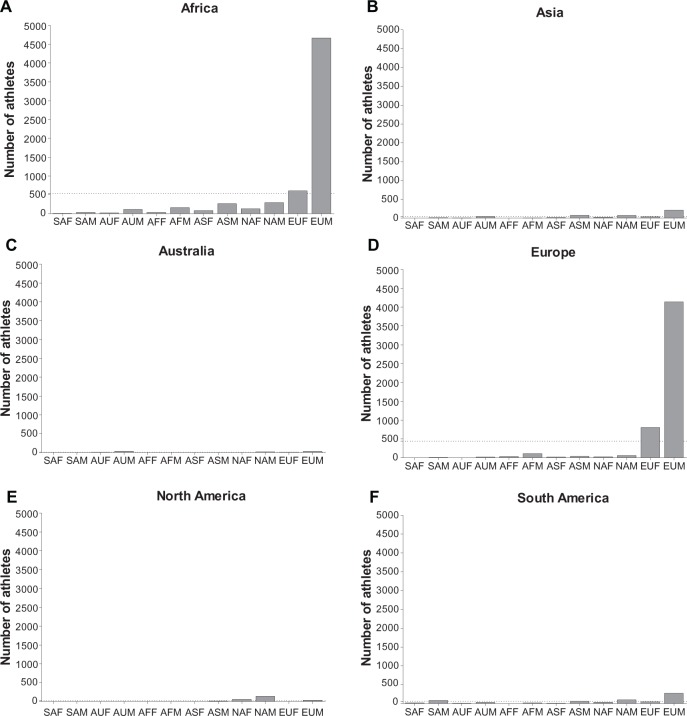
Male European runners participated mainly in multistage ultramarathon races held in Africa (5365 finishers) and in Europe (5835 finishers), but less in Asia (310 finishers) and South America (304 finishers, Figure 5). Female European runners dominated in Europe (1225 finishers), but less in Africa (722 finishers), Asia (61 finishers), South America (51 finishers), and Australia (seven finishers). In the Australian races, most males were Australian (37 finishers). In the US races, 189 men and 73 women finished.
Figure 5.
Number of participants per continent and their origin for (A) Africa, (B) Asia, (C) Australia, (D) Europe, (E) US, and (F) South America.
Note: The dotted line shows the mean number of finishers per continent.
Abbreviations: AF, Africa; AS, Asia; AU, Australia; EU, Europe; NA, North America; SA, South America; M, males; F, females.
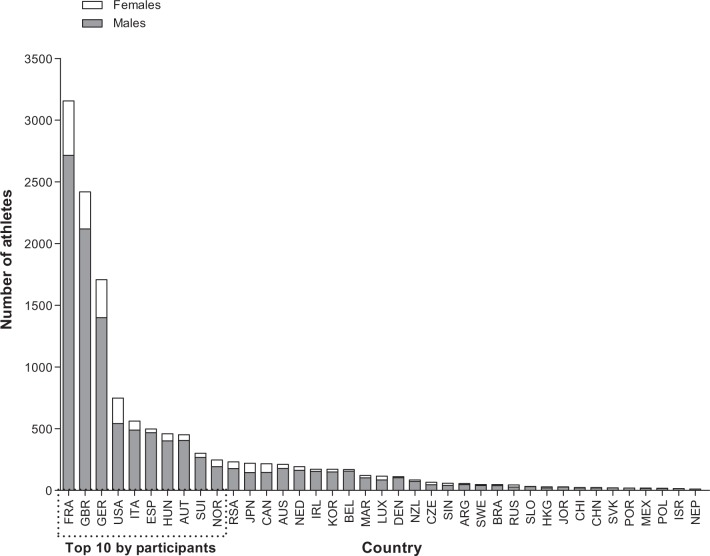
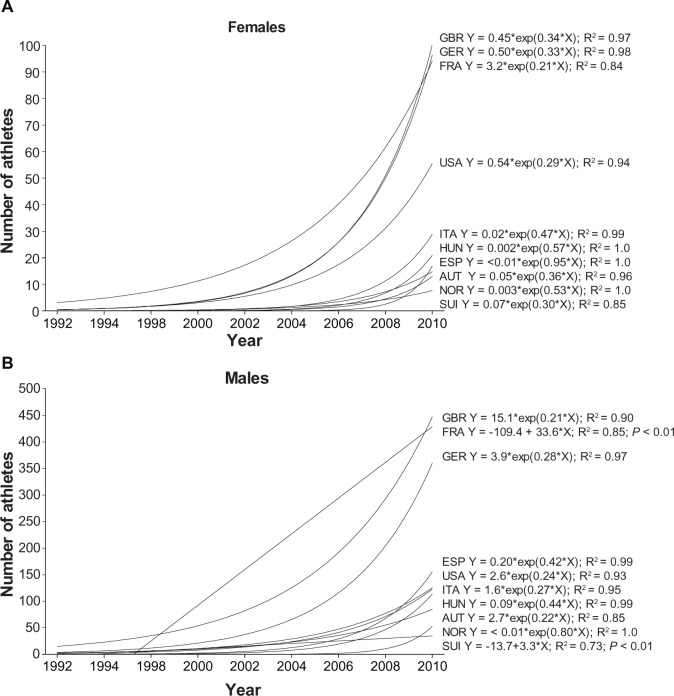
Figure 6 shows the total number of male and female finishers for all countries with at least ten finishers. Most of the finishers were French (3156 finishers), followed by British athletes (2419 finishers), Germans (1707 finishers), and athletes from the US, Italy, Spain, Hungary, Austria, Switzerland, and Norway. For the ten countries with the highest number of finishers, a significant increase in female and male representation was found. For female runners from Great Britain, Germany, France, the US, Italy, Hungary, Spain, Austria, Norway, and Switzerland, the rate of finishers increased exponentially (Figure 7A). For men, the number of finishers from Great Britain, Germany, Spain, the US, Italy, Hungary, and Norway also increased exponentially, and linearly for French and Swiss finishers (Figure 7B).
Figure 6.
Number of male and female finishers in multistage ultramarathons between 1992 and 2010 sorted for all countries with at least 10 finishers. The dotted line indicates the ten countries with the highest number of finishers.
Abbreviations: FRA, France; GBR, Great Britain; GER, Germany; USA, United States; ITA, Italy; ESP, Spain; HUN, Hungary; AUT, Austria; SUI, Switzerland; NOR, Norway; RSA, South Africa; JPN, Japan; CAN, Canada; AUS, Australia; NED, Netherlands; IRL, Ireland; KOR, Korea; BEL, Belgium; MAR, Morocco; LUX, Luxemburg; DEN, Denmark; NZL, New Zealand; CZE, Czech Republic; SIN, Singapore; ARG, Argentina; SWE, Sweden; BRA, Brazil; RUS, Russia; SLO, Slovenia; HKG, Hong Kong; JOR, Jordania; CHI, Chile; CHN, China; SVK, Slovakia; POR, Portugal; MEX, Mexico; POL, Poland; ISR, Israel; NEP, Nepal.
Figure 7.
Change in the number of (A) female and male (B) finishers in multistage ultramarathons between 1992 and 2010 sorted per country for the ten countries with the highest number of finishers.
Abbreviations: FRA, France; GBR, Great Britain; GER, Germany; USA United States; ITA, Italy; ESP, Spain; HUN, Hungary; AUT, Austria; SUI, Switzerland; NOR, Norway.
Discussion
This study aimed to identify the countries in which multistage ultramarathons were held, along with completion trends, with a specific emphasis on the nationalities of the finishers during the last two decades. The most important findings were that most races were held in Germany and France, but most athletes completed the Marathon des Sables and most of the finishers originated from France.
Race venues
Three multistage ultramarathons were held in 1992. One was the Run across America and the others were held in Switzerland and Austria. Until 2010, a good number of multistage ultramarathons took place all over the world, with these races being held mainly in Germany and France. Most athletes finished races held in Africa followed by races held in Europe. In Morocco, the most popular multistage ultramarathon in the world, known as the Marathon des Sables, takes place, where approximately 1000 athletes each year complete a distance varying from 200 km to 250 km within four or six stages.33 This is the reason why so many multistage ultramarathoners were racing in Africa and especially in Morocco.
Origin of the athletes
The most interesting finding was that European athletes dominated the multistage ultramarathons. During the 19-year study period, more than 80% of ultramarathoners originated from Europe. The second most represented continent was the US, but with only 7% of runners. European women and men dominated multistage ultramarathons in Africa, Asia, Europe, and South America. The most represented finishers originated from France (22.9%), Great Britain (18.0%), and Germany (13.4%).
Previous studies have investigated the nationalities of runners completing distances ranging from 800 m to marathon distance, and have reported a dominance of East Africans for decades.20–26 To explain the dominance of Europeans in multistage ultramarathons, we need to consider their prerequisites for participation. First, there is the entry fee for the Marathons des Sable which is about 3250 Euros. In addition to this, expenses for travelling to the venue should be taken into account. Using gross domestic product per capita, we can estimate the financial situation of the average person in a given country.34 It has also been suggested that athletes need to have the good health and living standards included in the human development index.35 Almost 20 European countries are in the top 30 according to gross domestic product per capita and human development index. Consequently, European athletes are likely to be more able to meet the expenses needed for these races and enjoy better health and living standards than those living in other countries. However, this consideration could not explain the difference in participation between Japanese and French or British athletes. Japan has a greater gross domestic product per capita, human development index, and population than France or Great Britain, but relatively few athletes from Japan have participated in multistage ultramarathons. The finding that most of the races were held in Europe and Africa far from Japan might explain the absence of Japanese runners in multistage ultramarathons. Differences in recreational interests in various parts of the world may also contribute to the lower participation rates of Japanese compared with French or British athletes.
Most runners originated from France, followed by Great Britain and then Germany. A reason why French and British athletes were more represented than German ultramarathoners could be the high participation of French and British runners in the Marathon des Sables in Morocco. Of the 6480 athletes who participated in this race, 1951 (34.4%) athletes were French, 1642 (28.9%) originated from Great Britain, but only 210 (3.7%) originated from Germany. The greater French participation in the Marathon des Sable can be explained with the shared language and the good relationship between the two countries, given that France is the most important trading partner for Morocco.36 Also, Europeans may perform better in this event due to the mountainous terrain which is similar to that in their countries of origin.
Changes in participation since 1992
Another interesting finding was the exponential increase in the number of male and female finishers. More specifically, the number of athletes originating from the ten most represented countries increased significantly, with the highest rates seen in male and female runners from France. Previous studies have already reported an increase in the popularity of ultraendurance events such as 161 km ultramarathons2 and the Double and Triple Ironman triathlons.5 Hoffman et al suggested that the factors responsible were the increase in athletes over 40 years of age, increased participation of women, and an increased number of races completed by individual participants.2
Female multistage ultramarathoners represented 16.4% of the total field. Previous studies have reported the percentage of women in the Hawaii Ironman (27%) where athletes have to finish within 17 hours,3,4 in 161 km ultramarathons (20%)2 which used to last less than 2 days, and in ultratriathlons (8%–10%)5 where races from Double Iron Deca Iron ultratriathlon distances were included. In those studies, a decrease in the proportion of female participants was observed with increasing duration of ultraendurance performance. The present study confirms this observation in multistage ultramarathons.
Conclusion
Between 1992 and 2010, 13,260 athletes completed multistage ultramarathons, mostly in Morocco. European runners dominated multistage ultramarathon participation throughout the world, and French runners were the most represented. Participation in multistage ultramarathons increased, more for men than for women representing 16.4% of the total field. Further studies should investigate whether European athletes dominate worldwide participation in other ultraendurance events, such the Ironman triathlon. Additional research should investigate performance trends in multistage ultramarathons to see whether European dominance in participation applies also to dominance in performance. The participation and performance trends of participants in the Marathon des Sables will be investigated in further detail.
Footnotes
Disclosure
The authors report no conflicts of interest in this work.
References
- 1.Hoffman MD, Wegelin JA. The Western States 100-mile endurance run: participation and performance trends. Med Sci Sports Exerc. 2009;4:2191–2198. doi: 10.1249/MSS.0b013e3181a8d553. [DOI] [PMC free article] [PubMed] [Google Scholar]
- 2.Hoffman MD, Ong JC, Wang G. Historical analysis of participation in 161 km ultramarathons in North America. Int J Hist Sport. 2010;2:1877–1891. doi: 10.1080/09523367.2010.494385. [DOI] [PubMed] [Google Scholar]
- 3.Lepers R. Analysis of Hawaii Ironman performance in elite triathletes from 1981 to 2007. Med Sci Sports Exerc. 2008;4:1828–1834. doi: 10.1249/MSS.0b013e31817e91a4. [DOI] [PubMed] [Google Scholar]
- 4.Lepers R, Maffiuletti NA. Age and gender interactions in ultraendurance performance: insight from the triathlon. Med Sci Sports Exerc. 2011;4:134–139. doi: 10.1249/MSS.0b013e3181e57997. [DOI] [PubMed] [Google Scholar]
- 5.Knechtle B, Knechtle P, Lepers R. Participation and performance trends in ultratriathlons from 1985 to 2009. Scand J Med Sci Sports. 2011;21:e82–e90. doi: 10.1111/j.1600-0838.2010.01160.x. [DOI] [PubMed] [Google Scholar]
- 6.Knechtle B, Knechtle P, Rosemann T, Senn O. Personal best time, not anthropometry or training volume, is associated with total race time in a Triple Iron triathlon. J Strength Cond Res. 2011;25:1142–1150. doi: 10.1519/JSC.0b013e3181d09f0f. [DOI] [PubMed] [Google Scholar]
- 7.Rüst CA, Knechtle B, Knechtle P, Rosemann T, Lepers R. Participation and performance trends in Triple Iron ultratriathlon – a cross-sectional and longitudinal data analysis. Asian J Sports Med. 2012;3:145–152. doi: 10.5812/asjsm.34605. [DOI] [PMC free article] [PubMed] [Google Scholar]
- 8.Zaryski C, Smith DJ. Training principles and issues for ultra-endurance athletes. Curr Sports Med Rep. 2005;4:165–170. doi: 10.1097/01.csmr.0000306201.49315.73. [DOI] [PubMed] [Google Scholar]
- 9.Jeukendrup AE, Martin J. Improving cycling performance: how should we spend our time and money. Sports Med. 2001;31:559–569. doi: 10.2165/00007256-200131070-00009. [DOI] [PubMed] [Google Scholar]
- 10.Knechtle B, Kohler G. Running 338 kilometres within five days has no effect on body mass and body fat but reduces skeletal muscle mass – the Isarrun 2006. J Sports Sci Med. 2007;6:401–407. [PMC free article] [PubMed] [Google Scholar]
- 11.Hulton AT, Lahart I, Williams KL, et al. Energy expenditure in the Race Across America (RAAM) Int J Sports Med. 2010;31:463–467. doi: 10.1055/s-0030-1251992. [DOI] [PubMed] [Google Scholar]
- 12.Babbit B. 25 years of the Ironman Triathlon World Championship. Oxford, UK; Meyer and Meyer; 2004. [Google Scholar]
- 13.Rüst CA, Knechtle B, Knechtle P, Onywera V, Rosemann T, Lepers R. European athletes dominate Double Iron ultratriathlons – a retrospective data analysis from 1985 to 2010. Eur J Sports Sci. 2012 doi: 10.1080/17461391.2011.641033. [DOI] [PubMed] [Google Scholar]
- 14.Sigg K, Knechtle B, Rüst CA, Knechtle P, Rosemann T, Lepers R. Central European athletes dominate Double Iron ultratriathlon – analysis of participation and performance from 1985 to 2011. Open Access J Sports Med. 2012;3:159–168. doi: 10.2147/OAJSM.S37001. [DOI] [PMC free article] [PubMed] [Google Scholar]
- 15.Jeffery S, Knechtle B, Rüst CA, Knechtle P, Lepers R, Rosemann T. European dominance in Triple Iron ultratriathlons from 1988 to 2011. J Sci Cycling. 2012;1:30–38. [Google Scholar]
- 16.Lenherr R, Knechtle B, Rüst CA, Rosemann T, Lepers R. From Double Iron to Double Deca Iron ultratriathlon – a retrospective data analysis from 1985 to 2011. Phys Cult Sport Stud Res. 2012;54:55–67. [Google Scholar]
- 17.Lepers R, Knechtle B, Knechtle P, Rosemann T. Analysis of ultratriathlon performances. Open Access J Sports Med. 2011;2:131–136. doi: 10.2147/OAJSM.S22956. [DOI] [PMC free article] [PubMed] [Google Scholar]
- 18.Jürgens D, Knechtle B, Rüst CA, Knechtle P, Rosemann T, Lepers R. An analysis of participation and performance by nationality at ‘Ironman Switzerland’ from 1995 to 2011. J Sci Cycling. Available from: http://www.jsc-journal.com/ojs/index.php?journal. [Google Scholar]
- 19.Rüst CA, Knechtle B, Knechtle P, Rosemann T, Lepers R.The aspect of nationality in participation and performance at the ‘Powerman Duathlon World Championship’ - The ‘Powerman Zofingen’ from 2002 to 2011 J Sci Cycling Available from: http://www.jsc-journal.com/ojs/index.php?journal=JSC&page=article&op=view&path[]=13Accessed November 29, 2012 [Google Scholar]
- 20.Onywera VO, Scott RA, Boit MK, Pitsiladis YP. Demographic characteristics of elite Kenyan endurance runners. J Sports Sci. 2006;24:415–422. doi: 10.1080/02640410500189033. [DOI] [PubMed] [Google Scholar]
- 21.Onywera VO. East African runners: their genetics, lifestyle and athletic prowess. Med Sport Sci. 2009;54:102–109. doi: 10.1159/000235699. [DOI] [PubMed] [Google Scholar]
- 22.Scott RA, Georgiades E, Wilson RH, Goodwin WH, Wolde B, Pitsiladis YP. Demographic characteristics of elite Ethiopian endurance runners. Med Sci Sports Exerc. 2003;35:1727–1732. doi: 10.1249/01.MSS.0000089335.85254.89. [DOI] [PubMed] [Google Scholar]
- 24.Scott RA, Pitsiladis YP. Genotypes and distance running: clues from Africa. Sports Med. 2007;37:424–427. doi: 10.2165/00007256-200737040-00039. [DOI] [PubMed] [Google Scholar]
- 25.Hamilton B. East African running dominance: What is behind it? Br J Sports Med. 2007;34:391–394. doi: 10.1136/bjsm.34.5.391. [DOI] [PMC free article] [PubMed] [Google Scholar]
- 26.Lucia A, Esteve-Lanao J, Oliván J, et al. Physiological characteristics of the best Eritrean runners-exceptional running economy. Appl Physiol Nutr Metab. 2006;31:530–540. doi: 10.1139/h06-029. [DOI] [PubMed] [Google Scholar]
- 27.Knechtle B, Salas Fraire O, Andonie JL, Kohler G. Effect of a multistage ultra-endurance triathlon on body composition: World Challenge Deca Iron Triathlon 2006. Br J Sports Med. 2008;42:121–125. doi: 10.1136/bjsm.2007.038034. [DOI] [PubMed] [Google Scholar]
- 28.Knechtle B, Duff B, Schulze I, Rosemann T, Senn O. Anthropometry and pre-race experience of finishers and nonfinishers in a multistage ultra-endurance run – Deutschlandlauf 2007. Percept Mot Skills. 2009;109:105–118. doi: 10.2466/PMS.109.1.105-118. [DOI] [PubMed] [Google Scholar]
- 29.Zouhal H, Groussard C, Vincent S, et al. Athletic performance and weight changes during the ‘Marathon of Sands’ in athletes well-trained in endurance. Int J Sports Med. 2009;30:516–521. doi: 10.1055/s-0029-1202350. [DOI] [PubMed] [Google Scholar]
- 30.Knechtle B, Knechtle P, Schulze I, Kohler G. Vitamins, minerals and race performance in ultra-endurance runners – Deutschlandlauf 2006. Asia Pac J Clin Nutr. 2008;17:194–198. [PubMed] [Google Scholar]
- 31.Rehrer NJ, Hellemans IJ, Rolleston AK, Rush E, Miller BF. Energy intake and expenditure during a 6-day cycling stage race. Scand J Med Sci Sports. 2010;20:609–618. doi: 10.1111/j.1600-0838.2009.00974.x. [DOI] [PubMed] [Google Scholar]
- 32.Deutsche Ultramarathon Vereinigung Available from: http://www.ultra-marathon.orgAccessed November 27, 2012German
- 33.Marathon des Sables Available from: http://www.darbaroud.comAccessed November 27, 2012French
- 34.International Monetary Fund Available from: http://www.imf.org/external/country/index.htmAccessed November 27, 2012
- 35.Human Development Index Available from: http://hdr.undp.org/en/countries/Accessed November 27, 2012
- 36.France Diplomatie Available from: http://www.diplomatie.gouv.fr/fr/pays-zones-geo/maroc/Accessed November 27, 2012French
- 37.ISO Alpha-3 code Available from: http://unstats.un.org/unsd/methods/m49/m49alpha.htmAccessed November 27, 2012


