Abstract
A Kalman/map filtering (KMF)-aided fast normalized cross correlation (FNCC)-based Wi-Fi fingerprinting location sensing system is proposed in this paper. Compared with conventional neighbor selection algorithms that calculate localization results with received signal strength (RSS) mean samples, the proposed FNCC algorithm makes use of all the on-line RSS samples and reference point RSS variations to achieve higher fingerprinting accuracy. The FNCC computes efficiently while maintaining the same accuracy as the basic normalized cross correlation. Additionally, a KMF is also proposed to process fingerprinting localization results. It employs a new map matching algorithm to nonlinearize the linear location prediction process of Kalman filtering (KF) that takes advantage of spatial proximities of consecutive localization results. With a calibration model integrated into an indoor map, the map matching algorithm corrects unreasonable prediction locations of the KF according to the building interior structure. Thus, more accurate prediction locations are obtained. Using these locations, the KMF considerably improves fingerprinting algorithm performance. Experimental results demonstrate that the FNCC algorithm with reduced computational complexity outperforms other neighbor selection algorithms and the KMF effectively improves location sensing accuracy by using indoor map information and spatial proximities of consecutive localization results.
Keywords: indoor location sensing, Wi-Fi fingerprinting, fast normalized cross correlation, map matching, Kalman/map filtering
1. Introduction
As the development and integration of mobile computing and sensing technologies, ubiquitous computing integrates the physical world and information space and offers widely available computing and information services [1]. In ubiquitous computing, location-sensing computing is becoming increasingly important due to most services are location-based services (LBSs) [2], such as vehicular and asset management, emergency rescue, pedestrian navigation, and proximity marketing. These services are relative to mobile terminal locations. Outdoor users can obtain accurate location information through satellite localization systems [3], but satellite localization system performance is limited in indoor environments owing to signal attenuation and complex radio propagation. Cellular localization also cannot achieve the needed accuracy for indoor LBSs [4]. In this light, numerous indoor location sensing systems have been developed by employing different technologies, such as Bluetooth [5], infrared [6], radio-frequency identification [7], ultra wideband [8], ultrasound [9], and Wi-Fi received signal strength (RSS) [10,11]. Currently, Wi-Fi RSS fingerprinting location sensing is specially preferred and extensively researched because RSS samples are easily sensed and collected by commonly used Wi-Fi mobile terminals from pervasively deployed access points (APs) without additional hardware being required [12].
The RSS fingerprinting method exploits a nonlinear mapping relationship between physical locations and RSS samples from multiple APs. In the off-line phase of the fingerprinting method, specific locations called reference points (RPs) are labeled and RSS samples collected at these RPs are recorded in a database called radiomap. In the on-line phase, on-line RSS data are collected by a Wi-Fi mobile terminal and matched with the RSS data in the radiomap to estimate localization results [13]. So far, many algorithms have been used for RSS fingerprinting. These fingerprinting algorithms are mainly classified as: machine learning and neighbor selection algorithms [14]. The machine learning algorithms, such as artificial neural network (ANN) [15], adaptive neural-fuzzy inference system (ANFIS) [16] and support vector machine (SVM) [17], need an off-line training to model the nonlinear mapping relationship between RSS data and RP location coordinates. Localization coordinates are estimated by the trained nonlinear mapping function with on-line RSS mean samples. Nearest neighbor, K nearest neighbors (KNN) and weighted KNN (WKNN) algorithms are conventional neighbor selection algorithms [11,14]. They select RPs according to RSS distances between the on-line RSS mean sample and RSS mean samples of all the RPs and then estimate localization coordinates with the selected RP coordinates.
However, using the existing fingerprinting algorithms, multiple on-line RSS samples collected at one location are averaged to compute an RSS mean sample, so useful on-line RSS information is lost in the RSS mean computation. These fingerprinting algorithms fail to make full use of all the on-line RSS information [11, 15–17]. Additionally, some other available information can also be employed for location-sensing computing, like RSS variations of RPs, indoor map information and spatial proximities of consecutive localization results.
Thus, to take advantage of all this information for accuracy improvement, the contributions of this paper are summarized as follows:
First, a fast normalized cross correlation (FNCC) fingerprinting algorithm is proposed to calculate localization coordinates with all the collected on-line RSS samples. It also regards RSS variations of RPs as weights for correlation coefficient computations to precisely select RPs. Compared with the basic normalized cross correlation (NCC) algorithm, which is computationally expensive, the proposed FNCC algorithm greatly reduces computational complexity while maintaining the same accuracy as the NCC, which is higher than those of conventional neighbor selection algorithms.
Second, indoor map information is used by a proposed map matching algorithm. A calibration model that represents pedestrian walkways is integrated into an indoor map. Then a map image matrix is created for the map matching algorithm. Based on the building interior structure, unreasonable location coordinates are corrected by the map matching algorithm to the calibration model and therefore more accurate location coordinates are obtained.
Third, based on the map matching algorithm, a Kalman/map filtering (KMF) is proposed to process fingerprinting results using indoor map information and spatial proximities of consecutive localization results. Through nonlinearizing the linear prediction process of Kalman filtering (KF) by the map matching algorithm, more accurate prediction locations are obtained for the KMF. This greatly improves the KMF performance of increasing location sensing accuracy.
The remainder of this paper is structured as follows: in Section 2, related work is discussed. The proposed FNCC fingerprinting algorithm, map matching algorithm and KMF are described in detail in Section 3. Section 4 gives the experimental setup, results and analyses. Finally, the paper is concluded in Section 5.
2. Related Work
To the best of our knowledge, NCC has not been applied as an RSS fingerprinting algorithm for location-sensing computing. However, Xiao et al. used correlation coefficients to quantify similarities between observed and stored channel state information to measure the distances between a mobile terminal and RPs [18]. Liu et al. computed spatial correlation between an RP and scanning points (SPs) in the same micro cell [19]. The measured RSS samples at the SPs were used to estimate the RSS data of the RP for a micro-cell radiomap construction.
In the area of image similarity measurements, NCC has been used extensively [20,21]. Because the basic NCC algorithm is time-consuming and is not suitable for time-critical applications, several fast NCC algorithms have been developed to improve computational efficiency. Lewis proposed a fast NCC algorithm based on a sum table approach [22]. But the sum table approach could only efficiently calculate the NCC denominator. It could not be directly applied to calculate the numerator. Yoo et al. proposed a fast NCC algorithm without using multiplication operations [23]. Under an assumption made for the fast algorithm, the simplified method saved computational complexity at the expense of degrading algorithm performance. When their proposed simplified method was applied to the NCC-based fingerprinting algorithm in this paper, it could not precisely measure similarities between on-line RSS data and RSS data in the radiomap. Wei et al. employed another improved NCC for image template matching [24]. The basic NCC equation was rewritten with the image mean substitution operations. The computational efficiency of the rewritten NCC was limitedly increased. Therefore, based on the RSS fingerprinting theory, the proposed FNCC fingerprinting algorithm is able to achieve the same high accuracy as the basic NCC algorithm with greatly reduced computational complexity.
Regarding the filtering algorithms for processing Wi-Fi fingerprinting results, particle filtering (PF) and KF are commonly used. As a linear filtering algorithm, KF processed the localization results of the ANN, nearest neighbor and propagation model [25–27] by using spatial proximities of consecutive localization results. But the KF linear state prediction is usually not accurate, which limits its performance. With measurement data from sensors, like electronic compasses, accelerometers or odometers, nonlinear PF improved localization results with the fused sensor data [28,29]. Moreover, indoor map information was also combined with PF-based location sensing systems to further improve system accuracy. Leppakoski et al. employed a PF to fuse Wi-Fi fingerprinting location estimates with pedestrian dead reckoning (PDR) sensor data and map information for pedestrian indoor navigation [30]. Their experimental results indicated that even the poor quality Wi-Fi fingerprinting location estimates still included useful information and fusing them with the sensor data and map information improved their system performance. Beauregard et al. developed a backtracking PF combined with wall information and PDR sensor data to correct the heading direction of a user [31]. With the wall information, particles tried to go across walls were abandoned. The previous state estimate was recalculated without these invalid particle trajectories, so a better estimate was produced. Ascher et al. proposed a map matching algorithm based on PF for 3D map matching [32]. Accurate height estimation from inertial measurement unit and barometer measurements was used for particle constraints to match the estimated trajectory to a multi-floor map.
However, PF-based algorithms are usually time-consuming, especially when the number of particles is considerable. Compared with the PF-based algorithms, the KF computes much faster. Because it works iteratively and just requires a prediction state and measurement data. Thus, through combining a presented map matching algorithm and the KF, a KMF is proposed in this paper. The KF linear prediction process is nonlinearized by the map matching algorithm. With the advantages of both the map matching algorithm and KF, the proposed KMF effectively improves location sensing accuracy with only Wi-Fi fingerprinting results as measurement data. Regarding the limited hardware resources and power of Wi-Fi mobile terminals, the KMF is suitable to be embedded into the Wi-Fi mobile terminals for practical applications.
3. Kalman/Map Filtering-Aided Fast Normalized Cross Correlation-Based Wi-Fi Fingerprinting Location Sensing
In Section 3.1, the proposed FNCC fingerprinting algorithm is described in detail. The FNCC not only makes full use of off-line and on-line RSS information, but also greatly reduces computational complexity, especially for calculating the NCC denominator, while maintaining high fingerprinting accuracy. A map matching algorithm is presented in Section 3.2. An indoor map is processed and converted into an image matrix with a calibration model for coordinate corrections. With the image matrix, the map matching algorithm can be used as an independent algorithm to correct unreasonable location coordinates. With the integration of the map matching algorithm into the KF, the proposed KMF algorithm is detailed in Section 3.3. The KMF effectively improves location sensing accuracy with indoor map information and spatial proximities of consecutive localization results. For convenience, key symbols used in this paper are listed in Table 1.
Table 1.
Key symbols used in this paper.
| Notations | Definition |
|---|---|
| L L | Number of labeled RPs |
| M | Number of deployed APs |
| N | Number of on-line RSS samples for computing one result |
| K | Number of selected RPs |
| rss | On-line RSS matrix for computing localization coordinates |
| RSSl | Created RSS matrix of l th RP |
| rl | Correlation coefficient between RSS matrices rss and RSSl |
| rssi,j | RSS numerical value in ith row and jth column of matrix rss |
| RSSi,j,l | RSS numerical value in ith row and jth column of matrix RSSl |
| Imatch | Image matrix for map matching |
3.1. Fast Normalized Cross Correlation-Based Fingerprinting Algorithm
NCC has been widely used for many image processing applications because of its abilities to cope with noisy images. In this paper, it is applied to measure the correlation degree between collected on-line RSS data and RSS data of an RP using a correlation coefficient, which ranges from −1 to 1. The correlation coefficient is equal to −1 in the case of a perfect negative correlation, 0 no correlation and 1 a perfect positive correlation [23]. The closer the correlation coefficient approaches to −1 or 1, the stronger the correlation degree between the two RSS data sets. Compared with existing fingerprinting algorithms that calculate localization results with RSS mean samples, the NCC-based fingerprinting algorithm takes advantage of all the available on-line RSS samples to avoid losing useful RSS information in the process of computing an RSS mean sample. In addition, the algorithm also integrates RSS variations of RPs into correlation computations. Thus, the RPs that have more similar RSS characteristics with the collected on-line RSS data can be precisely selected for location-sensing computing. However, the basic NCC algorithm is computationally expensive, so an FNCC fingerprinting algorithm is presented to reduce computational complexity and speed up correlation computations. The correlation coefficient rl of the basic NCC between the on-line RSS matrix rss and the RSS matrix RSSl of l th RP can be calculated by:
| (1) |
where parameters μrss and μl are the means of the RSS matrices rss and RSSl, respectively. They are computed by Equation (2) as follows:
| (2) |
After all these L correlation coefficients are obtained, they are sorted in descending order. The RPs that correspond to the first K maximum correlation coefficients are selected to compute localization coordinates through averaging the selected RP location coordinates, which is denoted by:
| (3) |
where loci is the coordinate vector of the selected RP i, {MAX_K(r1,…, rL)} is the set of the first K maximum correlation coefficients and (x̄,ȳ) are the localization coordinates.
For computing one localization result, the L correlation coefficients are calculated with the same on-line RSS matrix, so the term in Equation (1) that is only relative to the on-line RSS matrix can be regarded as a constant. Without changing the order of the L correlation coefficients, Equation (1) can be simplified as:
| (4) |
As we know, it is much faster for a computer to execute a multiplication operation than to execute a square root operation, so Equation (4) is squared to substitute the square root operation in denominator with a multiplication operation in numerator. The squared correlation coefficient is computed by:
| (5) |
Compared with the basic NCC computation denoted by Equation (1), Equation (5) saves N × M − 1 addition/subtraction operations, N × M multiplication/division operations and 2 square root operations for computing one correlation coefficient. When the means μrss and μl in Equation (5) are substituted with Equation (2), the squared correlation coefficient is also calculated by:
| (6) |
For calculating one squared correlation coefficient , Equation (6) executes 2 × N × M − 2 less addition/subtraction operations and 2 more multiplication/division operations than Equation (5). Usually, Equation (6) computes faster than Equation (5), especially under conditions when the numbers of deployed APs M and collected on-line RSS samples N are considerable.
3.2. Indoor Map Matching for Coordinate Corrections
To improve location sensing performance, an indoor map integrated with a calibration model is processed for the proposed map matching algorithm. The indoor map is derived from an indoor building plan of computer aided design (CAD) and the calibration model is comprised of straight lines that represent pedestrian walkways. According to the building interior structure, unreasonable localization results are corrected to the calibration model for accuracy improvement.
First, the original indoor map and the indoor map integrated with the calibration model are saved as two JPEG gray-scale images Gmodel and Gno_model, respectively. Using Equation (7), the two images are converted into two binary images Imodel and Ino_model, respectively. The size of the binary image matrices is proportionally adapted according to the size of the building plan.
| (7) |
where Tthreshold is the threshold.
In the two binary images Imodel and Ino_model, the pixel points of the calibration model and building structure are represented by 0 and the pixel points of people activity areas are represented by 1. To distinguish the calibration model from the building structure, a new image matrix Imatch is created by Equation (8). The new image matrix Imatch is directly used by the map matching algorithm.
| (8) |
where ⊕ is exclusive-or operation.
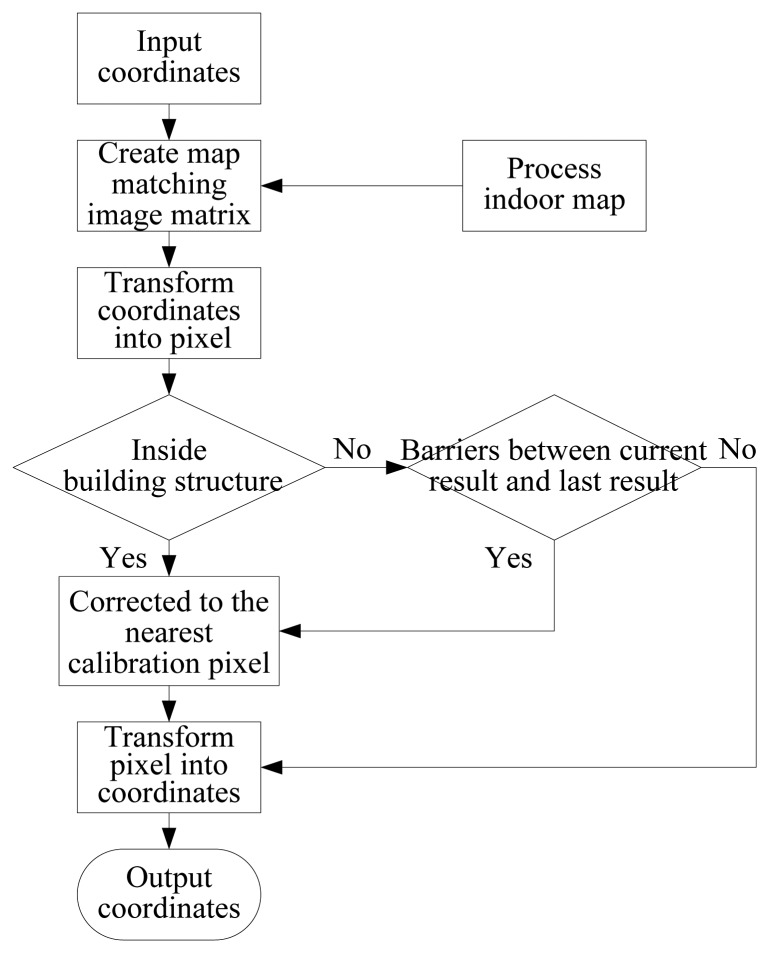
In the new image matrix Imatch, the pixel points of people activity areas and building structure are still represented by 1 and by 0, respectively, but the pixel points of calibration model are represented by −1. So the calibration model is recognized by −1 and unreasonable localization results can be corrected to the calibration model. The flow chart of the map matching algorithm is shown in Figure 1 and the algorithm can be generally divided into six steps as follows:
-
(1)
Process the available indoor map information and create accurate building plan image matrix Imatch for map matching.
-
(2)
Transform the n th localization coordinates Un = (xn,yn) into the corresponding pixel point in the building plan image matrix Imatch.
-
(3)
If , which means that the localization coordinates are located inside the building structure, then go to step 5, otherwise go to step 4.
-
(4)
If building structure barriers exist between the n th localization pixel point Sn and (n − 1)th localization pixel point , then go to step 5, otherwise go to step 6.
-
(5)
Calculate the pixel point that is the midpoint between Sn and Sn−1, search the nearest pixel point in the calibration model to the pixel point Smid and then regard the newly searched pixel point as the new localization pixel point .
-
(6)
Transform the localization pixel point into building plan coordinates and output the coordinates .
Figure 1.
Flow chart of map matching algorithm.
3.3. Kalman/Map Filtering for Wi-Fi Fingerprinting Location Sensing
In the area of Wi-Fi fingerprinting location sensing, KF has been applied to process localization results calculated by fingerprinting algorithms. The KF firstly predicts a user's movement state at the present time step by using the previous movement state. When a present measurement result that is a fingerprinting result is obtained, the measurement result is used to correct the predicted movement state. In this process, spatial proximities of consecutive localization results are employed by the KF. However, one drawback of the KF is its linear prediction model cannot precisely predict people movement in indoor environments, so the map matching algorithm is employed by the KMF to nonlinearize the linear prediction process.
The general KF linear process and measurement equations are as follows:
| (9) |
where Xn is the state vector, A is the state transition matrix, Zn is the measurement vector, H is the measurement design matrix, wn is the process noise, vn is the measurement noise, and Q and R are the noise covariance matrices.
The KF operates in two distinct phases: the time update and measurement update. In the time update phase, the new state vector and its uncertainty at the present time step are predicted, which is given by:
| (10) |
In the measurement update phase, the predicted vector is corrected and the KF parameters are updated for the next iteration when a measurement result is obtained. The process is denoted by:
| (11) |
where X̂n̄ is the a priori estimate of the process, X̂n is the a posteriori estimate of the process, Pn̄ is the covariance matrix of the a priori estimate, Pn is the covariance matrix of the a posteriori estimate, Kn is the Kalman gain, and I is the identity matrix.
The KF linear prediction denoted by Equation (10) causes considerable errors between the predicted locations and actual locations because people move randomly in indoor environments. To predict a user's location more precisely, the proposed map matching algorithm is integrated into the KF prediction process for the nonlinearity of the process. The map matching process for correcting location coordinates is described by a nonlinear function fmap(·) so the nonlinear relationship between the n th input coordinates Un= (xn,yn)and output coordinates of the map matching function is denoted by:
| (12) |
Setting the a priori estimate of the process X̂n̄ as follows:
| (13) |
where Vn̄ =(vx,vy)n¯ is the velocity vector, vx and vy are the velocities in X axis and Y axis, respectively. So after the prediction process is nonlinearized by the map matching algorithm, Equation (13) is changed to:
| (14) |
Subsequently, the formula for calculating the a posteriori estimate in Equation (11) is changed to:
| (15) |
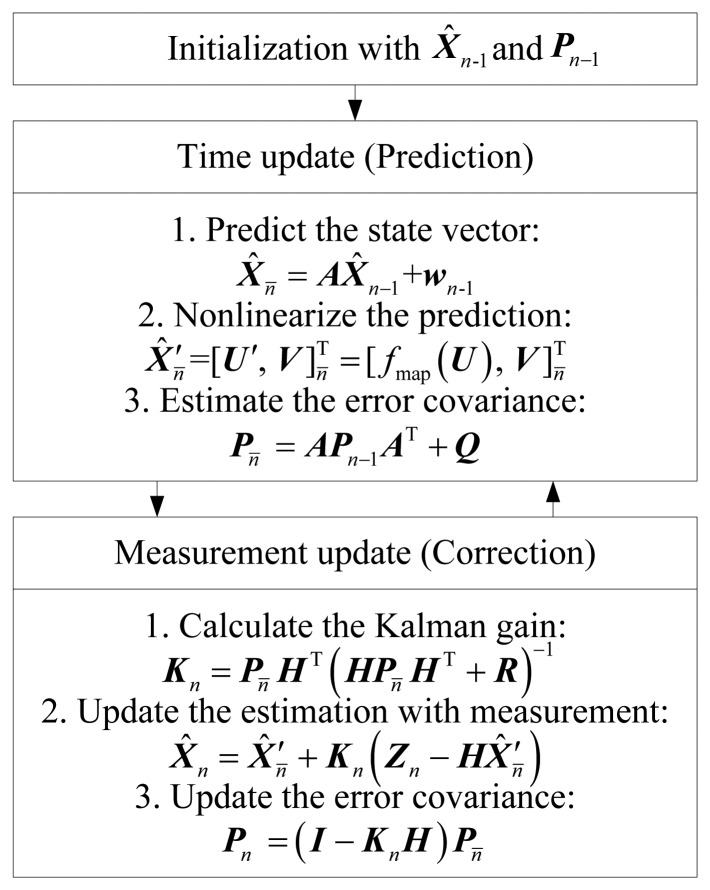
The diagram of the proposed KMF is shown in Figure 2 as follows.
Figure 2.
Diagram of Kalman/map filtering.
4. Experimental Results and Analyses
4.1. Experimental Setup
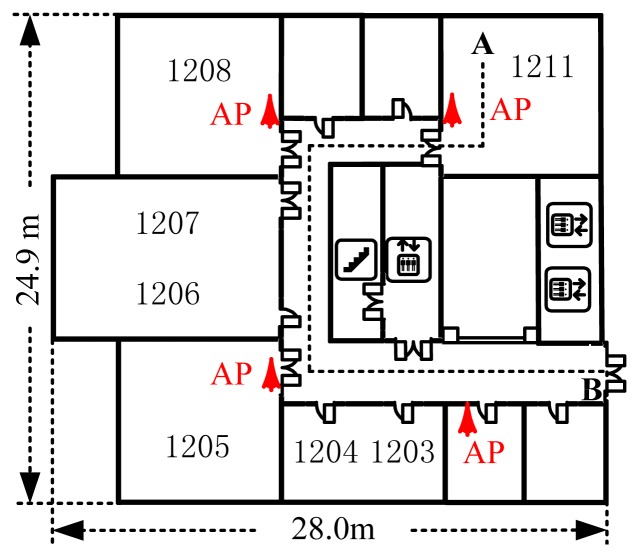
The experimental floor is a rectangular area of 24.9 m × 66.4 m. For communication purposes on the floor, nine Linksys WAP54G APs were deployed. As shown in Figure 3, only four of them were deployed in the 24.9 m × 28.0 m experimental area.
Figure 3.
Experimental area plan.
The experimental trajectory spanned Point A in Room 1211 to Point B in the 3 m width corridor. Installed a software named NetStumbler, an ASUS A8F laptop collected RSS samples with a sampling rate of two RSS samples per second. For establishing a radiomap, RSS samples were collected at 91 RPs in Room 1211 and the corridor and 300 RSS samples were recorded within 150 s at each RP. Along the experimental trajectory, a total of 6,500 RSS testing samples were collected at 65 testing points (TPs) with 0.6 m gaps.
4.2. Fast Normalized Cross Correlation-Based Fingerprinting Performance
4.2.1. Localization Results of Fast Normalized Cross Correlation-Based Fingerprinting Algorithm
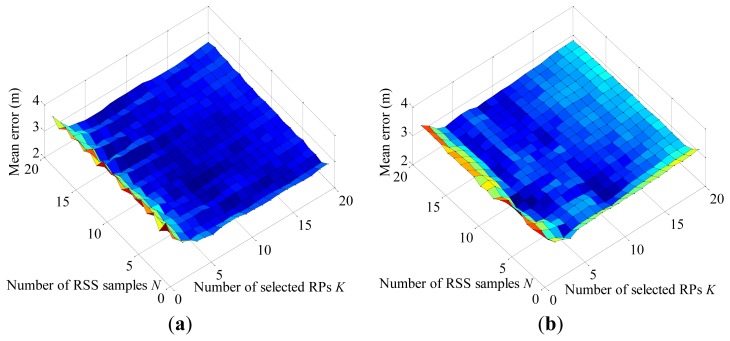
The performance of the FNCC algorithm is evaluated with the collected RSS testing data. For comparison, the mean errors of the FNCC and conventional KNN algorithms are calculated with the numbers of on-line RSS samples N and selected RPs K varying from 1 to 20, respectively. As shown in Figure 4, the FNCC algorithm outperforms the KNN algorithm. Compared with the KNN algorithm that computes RSS distances between RSS mean samples, the FNCC algorithm makes full use of the available RSS information through exploiting all the on-line RSS samples to avoid useful RSS information loss in RSS mean sample calculations and incorporating RSS variations of RPs in the radiomap denoted by the term into correlation calculations as weights. As parameter K increases, the FNCC algorithm performance is more stable than that of the KNN algorithm. When no information is available for setting parameter K, it is easier to set a proper parameter K for the FNCC algorithm to achieve a comparable accuracy.
Figure 4.
(a) Mean error surface of FNCC algorithm with parameters N and K varying from 1 to 20, respectively; (b) Mean error surface of KNN algorithm with parameters N and K varying from 1 to 20, respectively.
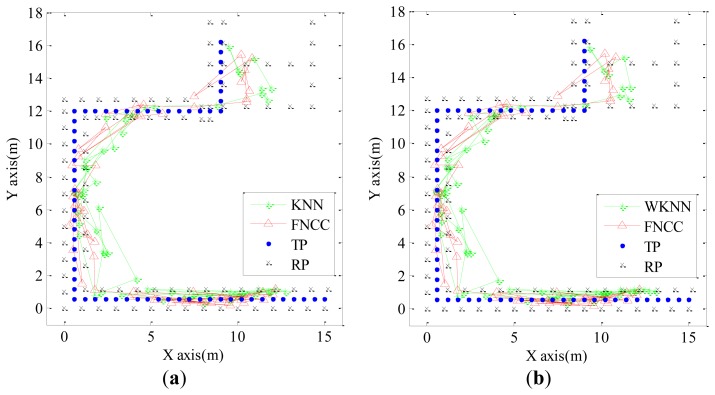
Considering the number and distribution of RPs as well as computational complexity, parameter N and parameter K are set equal to 2 and 7, respectively. To simulate the condition that a user moves at a speed of 0.6 m/s along the experimental trajectory, only two RSS testing samples were employed at each TP. The localization results calculated by the KNN, WKNN and FNCC algorithms are shown in Figure 5. The localization results calculated by the FNCC algorithm in Room 1211 and the corridor corners are more accurate than those calculated by the KNN and WKNN algorithms. In this experiment, the mean errors of the KNN, WKNN and FNCC algorithms are 3.00 m, 2.96 m and 2.71 m, respectively. With all these 6,500 RSS testing samples, the mean errors, standard deviations and cumulative probabilities of these fingerprinting algorithms are calculated and listed in Table 2. The FNCC algorithm performance is the same as that of the basic NCC algorithm, which is better than the KNN and WKNN algorithms. The experimental results confirm the advantages of the FNCC algorithm analyzed above and verify the effectiveness of the mathematical operations for simplifying the NCC.
Figure 5.
(a) Localization results of KNN and FNCC algorithms with parameters N and K are set equal to 2 and 7, respectively; (b) Localization results of WKNN and FNCC algorithms with parameters N and K are set equal to 2 and 7, respectively.
Table 2.
Performance comparison of KNN, WKNN, NCC, and FNCC algorithms.
| Algorithms | Mean Error (m) | Standard Deviation (m) | Cumulative Probability (%) | |
|---|---|---|---|---|
| Within 2 m | Within 3 m | |||
| KNN | 2.77 | 1.91 | 39.6 | 64.7 |
| WKNN | 2.74 | 1.91 | 41.2 | 65.4 |
| NCC with Equation (1) | 2.60 | 1.93 | 45.9 | 68.9 |
| FNCC with Equation (5) | 2.60 | 1.93 | 45.9 | 68.9 |
| FNCC with Equation (6) | 2.60 | 1.93 | 45.9 | 68.9 |
4.2.2. Computational Complexity of Fast Normalized Cross Correlation-Based Fingerprinting Algorithm
Regarding the on-line computational complexity, some terms in both the denominators and numerators of Equations (1), (5) and (6), like (rssi,j −μrss), (RSSi,j,l − μ1) and , just need to be calculated once for computing one correlation coefficient. Thus, for calculating one localization result, the computational complexities of these algorithms are quantified and listed in Table 3. As mentioned previously, numbers of labeled RPs L, deployed APs M, on-line RSS samples N, and selected RPs K are equal to 91, 9, 2, and 7, respectively, so the addition/subtraction operation numbers of the KNN, WKNN, NCC with Equation (1), FNCC with Equation (5), and FNCC with Equation (6) are 1,559, 1,571, 11,023, 9,476, and 6,382, respectively. The multiplication/division operation numbers of these algorithms are 821, 835, 5,280, 3,642, and 3,824, respectively, and the numbers of square root operations are 91, 91, 182, 0, and 0, respectively. Compared with NCC with Equation (1), FNCC with Equation (6) saves 4641 addition/subtraction operations, 1456 multiplication/division operations and 182 square root operations. The proposed simplified method effectively reduces the NCC computational complexity. Although addition/subtraction operations and multiplication/division operations of the FNCC with Equation (6) are about three times more than those of the KNN, the KNN needs to calculate 91 square root operations, which is much more complex than the other mathematical operations. Therefore, because of its high accuracy and low computational complexity, the proposed FNCC algorithm is suitable for practical applications.
Table 3.
Computational complexity comparison.
| Algorithms | Addition/Subtraction | Multiplication/Division | Square Root |
|---|---|---|---|
| KNN | L(2M−1) + 2K−2 | LM+ 2 | L |
| WKNN | L(2M−1) + 4K−24 | LM+2K + 2 | L |
| NCC with Equation (1) | L(7M−5) + 2K−2 | LM(3MN+4) +2 | L |
| FNCC with Equation (5) | L(6M−4)+ 2K−2 | LM(2MN+4) +2 | 0 |
| FNCC with Equation (6) | L(4MN−2) + 2K−2 | LM(2MN+6) +2 | 0 |
4.3. Kalman/Map Filtering Algorithm Performance for Accuracy Improvement
4.3.1. Map Matching Correction Results
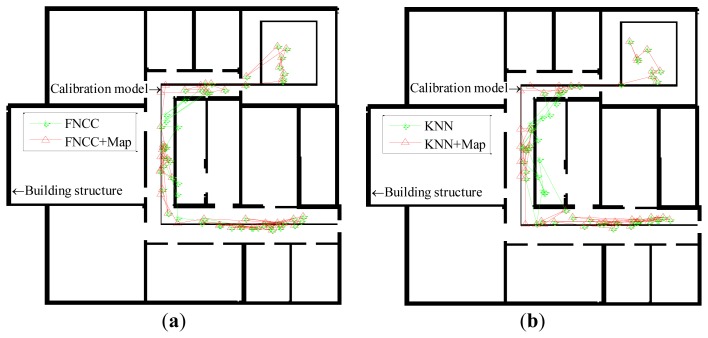
In this paper, the threshold Tthreshold for converting the gray-scale images into the binary images is set equal to 0.55. The same mobile user experiment shown in Figure 5 is used to verify the effectiveness of the map matching algorithm. The localization results of both the KNN and FNCC algorithms, their corrected results by the map matching algorithm, the building structure, and the calibration model are converted from image matrices and shown in Figure 6 below.
Figure 6.
(a) Localization results of FNCC algorithm and its corrected results after map matching converted from image matrix. (b) Localization results of KNN algorithm and its corrected results after map matching converted from image matrix.
Through map matching, the mean errors of the KNN and FNCC algorithms are reduced from 3.00 m and 2.71 m to 2.96 m and 2.59 m, respectively. With all the 6,500 RSS testing samples, the localization results of the KNN, WKNN and FNCC algorithms corrected by the map matching algorithm are listed in Table 4. The mean errors of the KNN, WKNN and FNCC algorithms are reduced to 2.62 m, 2.57 m and 2.39 m, respectively, and their standard deviations are reduced to 1.90 m, 1.89 m and 1.85 m, respectively. After the map matching corrections, the cumulative probabilities of all these algorithms increase. As shown in Table 2 in Section 4.2.1, the cumulative probability of the FNCC within 2 m and 3 m errors are 45.9% and 68.9%, respectively, which are still better than those of the KNN + Map that are 43.5% and 67.4%, respectively. The FNCC localization results corrected by the map matching algorithm are apparently more accurate than the results of the other algorithms. These experimental results indicate that the proposed map matching algorithm is effective to correct localization results with the indoor map.
Table 4.
Comparison of map matching results.
| Algorithms | Mean Error (m) | Standard Deviation (m) | Cumulative Probability (%) | |
|---|---|---|---|---|
| Within 2 m | Within 3 m | |||
| KNN + Map | 2.62 | 1.90 | 43.5 | 67.4 |
| WKNN + Map | 2.57 | 1.89 | 45.4 | 68.7 |
| FNCC + Map | 2.39 | 1.85 | 51.0 | 73.0 |
4.3.2. Results of Kalman/Map Filtering Algorithm
With the map matching algorithm, the KF linear prediction process is nonlinearized by the proposed KMF. Accurate prediction locations corrected by the map matching algorithm increase the accuracy of the KMF estimates after measurement corrections. Based on the KF theory, the proposed KMF process equation is set as follows:
| (16) |
where ax and ay are the accelerations in X axis and Y axis, respectively. They are set equal to 0.05 m/s2. wn ∼ N(0,Q) is the process noise and is computed by the wn.
The KMF measurement equation is given by:
| (17) |
where zx and zy are the measurement coordinates in X axis and Y axis, respectively. vn ∼ N(0,R) is the measurement noise and is set equal to according to the fingerprinting results.
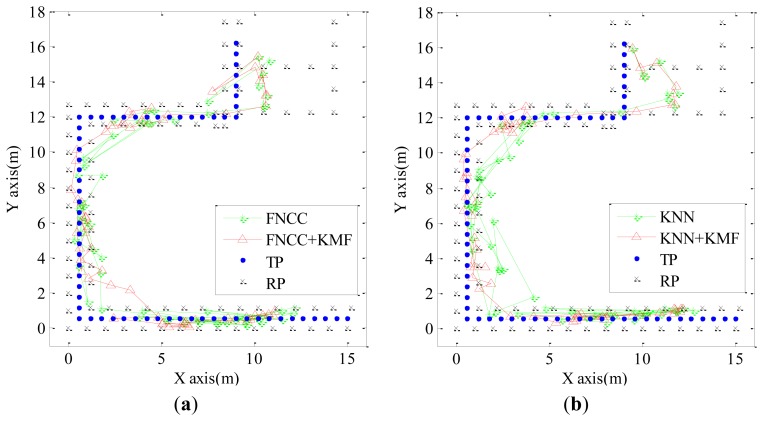
Figure 7 shows the experimental results of the KNN and FNCC mentioned in Section 4.2 and their processed results by the KMF. The processed results by the KMF are more consecutive and reasonable than those of the KNN and FNCC because they are corrected with the indoor map and spatial proximities of consecutive localization results. This illustrates that the KMF has the advantages of both the map matching algorithm and KF. Thus, the KMF outperforms each of the two algorithms. In the experiment shown by Figure 7, the mean errors of the FNCC + KMF and KNN + KMF are 1.59 m and 1.73 m, respectively, which is better than the map matching results mentioned in Section 4.3.1 and also better than the mean errors of the results processed by the KF that are 2.55 m and 2.83 m, respectively.
Figure 7.
(a) Localization results of FNCC and FNCC + KMF; (b) Localization results of KNN and KNN + KMF.
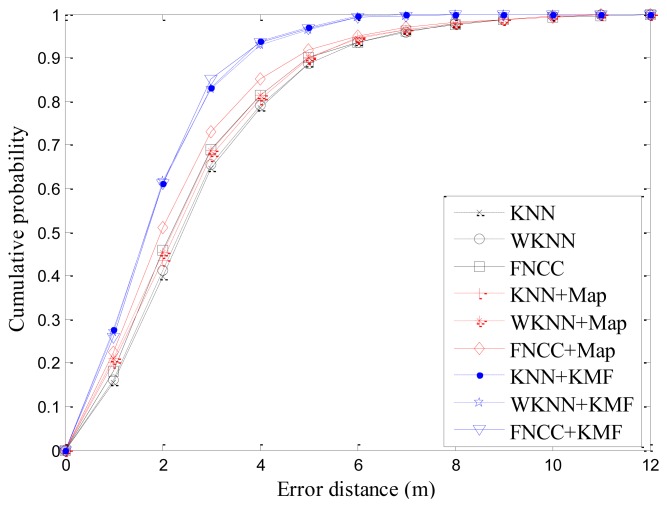
With all the 6,500 RSS testing samples, the mean errors of KNN + KF, WKNN + KF and FNCC + KF are 2.65 m, 2.65 m and 2.41 m, respectively. By comparison, the mean errors of the KNN + KMF, WKNN + KMF and FNCC + KMF are 1.88 m, 1.90 m and 1.87 m, respectively. Their standard deviations are 1.24 m, 1.27 m and 1.24 m, respectively. These results indicate that the KMF outperforms the KF. Combined with Table 2 in Section 4.2.1 and Table 4 in Section 4.3.1, the results of the KNN, WKNN, FNCC, and their processed results by the proposed map matching and KMF algorithms are listed in Table 5. With the proposed KMF algorithm, the mean errors of the KNN, WKNN and FNCC decrease 32.1%, 30.7% and 28.1%, respectively. The cumulative probability curves of all these algorithms are also shown in Figure 8. The cumulative probabilities of the localization results processed by the KMF are much higher than those of the other algorithms. Specifically, the cumulative probabilities of the FNCC + KMF within 2 m and 3 m errors reach 61.3% and 85.1%, respectively. These results demonstrate that the proposed KMF is remarkably effective to improve location sensing accuracy by making use of indoor map information and spatial proximities of consecutive localization results.
Table 5.
Comparison of KNN, WKNN, FNCC, and their processed results by map matching and KMF algorithms.
| Algorithms | Mean Error (m) | Standard Deviation (m) | Cumulative Probability (%) | |
|---|---|---|---|---|
| Within 2 m | Within 3 m | |||
| KNN | 2.77 | 1.91 | 39.6 | 64.7 |
| WKNN | 2.74 | 1.91 | 41.2 | 65.4 |
| FNCC | 2.60 | 1.93 | 45.9 | 68.9 |
| KNN + Map | 2.62 | 1.90 | 43.5 | 67.4 |
| WKNN + Map | 2.57 | 1.89 | 45.4 | 68.7 |
| FNCC + Map | 2.39 | 1.85 | 51.0 | 73.0 |
| KNN + KMF | 1.88 | 1.24 | 61.0 | 83.0 |
| WKNN + KMF | 1.90 | 1.27 | 61.6 | 83.0 |
| FNCC + KMF | 1.87 | 1.24 | 61.3 | 85.1 |
Figure 8.
Cumulative probabilities of various algorithms.
5. Conclusions
In this paper, a KMF-aided FNCC Wi-Fi fingerprinting indoor location sensing system is proposed. Because the NCC is able to make full use of off-line RSS variations of RPs and all the collected on-line RSS samples, the NCC fingerprinting algorithm outperforms the conventional KNN and WKNN fingerprinting algorithms that calculate a localization result with only an on-line RSS mean sample. However, the computational cost of the basic NCC algorithm is very expensive, so an FNCC algorithm is developed. It greatly reduces computational complexity while maintaining the same high accuracy as the basic NCC algorithm. Through integrating a proposed map matching algorithm into the KF, a KMF is proposed to improve location sensing accuracy. Using available indoor map information, the proposed map matching algorithm corrects unreasonable locations computed by the KF linear state prediction process to a calibration model, which represents pedestrian walkways. Based on the corrected locations, the KMF can calculate more accurate localization results using measurement data than the KF. The experimental results confirm both that the FNCC significantly reduces computational complexity of correlation computations without accuracy decreases and that KMF effectively improves location sensing accuracy by using indoor map information and spatial proximities of consecutive localization results.
Acknowledgments
The authors gratefully thank the referees for their constructive and insightful comments. This work was supported by National High-Tech Research & Development Program of China under Grant 2012AA120802 and by National Natural Science Foundation of China under Grant 61071105 and 611011220.
Conflicts of Interest
The authors declare no conflict of interest.
References
- 1.Becker C., Dürr F. On location models for ubiquitous computing. Pers. Ubiquitous Comput. 2005;9:20–31. [Google Scholar]
- 2.Hightower J., Borriello G. Location systems for ubiquitous computing. Computer. 2001;34:57–66. [Google Scholar]
- 3.Georgy J., Noureldin A. Tightly coupled low cost 3D RISS/GPS integration using a mixture particle filter for vehicular navigation. Sensors. 2011;11:4244–4276. doi: 10.3390/s110404244. [DOI] [PMC free article] [PubMed] [Google Scholar]
- 4.Prasithsangaree P., Krishnamurthy P., Chrysanthis P.K. On Indoor Position Location with Wireless Lans. Proceedings of 13th IEEE International Symposium on Personal, Indoor and Mobile Radio Communications; Lisbon, Portugal. 15–18 September 2002; pp. 720–724. [Google Scholar]
- 5.Gu Y.Y., Lo A., Niemegeers I. A survey of indoor positioning systems for wireless personal networks. IEEE Commun. Surv. Tutor. 2009;11:13–32. [Google Scholar]
- 6.Want R., Hopper A., Falcao V., Gibbons J. The active badge location system. ACM Trans. Inform. Syst. 1992;10:91–102. [Google Scholar]
- 7.Ni L.M., Liu Y., Lau Y.C., Patil A.P. LANDMARC: Indoor location sensing using active RFID. Wirel. Netw. 2004;10:701–710. [Google Scholar]
- 8.Maranò S., Gifford W.M., Wymeersch H., Win M.Z. NLOS identification and mitigation for localization based on UWB experimental data. IEEE J. Sel. Areas Commun. 2010;28:1026–1035. [Google Scholar]
- 9.Liu H., Darabi H., Banerjee P., Liu J. Survey of wireless indoor positioning techniques and systems. IEEE Trans. Syst. Man. Cybern. C. 2007;37:1067–1080. [Google Scholar]
- 10.Zhou M., Xu Y.B., Ma L., Tian S. On the statistical errors of RADAR location sensor networks with built-in Wi-Fi Gaussian linear fingerprints. Sensors. 2012;12:3605–3626. doi: 10.3390/s120303605. [DOI] [PMC free article] [PubMed] [Google Scholar]
- 11.Bahl P., Padmanabhan V.N. RADAR: An in-Building RF-Based User Location and Tracking System. Proceedings of 19th IEEE Computer and Communications Societies Conference; Tel Aviv, Israel. 26–30 March 2000; pp. 775–784. [Google Scholar]
- 12.Li B.H., Wang Y., Lee H.K., Dempster A.G., Rizos C. Method for yielding a database of location fingerprints in WLAN. IEEE Proc. Commun. 2005;152:580–586. [Google Scholar]
- 13.Baala O., Caminada A. Location Precision in Indoor Positioning System. Proceedings of 2006 Innovations in Information Technology; Dubai, UAE. 19–21 November 2006; pp. 1–5. [Google Scholar]
- 14.Xu Y.B., Zhou M., Meng W.X., Ma L. Optimal KNN Positioning Algorithm via Theoretical Accuracy Criterion in WLAN Indoor Environment. Proceedings of 2010 IEEE Global Telecommunications Conference; Miami, FL, USA. 6–10 December 2010; pp. 1–5. [Google Scholar]
- 15.Zhou M., Xu Y.B., Tang L. Multilayer ANN indoor location system with area division in WLAN environment. J. Syst. Eng. Electron. 2010;21:914–926. [Google Scholar]
- 16.Meng W.X., Wang J.W., Peng L., Xu Y.B. ANFIS-Based Wireless LAN Indoor Positioning Algorithm. Proceedings of 5th International Conference on Wireless Communications, Networking and Mobile Computing; Beijing, China. 24–26 September 2009; pp. 1–4. [Google Scholar]
- 17.Brunato M., Battiti R. Statistical learning theory for location fingerprinting in wireless LANs. Comput. Netw. 2005;47:825–845. [Google Scholar]
- 18.Xiao J., Wu K.S., Yi Y.W., Ni L.M. FIFS: Fine-Grained Indoor Fingerprinting System. Proceedings of 2012 21st International Conference on Computer Communications and Networks; Munich, Germany. 30 July–2 August 2012; pp. 1–7. [Google Scholar]
- 19.Liu X.C., Zhang S., Zhao Q.Y., Lin X.K. A Real-Time Algorithm for Fingerprint Localization Based on Clustering and Spatial Diversity. Proceedings of 2010 International Congress on Ultra Modern Telecommunications and Control Systems and Workshops; Moscow, Russia. 18–20 October 2010; pp. 74–81. [Google Scholar]
- 20.Tsai D.M., Lin C.T. Fast normalized cross correlation for defect detection. Pattern Recognit. Lett. 2003;24:2625–2631. [Google Scholar]
- 21.Avants B.B., Epstein C.L., Grossman M., Gee J.C. Symmetric diffeomorphic image registration with cross-correlation: Evaluating automated labeling of elderly and neurodegenerative brain. Med. Image Anal. 2008;12:26–41. doi: 10.1016/j.media.2007.06.004. [DOI] [PMC free article] [PubMed] [Google Scholar]
- 22.Lewis J.P. Fast template matching. Vis. Interface. 1995;95:120–123. [Google Scholar]
- 23.Yoo J.C., Han T.H. Fast normalized cross-correlation. Circuits. Syst. Signal Process. 2009;28:819–843. [Google Scholar]
- 24.Wei S.D., Lai S.H. Fast template matching based on normalized cross correlation with adaptive multilevel winner update. IEEE Trans. Image Process. 2008;17:2227–2235. doi: 10.1109/tip.2008.2004615. [DOI] [PubMed] [Google Scholar]
- 25.Outemzabet S., Nerguizian C. Accuracy Enhancement of an Indoor ANN-Based Fingerprinting Location System Using Kalman Filtering. Proceedings of IEEE 19th International Symposium on Personal, Indoor and Mobile Radio Communications; Poznan, Poland. 15–18 September 2008; pp. 1–5. [Google Scholar]
- 26.Ali-loytty S., Perala T., Honkavirta V., Piche R. Fingerprint Kalman Filter in Indoor Positioning Applications. Proceedings of 18th IEEE International Conference on Control Applications Part of 2009 IEEE Multi-Conference on Systems and Control; Saint Petersburg, Russia. 8–10 July 2009; pp. 1678–1683. [Google Scholar]
- 27.Chiou Y.S., Wang C.L., Yeh S.C. An Adaptive Location Estimator Based on Kalman Filtering for Dynamic Indoor Environments. Proceedings of 2006 Vehicular Technology Conference Fall; Montreal, QC, Canada. 25–28 September 2006; pp. 1–5. [Google Scholar]
- 28.Outemzabet S., Nerguizian C. Accuracy Enhancement of an Indoor ANN-Based Fingerprinting Location System Using Particle Filtering and a Low-Cost Sensor. Proceedings of 2008 IEEE 67th Vehicular Technology Conference; Marina Bay, Singapore. 11–14 May 2008; pp. 2750–2754. [Google Scholar]
- Wang H., Szabo A., Bamberger J., Brunn D., Hanebeck U.D. Performance Comparison of Nonlinear Filters for Indoor WLAN Positioning. Proceedings of 11th International Conference on Information Fusion; Cologne, Germany. 30 June–3 July 2008; pp. 1–7. [Google Scholar]
- 30.Leppakoski H., Collin J., Takala J. Pedestrian navigation based on inertial sensors, indoor map, and WLAN signals. J. Signal. Process. Syst. 2013;71:287–296. [Google Scholar]
- 31.Beauregard S., Widyawan W., Klepal M. Indoor PDR Performance Enhancement Using Minimal Map Information and Particle Filters. Proceedings of 2008 IEEE /ION Position, Location and Navigation Symposium; Monterey, CA, USA. 5–8 May 2008; pp. 141–147. [Google Scholar]
- 32.Ascher C., Kessler C., Weis R., Trommer G.F. Multi-Floor Map Matching in Indoor Environments for Mobile Platforms. Proceedings of 2012 International Conference on Indoor Positioning and Indoor Navigation; Sydney, Australia. 13–15 November 2012; pp. 1–5. [Google Scholar]


