Abstract
There is a considerable resurgence of interest in the role of aerobic glycolysis in cancer; however, increased glycolysis is frequently viewed as a consequence of oncogenic events that drive malignant cell growth and survival. Here we provide evidence that increased glycolytic activation itself can be an oncogenic event in a physiologically relevant 3D culture model. Overexpression of glucose transporter type 3 (GLUT3) in nonmalignant human breast cells activated known oncogenic signaling pathways, including EGFR, β1 integrin, MEK, and AKT, leading to loss of tissue polarity and increased growth. Conversely, reduction of glucose uptake in malignant cells promoted the formation of organized and growth-arrested structures with basal polarity, and suppressed oncogenic pathways. Unexpectedly and importantly, we found that unlike reported literature, in 3D the differences between “normal” and malignant phenotypes could not be explained by HIF-1α/2α, AMPK, or mTOR pathways. Loss of epithelial integrity involved activation of RAP1 via exchange protein directly activated by cAMP (EPAC), involving also O-linked N-acetylglucosamine modification downstream of the hexosamine biosynthetic pathway. The former, in turn, was mediated by pyruvate kinase M2 (PKM2) interaction with soluble adenylyl cyclase. Our findings show that increased glucose uptake activates known oncogenic pathways to induce malignant phenotype, and provide possible targets for diagnosis and therapeutics.
Introduction
Traditionally, glucose intermediary metabolism was referred to as a housekeeping function (reviewed in ref. 1). However, the role of aerobic glycolysis, referred to as the “Warburg effect,” is creating much excitement again in the field of cancer research. Warburg hypothesized that irreversible mitochondrial dysfunction is the underlying reason behind the metabolic shift to aerobic glycolysis, which results in transformation of the cells (2). But mitochondrial dysfunction need not always be present in transformed cells when there is increased aerobic glycolysis (3–5). Still, much of the current literature views the metabolic alterations as resulting from the pleiotropic response to oncogenic signaling (reviewed in refs. 6–8). Furthermore, the most frequently mentioned reasons for increased glucose metabolism are contributions to the tumor’s proliferation and survival: the glycolytic pathway provides ATP independently of oxygen when tumors confront a hypoxic microenvironment (9). Numerous intermediary glucose metabolites are used for diverse biosynthetic processes (7), and NADPH, a reducing equivalent generated by glucose metabolism, sequesters ROS and thus confers resistance to cell death (10, 11).
Yet although Warburg had theorized that the metabolic shift to glycolysis is “the origin of cancer cells” (2), the demonstration of causative effects of the increased glucose uptake and metabolism on oncogenesis has eluded the field so far (3, 12).
In contrast, the idea that glucose level itself can trigger intra- and intercellular signaling is accepted and studied widely in the fields of endocrinology and diabetes. Glucose signaling is known to be linked to physiological and pathological events, such as regulation of hormone secretion and insulin resistance (12–14).
Given the demonstration of the effect of the microenvironment, including tissue architecture (15) and the composition of the media (1), on gene expression, and the integration of signaling events observed in 3D laminin-rich ECM (lrECM) gel assays (reviewed in ref. 16), we reasoned that glucose uptake and metabolism should also be essential components of the tissue’s “integration plan” — that is, if uptake and metabolism of glucose were hyperactivated, the canonical oncogenic pathways should also be activated reciprocally. Here, we directly addressed this important possibility in cancer promotion using 3D lrECM cultures, in which both malignant and nonmalignant breast epithelial cells behave phenotypically analogous to their corresponding architecture in vivo (17).
Our observations showed that inhibition of glucose uptake and metabolism suppressed known oncogenic pathways and resulted in “phenotypic reversion” (16) in a number of breast cancer cells in the 3D assays. Importantly, forced increases in glucose uptake and metabolism activated a number of such signaling pathways involved in oncogenesis, leading to a malignant-like phenotype in nonmalignant breast cells. We showed that both the glycolytic pathway and the hexosamine biosynthetic pathway (HBP) were involved in the reciprocal regulation — but, importantly, only in a 3D structure, not on tissue culture plastic (i.e., 2D). These findings strongly suggest that increased glucose uptake and metabolism in nonmalignant/premalignant cells could indeed be an oncogenic event analogous to activation of EGFR, β1 integrin (encoded by ITGB1), PI3K-AKT, or MEK-ERK. We also unraveled the mechanisms of the intricate and hitherto unknown reciprocal activation by which glucose metabolism and other oncogenic pathways integrate in 3D.
Results
Increased glucose metabolism activates pathways involved in oncogenesis.
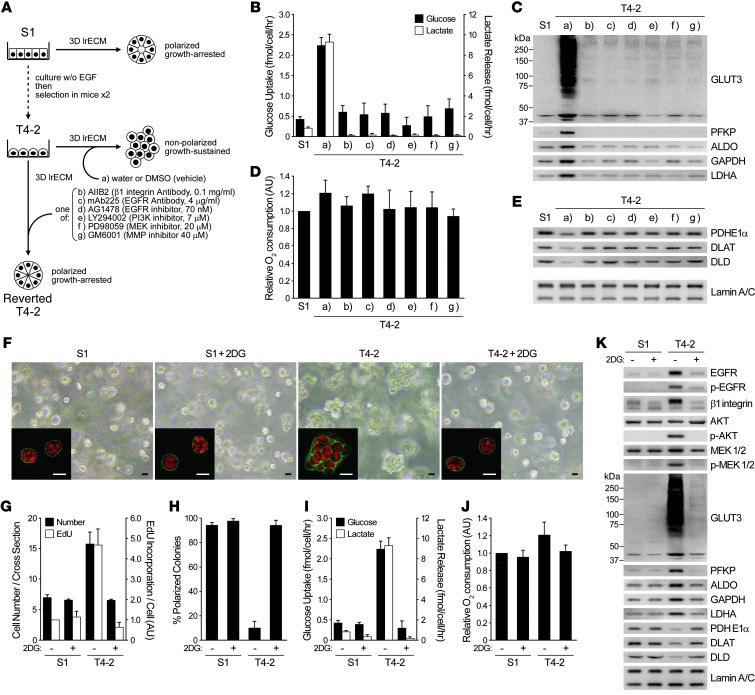
To test whether increased glucose metabolism itself is required for oncogenic signaling, we used 3D lrECM cultures of HMT-3522, a breast cancer progression series that includes nonmalignant (S1) and malignant (T4-2) human breast epithelial cells from the same reduction mammoplasty (18). We previously used this assay to describe the involvement and reciprocity among a number of oncogenic signaling pathways and cellular contexts (16, 19–26). We have also described how suppressing activated signaling in any one such pathway in the 3D assay adjusts all the others, leading to phenotypic reversion, in which cancer cells perceive microenvironmental cues that lead to the formation of acinus-like structures, as seen in primary nonmalignant cells (16, 19–26). In the present study, we used phenotypic reversion of cancer cells as an assay with which to test our hypothesis that the signaling integration plan of the breast-like acini involves reciprocal regulation of glucose metabolism as well (Figure 1A and Supplemental Figure 1A; supplemental material available online with this article; doi: 10.1172/JCI63146DS1).
Figure 1. Reversion of malignant phenotype in 3D cultures sheds light on the importance of glucose uptake and metabolism in inducing oncogenic signaling.
(A–E) S1, T4-2, and reverted T4-2 cells were cultured in 3D lrECM with signaling inhibitors. (A) Experimental scheme. (B) Glucose uptake (black bars) and lactate release (white bars). (C) Western blot of proteins related to these functions. (D) Relative oxygen consumption rate. (E) Western blot of PDC components. Lamin A/C served as a control for both C and E. (F–K) S1 and T4-2 cells were cultured in 3D lrECM with or without 4 mM 2DG. (F) Phase-contrast and confocal immunofluorescence (IF; inset) images. Green, α6 integrin; red, nuclei (DAPI). Scale bars: 20 μm. (G) Cell number at the colony midsection (black bars) and EdU incorporation per cell (white bars). (H) Percent colonies with basal polarity. (I) Glucose uptake (black bars) and lactate release (white bars). (J) Relative oxygen consumption rate. (K) Western blot of signaling intermediates, GLUT3, metabolic enzymes, and other proteins related to — or influenced by — glucose metabolism. In B, D, and G–J, data are mean ± SD of triplicate experiments.
Both glucose uptake and lactate release, 2 hallmarks of aerobic glycolysis, were substantially higher in T4-2 colonies than in S1 acini. But in the reverted T4-2 structures, these parameters became similar to those of S1 acini, regardless of the inhibitors used to revert (Figure 1, A and B). Intracellular levels of fructose-6-phosphate (F6P) and lactate were also several-fold higher in T4-2 versus S1 cells in their steady states. Glucose starvation significantly reduced the levels of these metabolites in T4-2 cells, but S1 cells were unaffected (Supplemental Figure 1, B and C), which suggests that the increased glucose uptake observed in T4-2 cells indeed accounts for the increase in glycolytic metabolism. We examined gene expression profiles of these cells using both our own previously published as well as new data. Most of the glycolytic enzymes were higher in T4-2 than in S1 cells; however, when T4-2 cells were phenotypically reverted, the expression levels were reverted as well (Supplemental Figure 1D). We confirmed changes in protein levels of platelet-type phosphofructokinase (PFKP), GAPDH, aldolase (ALDO), and lactate dehydrogenase A (LDHA) by Western blot: all were upregulated in T4-2 colonies and downregulated in reversion (Figure 1C).
Examination of glucose transporters by microarray and Western blot showed that GLUT3 (a facilitative glucose transporter, encoded by SLC2A3) showed the most dramatic upregulation in T4-2 colonies (>100-fold; Figure 1C), whereas GLUT1 (another glucose transporter known to increase in a number of tumor types; ref. 27) was almost unaltered (data not shown). Unlike the glycolytic intermediates, relative oxygen consumption rate (i.e., mitochondrial metabolic activity) was not very different in different conditions (Figure 1D). But the expression of the components of the pyruvate dehydrogenase complex (PDC), which mediates entry of pyruvate into citric acid cycle, was actually several-fold higher (PDHE1α, 2.26 ± 0.20; DLAT, 2.61 ± 0.10; DLD, 4.69 ± 0.78) in S1 acini and reverted T4-2 structures than in T4-2 (Figure 1E), providing a possible explanation for the essentially unaltered oxygen consumption despite the significant difference in glucose uptake. Thus, mitochondrial metabolism is not necessarily impaired, even when aerobic glycolysis is increased, as was the case here.
Almost all the literature on aerobic glycolysis in cancer cells has been performed on tissue culture plastic (i.e., 2D) and invariably shows that oncogenic pathway activation is upstream of glucose metabolism increases. Given the observation that canonical oncogenic pathways regulate each other reciprocally in 3D but not in 2D (16, 25), we reasoned that such reciprocity must also exist between canonical oncogenic signaling and increased aerobic glycolysis, and if so, that direct inhibition of glucose metabolism in T4-2 cells should suppress the malignant phenotype in 3D. Indeed, inhibition of glucose metabolism using 2-deoxy-d-glucose (2DG) induced phenotypic reversion, including arresting growth, reestablishing basally polarized acini, decreasing the levels and/or activities of canonical oncogenic pathways and dramatically downregulating GLUT3 and the glycolytic enzymes (Figure 1, F–H and K). Whereas glucose uptake and lactate release were suppressed, again, relative oxygen consumption rate was essentially unaffected and PDC components were elevated (Figure 1, I–K). Importantly, treatment of S1 cells with the same level of 2DG neither altered the acinar morphology nor reduced the growth rate (Figure 1, F–H).
Extracellular glucose level determines malignant phenotype of breast cancer cells in 3D lrECM.
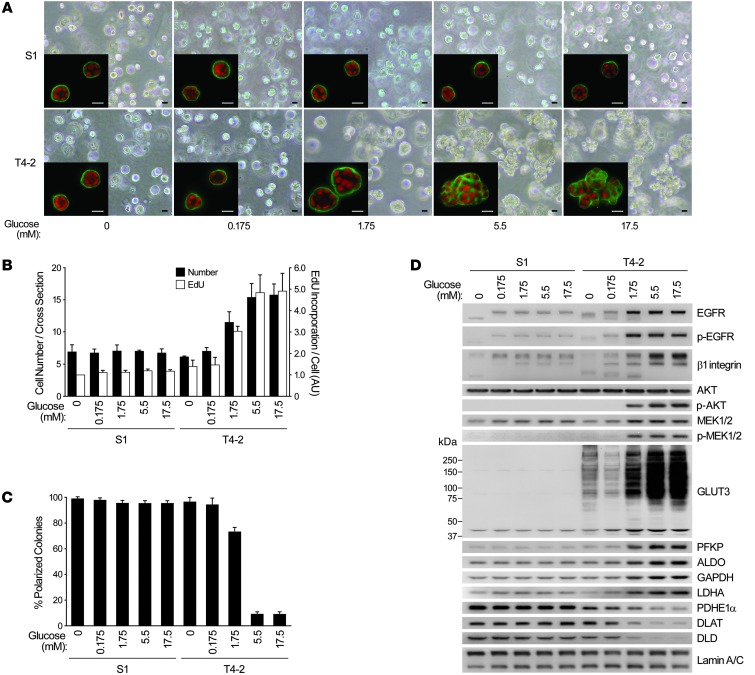
To ascertain that our 2DG results were not due to off-target effects, we examined whether reducing the extracellular glucose concentration would also induce reversion of the malignant phenotype. We chose media with 5 different glucose concentrations ranging 0–17.5 mM; the latter was the concentration previously used in the medium for the HMT-3522 progression series (18). In T4-2 cells cultured in 3D with no glucose or less than the physiological 5.5-mM amount, basal polarity was reestablished and growth was markedly suppressed (Figure 2, A–C). Expression and/or activation of the glycolytic enzymes and GLUT3, as well as key oncogenic signaling intermediates, was drastically reduced, becoming similar to — or even lower than — the levels of S1 acini in 3D. The PDC components again showed the opposite trend (Figure 2D). Even a 100-fold change in glucose concentration did not alter the rate of growth, acinar organization, or pattern of signaling intermediates in S1 acini established in 3D lrECM (Figure 2, A–D).
Figure 2. Glucose concentration determines phenotype, oncogenic signaling level, and pattern of glycolytic intermediates in malignant T4-2 cells.
(A–D) 3D cultures of S1 and T4-2 cells were performed at different glucose concentrations. (A) Phase-contrast and confocal IF (inset) images. Green, α6 integrin; red, nuclei. Scale bars: 20 μm. (B) Cell number at the colony midsection (black bars) and EdU incorporation per cell (white bars). (C) Percent colonies with basal polarity. (D) Western blot of signaling intermediates, GLUT3, and metabolic enzymes. In B and C, data are mean ± SD of triplicate experiments.
Glucose uptake level is a critical determinant of whether breast cancer cells form colonies with malignant or nonmalignant phenotypes in 3D lrECM.
To examine how and to what extent oncogenic signaling activation and malignant phenotype were dependent on glucose uptake level, we knocked down GLUT3 by siRNA in T4-2 cells and cultured them on 3D-on-top lrECM (referred to herein as 3D-OT lrECM; see Methods) supplemented with medium containing the different glucose concentrations.
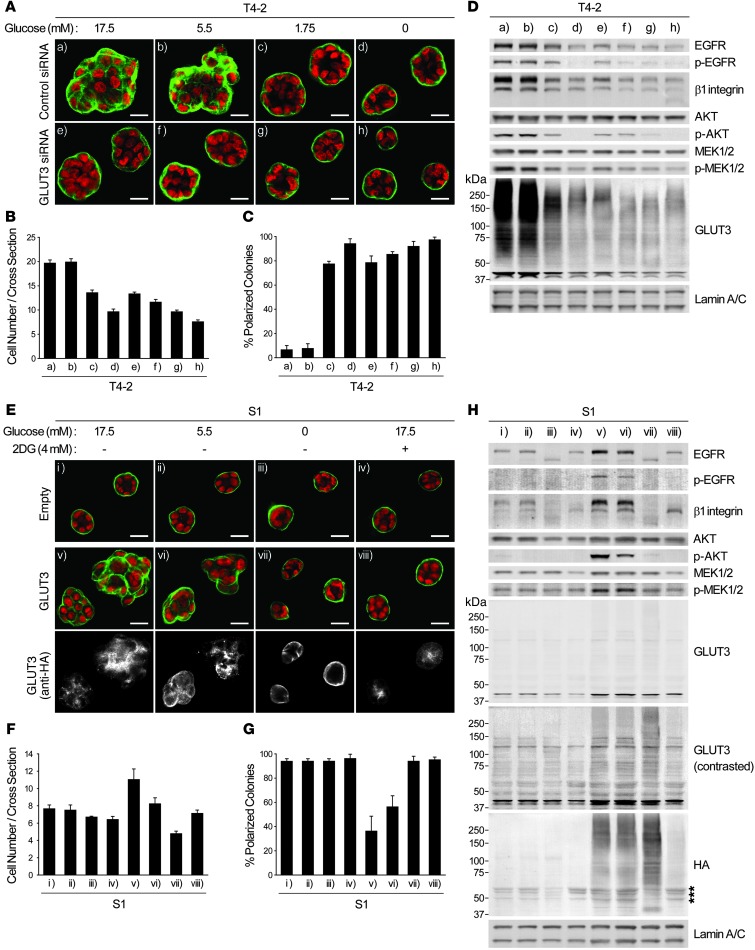
In T4-2 cells treated with nontargeting siRNA, reducing glucose from 17.5 to 5.5 mM produced little to no difference in phenotype (Figure 3, A–D). With 1.75 mM glucose, however, basal polarity was reestablished, and growth rate, β1 integrin expression, and AKT activity were downmodulated. Reducing glucose to 0 mM led to complete growth arrest and formation of polarized acinus-like structures with even further reduction in EGFR, MEK, and other oncogenic signaling activities (Figure 3, A–D). Knockdown of GLUT3 allowed T4-2 cells to form structures with basal polarity analogous to that of S1, even in the presence of 17.5 mM glucose (Figure 3, A–D). We confirmed that GLUT3 knockdown dramatically decreased glucose uptake of T4-2 cells and did not observe compensation by GLUT1, another high-affinity glucose transporter, in GLUT3-silenced cells (Supplemental Figure 2, A and B).
Figure 3. Glucose uptake and metabolism determine the signaling activity and morphology of malignant and nonmalignant mammary epithelial cells.
(A–D) T4-2 cells were transfected with control or GLUT3 siRNA and cultured in 3D-OT lrECM with the indicated glucose concentrations. (A) Confocal IF images. Green, α6 integrin; red, nuclei. Scale bars: 20 μm. (B) Cell number at the colony midsection. (C) Percent colonies with basal polarity. (D) Western blot of signaling intermediates and GLUT3. (E–H) S1 cells were infected with empty or GLUT3-HA–encoding lentivirus and cultured in 3D lrECM with 4 mM 2DG and/or the indicated glucose concentrations. (E) Confocal IF images. Green, α6 integrin; red, nuclei. Immunostaining with anti-HA antibody is also shown. Scale bars: 20 μm. (F) Cell number at the colony midsection. (G) Percent colonies with basal polarity. (H) Western blot of signaling intermediates, GLUT3, and HA epitope. Asterisks denote nonspecific bands. In B, C, F, and G, data are mean ± SD of triplicate experiments.
Malignancy is the end result of many genetic and epigenetic changes that occur over decades in vivo, leading to serious imbalance in gene expression and phenotype. Our studies of S1 cells showed that there was no adverse response to changes in extracellular glucose concentrations. However, transduction of GLUT3 into S1 cells cultured in 3D with ≥5.5 mM glucose was itself sufficient to give rise to disorganized colonies (Figure 3, E–G). Activity of the key signaling intermediates involved in oncogenic transformation, glucose uptake, and intracellular levels of F6P and lactate were all upregulated in GLUT3-overexpressing S1 cells, and this increase could be canceled by glucose starvation and/or 2DG treatment (Figure 3H and Supplemental Figure 2, C–E). We know from our previous data (28) that this nonmalignant immortal cell line contains a number of mutations that are phenotypically silent in 3D assays, and thus S1 cells already are initiated enough to respond to an increase in GLUT3 expression by disorganization of acinar structures. Intriguingly, however, expression levels of glycolytic enzymes were not changed significantly by overexpression of GLUT3 alone in S1 cells (Supplemental Figure 2F). This suggests that additional genetic and epigenetic changes are necessary to allow the entire glycolytic pathways to resemble T4-2 cells.
AMPK, mTOR, and HIF, the canonical metabolic signaling pathways in 2D, are not determinants of malignant phenotype in 3D cultures.
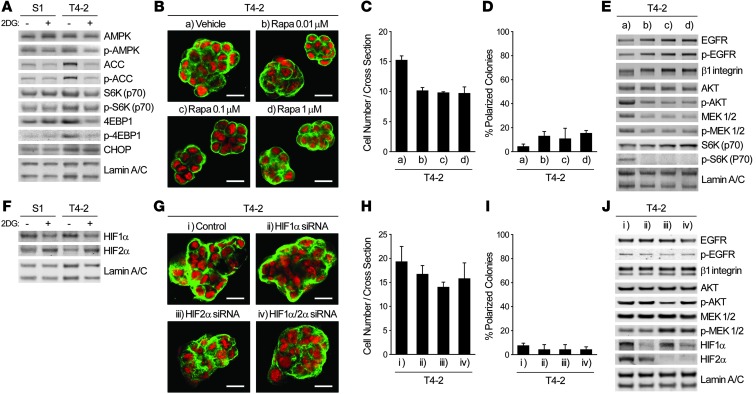
To determine the pathways that allow increased glucose uptake to translate into oncogenic signaling, we examined the activity of AMPK and mammalian target of rapamycin (mTOR) pathways, which are known to be affected by intracellular fuel and energy status (6, 8). Treatment with 2DG in 3D cultures did not induce phosphorylation of AMPK or its major target, acetyl-CoA carboxylase (ACC); rather, phosphorylation and total level of ACC were increased in control T4-2 cells (Figure 4A). Importantly, these same molecules were phosphorylated appreciably by 2DG treatment in 2D cultures (data not shown), which again indicated that the AMPK pathway is differently regulated in 2D and 3D contexts. Phosphorylation levels of S6K and 4EBP1, 2 major targets of mTOR complex 1 (mTORC1; ref. 29), were slightly higher in T4-2 cells compared with S1 or 2DG-treated T4-2 cells (Figure 4A), which indicates that the mTOR pathway could be influenced only modestly by inhibition of glucose metabolism in 3D. Nevertheless, mTOR inhibitors, such as rapamycin and PP242, did not induce phenotypic reversion, despite reducing AKT phosphorylation at Ser473 as well as cellular proliferation (Figure 4, B–E, and Supplemental Figure 3, A–D). These results are consistent with the findings that mTORC2 phosphorylates Ser473 of AKT and that PP242 and rapamycin, when administered for extended periods (30), suppress mTORC2 as well as mTORC1. These findings support our repeated contention that phenotypic reversion is not simply a matter of growth inhibition (16, 19, 23). Similarly, expression of hypoxia-inducible factor–1α (HIF-1α) and HIF-2α, which have been shown to regulate expression of glycolytic enzymes and glucose transporters in many studies using 2D cultures (reviewed in ref. 6), did not correlate with the expression levels of glycolytic enzymes and GLUT3 or the malignant phenotype (Figure 1K and Figure 4F). The detected bands around 100 kDa were confirmed to be HIF-1α and HIF-2α (Supplemental Figure 3E). siRNA-mediated knockdown of HIF-1α and/or HIF-2α, alone or in combination, did not suppress activities of the canonical oncogenic pathways, nor did they induce phenotypic reversion (Figure 4, F–J). Expression of GLUT3 and glycolytic enzymes was not affected in these conditions either, except that GLUT3 and PFKP expression were slightly suppressed by HIF-2α knockdown (Supplemental Figure 3F). Expression and/or activation of AMPK, mTOR, and HIF pathways in glucose-deprived S1 and T4-2 cells showed tendencies similar to those in 2DG-treated cells; however, phosphorylation of AMPK and 4EBP1 was somehow remarkably increased in T4-2 cells cultured without glucose (Supplemental Figure 3, G and H). Finally, expression of an ER stress marker, C/EBP homologous protein (CHOP), was unchanged by 2DG treatment (Figure 4A). Thus, induction of oncogenic pathways by glucose uptake and metabolism in mammary epithelial cells does not appear to involve these well-known pathways when cells are within a more physiological 3D context.
Figure 4. Integration of increased aerobic glycolysis and oncogenic signaling in 3D cultures does not involve the canonical metabolic signaling pathways.
(A) Western blot of proteins regulating — or influenced by — metabolism in S1 or T4-2 cells cultured in 3D lrECM with or without 4 mM 2DG. (B–E) T4-2 cells treated with vehicle or with 0.01, 0.1, or 1.0 μM rapamycin (Rapa) were cultured in 3D lrECM. (B) Confocal IF images. Green, α6 integrin; red, nuclei. Scale bars: 20 μm. (C) Cell number at the colony midsection. (D) Percent colonies with basal polarity. (E) Western blot of signaling intermediates. (F) Western blot of HIF-1α and HIF-2α in S1 or T4-2 cells cultured in 3D lrECM with or without 4 mM 2DG. (G–J) T4-2 cells transfected with control, HIF-1α, HIF-2α, or HIF-1α/2α siRNA were cultured in 3D lrECM. (G) Confocal IF images. Green, α6 integrin; red, nuclei. Scale bars: 20 μm. (H) Cell number at the colony midsection. (I) Percent colonies with basal polarity. (J) Western blot of signaling intermediates. In C, D, H, and I, data are mean ± SD of triplicate experiments.
The glycolytic pathway between GAPDH and LDH potentiates the malignant phenotype through upregulation of β1 integrin.
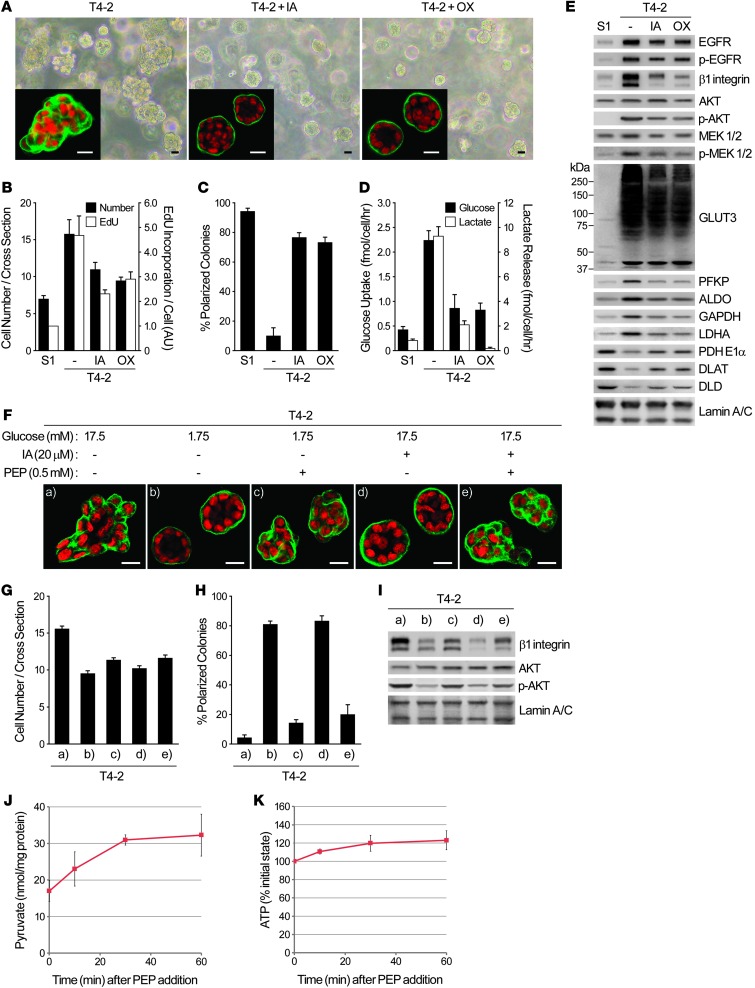
To understand how changes in glucose uptake and metabolism translate into the dramatic alteration in the oncogenic pathways, we used both chemical inhibitors and siRNA strategies. Iodoacetate (IA) and oxamate (OX) are inhibitors of GAPDH and LDH, respectively, expression of which was increased in T4-2 colonies (Figure 1C). OX is known to inhibit GAPDH as well, since it blocks the supply of NAD+, a coenzyme for GAPDH. When T4-2 cells were treated with either inhibitor in basal medium (17.5 mM glucose), they formed organized colonies, but the rate of proliferation remained higher than in S1 acini (Figure 5, A–C). Whereas β1 integrin expression and AKT activity were reduced appreciably, EGFR and MEK were affected only slightly (Figure 5E). These characteristics were nearly identical to those of the T4-2 cells cultured with 1.75 mM glucose (Figure 2). Under these conditions, glucose uptake, lactate release, and expression of glycolytic enzymes and GLUT3 were partially but clearly suppressed (Figure 5, D and E). PDC component expression was partially restored, whereas relative oxygen consumption rate was not appreciably affected by the inhibitors (Figure 5E and data not shown). Knockdown of GAPDH by siRNA essentially reproduced these results (Supplemental Figure 4, A–D), showing that the effects observed with the chemical inhibitors were not due to nonspecific side effects. Supplementation of phosphoenolpyruvate (PEP), an intermediate between GAPDH and LDH, to IA-treated or glucose-reduced (1.75 mM) T4-2 cells partially increased β1 integrin expression and AKT activity and also disorganized acinar structures (Figure 5, F–I). PEP supplementation to the glucose-deprived T4-2 cells increased the intracellular levels of pyruvate and ATP (Figure 5, J and K), which suggests that PEP is in fact taken up by the cells and metabolized by pyruvate kinase (PK) to pyruvate. Supplementation of pyruvate did not reproduce the malignant phenotype (Supplemental Figure 4, E–H), which suggests that the conversion step itself is necessary for the malignant phenotype.
Figure 5. Glycolytic pathway inhibition reduces oncogenic signaling and reverses the malignant phenotype.
(A–E) T4-2 cells were cultured in 3D lrECM with or without 20 μM IA or 50 mM OX. (A) Phase-contrast and IF (inset) images. Green, α6 integrin; red, nuclei. Scale bars: 20 μm. (B) Cell number at the colony midsection (black bars) and EdU incorporation per cell (white bars). (C) Percent colonies with basal polarity. (D) Glucose uptake (black bars) and lactate release (white bars). (E) Western blot of signaling intermediates, GLUT3, and metabolic enzymes. (F–I) T4-2 cells were cultured in 3D lrECM with 17.5 mM or 1.75 mM (low) glucose, 20 μM IA, and/or 0.5 mM PEP. (F) Confocal IF images. Green, α6 integrin; red, nuclei. Scale bars: 20 μm. (G) Cell number at the colony midsection. (H) Percent colonies with basal polarity. (I) Protein expression and/or activation of β1 integrin and AKT. (J and K) T4-2 cells were cultured in 3D-OT lrECM with 1.75 mM glucose and 0.5 mM PEP. Levels of pyruvate (J) and ATP (K) were measured at the indicated time points. In B–D, G, H, J, and K, data are mean ± SD of triplicate experiments.
Treatment with oligomycin (OGM), an inhibitor of mitochondrial ATP synthase, did not induce organized structures in T4-2 cells, despite significantly suppressing proliferation (Supplemental Figure 4, I–K). Interestingly, however, S1 cells treated with OGM lost tissue organization (Supplemental Figure 4, I–K). These findings also suggest that inhibition of glycolytic metabolism, rather than mitochondrial ATP synthesis, is responsible for reestablishment of tissue polarity induced by inhibition of glucose metabolism.
RAP1 activation by increased glycolytic metabolism via EPAC regulates β1 integrin signaling.
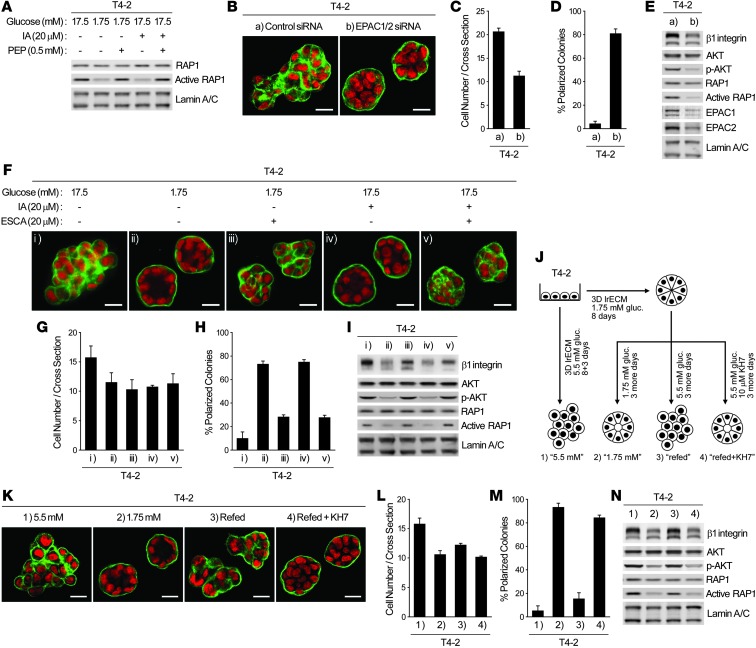
The phenotype of T4-2 cells cultured with 1.75 mM glucose (Figure 2) or treated with glycolytic inhibitors (Figure 5) was very similar to that of T4-2 cells expressing RAP1-S17N, a dominant-negative mutant of the small GTPase RAP1 (21). Under all 3 conditions, basal polarity was reestablished, but proliferation and the key signaling pathways were not suppressed completely. In fact, treatment with IA, or growth in 1.75 mM glucose, suppressed RAP1 activity (Figure 6A). Relapse of the malignant phenotype by PEP supplementation (Figure 5, F–I) was also associated with RAP1 reactivation (Figure 6A).
Figure 6. The sAC-EPAC1-RAP1 pathway is responsible for glycolysis-mediated upregulation of β1 integrin and loss of acinar polarity.
(A) RAP1 activity of T4-2 cells cultured in 3D lrECM with 17.5 or 1.75 mM glucose, 20 μM IA, and/or 0.5 mM PEP. (B–E) T4-2 cells were transfected with control or EPAC1/2 siRNA and cultured in 3D-OT lrECM. (B) Confocal IF images. Green, α6 integrin; red, nuclei. Scale bars: 20 μm. (C) Cell number at the colony midsection. (D) Percent colonies with basal polarity. (E) Protein expression and/or activation of β1 integrin, AKT, and RAP1. (F–I) T4-2 cells were cultured in 3D lrECM with 17.5 or 1.75 mM glucose, 20 μM IA, and/or 20 μM ESCA. (F) Confocal IF images. Green, α6 integrin; red, nuclei. Scale bars: 20 μm. (G) Cell number at the colony midsection. (H) Percent colonies with basal polarity. (I) Protein expression and/or activation of β1 integrin, AKT, and RAP1. (J–N) Examining the role of sAC. (J) Experimental scheme. (K) Confocal IF images. Green, α6 integrin; red, nuclei. Scale bars: 20 μm. (L) Cell number at the colony midsection. (M) Percent colonies with basal polarity. (N) Protein expression and/or activation of β1 integrin, AKT, and RAP1. In C, D, G, H, L, and M, data are mean ± SD of triplicate experiments.
Previous reports have shown that among RAP1 guanine nucleotide exchange factors, exchange protein directly activated by cAMP (EPAC) is preferentially inhibited by RAP1-S17N (31). We postulated that phenotypic reversion by inhibition of glycolytic pathways may involve suppression of EPAC-mediated RAP1 activation. Knockdown of both EPAC-1 and EPAC-2 in T4-2 cells reduced RAP1 activity and partially reverted phenotype (Figure 6, B–E), analogous to IA treatment or cultivation in 1.75 mM glucose. Furthermore, EPAC-selective cAMP analog (ESCA) supplementation (8CPT-2′-OMe-cAMP; ref. 32) of T4-2 cells treated with IA or cultured with 1.75 mM glucose reactivated RAP1 and partially increased β1 integrin level and AKT activation, leading to loss of tissue polarity (Figure 6, F–I). Notably, ESCA treatment did not restore proliferation to the level of nontreated cultures (Figure 6G), providing further evidence that growth suppression and phenotypic reversion are not necessarily connected.
RAP1 activation in response to increased glycolysis requires cAMP production via sAC.
The above data indicated that cAMP, the endogenous EPAC activator, might also be regulated by changes in glucose metabolism. T4-2 cells were induced to form acinus-like structures by culturing in 1.75 mM glucose and then allowed to disorganize again by increasing glucose concentration to 5.5 mM, which in turn increased expression and/or activity of RAP1, β1 integrin, and AKT (Figure 6, J–N). However, the increase was abolished almost completely by treatment with KH7 (Figure 6, J–N), a specific inhibitor of the soluble adenylyl cyclase (sAC) that catalyzes the conversion of ATP to cAMP and is known to be involved in glucose-induced cAMP production in pancreatic β cells (33, 34). On the other hand, an inhibitor of transmembrane adenylyl cyclases, 2′,5′,dideoxyadenosine, did not suppress the increase of these signaling pathways (data not shown). Consistently, sAC expression was significantly higher in T4-2 than in S1 or reverted T4-2 cells, and siRNA-mediated knockdown of sAC induced phenotypic reversion in T4-2 cells (Supplemental Figure 5, A–E). These results suggest that sAC is responsible for cAMP regulation downstream of glycolysis, which in turn activates the EPAC-RAP1 pathway.
Interaction between sAC and PKM2 links glycolytic metabolism and cAMP-EPAC signaling.
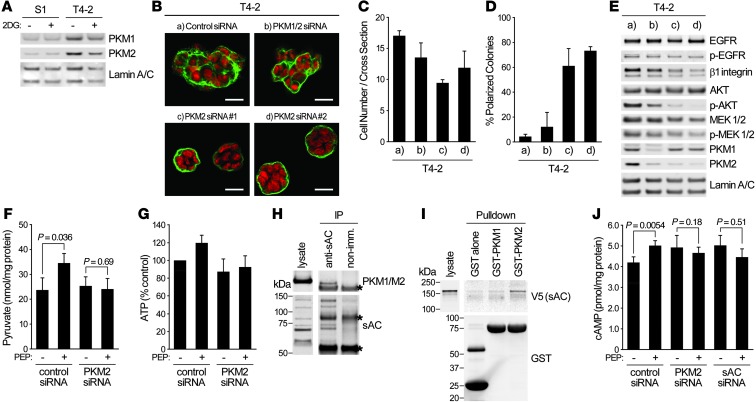
The above data suggest that ATP production by PK could be associated with cAMP production by sAC. The protein level of PK isozyme M2 (PKM2), increased expression and tumor-supporting roles of which have been widely studied (35), was clearly higher in T4-2 cells (Figure 7A). Whereas expression of PKM1, a splice variant of PKM2, was previously reported to be reduced in cancer cells (35), it was higher in T4-2 cells in 3D. siRNAs specifically targeting PKM2, but not PKM1 (36), effectively suppressed oncogenic pathways and induced phenotypic reversion of T4-2 cells in 3D (Figure 7, B–E). Furthermore, elevation of the levels of pyruvate and ATP in glucose-starved T4-2 cells after PEP addition (Figure 5, J and K) was also blocked by PKM2 knockdown (Figure 7, F and G).
Figure 7. PKM2 associates with sAC to link glycolysis and cAMP signaling.
(A) Western blot of PKM1 and PKM2 in S1 or T4-2 cells cultured in 3D lrECM with or without 4 mM 2DG. (B–E) T4-2 cells transfected with control siRNA, PKM1/2 siRNA, or 2 PKM2 siRNAs were cultured in 3D-OT lrECM. (B) Confocal IF images. Green, α6 integrin; red, nuclei. Scale bars: 20 μm. (C) Cell number at the colony midsection. (D) Percent colonies with basal polarity. (E) Western blot of signaling intermediates. (F and G) T4-2 cells were cultured in 3D-OT lrECM with 1.75 mM glucose, and 0.5 mM PEP was added. Levels of pyruvate (F) and ATP (G) were measured. (H) Immunoprecipitation of sAC from lysate of T4-2 cells cultured in 3D-OT lrECM. Precipitates were blotted with the indicated antibodies. Asterisks denote nonspecific bands. (I) Pulldown assay using GST-tagged PKM1 or PKM2 bound to agarose beads and lysate from 293T cells expressing V5-tagged sAC. Precipitates were blotted with the indicated antibodies. GST alone was used as a control. (J) Level of cAMP in T4-2 cells transfected with the indicated siRNAs and cultured in 3D-OT lrECM with 1.75 mM glucose, before and after addition of 0.5 mM PEP. In C, D, F, G, and J, data are mean ± SD of triplicate experiments. P values were calculated using Student’s t test.
Based on these data, we hypothesized that PKM2 may associate with sAC to establish an efficient link between ATP production and cAMP conversion. In fact, sAC was coimmunoprecipitated with muscle-type PK (Figure 7H). Affinity to sAC was also examined by in vitro pulldown assay: only PKM2 was shown to associate with sAC (Figure 7I). Increase in cAMP level was observed in glucose-starved (1.75 mM) T4-2 cells after PEP addition, and this increase was diminished when PKM2 or sAC was knocked down (Figure 7J). PKM2 was shown to act as a protein kinase using PEP as a phosphate donor (37, 38). However, in our 3D condition, phosphorylation levels of known substrates of PKM2, such as STAT3 and Histone H3, and expression level of MEK5, a target gene of STAT3, were not necessarily correlated with cellular phenotypes, nor with extracellular glucose concentration (Supplemental Figure 6), which suggests that these PKM2-mediated phosphorylation events are not directly involved in the present findings.
HBP regulates oncogenic pathways in malignant cells through O-GlcNAc modification.
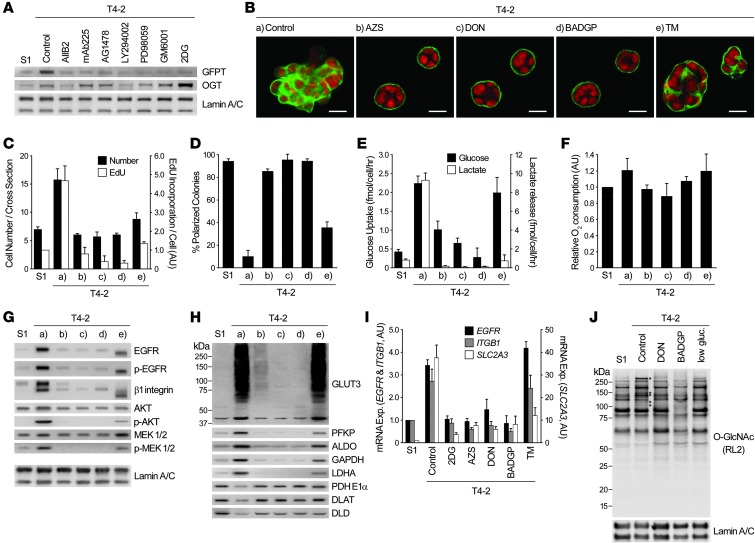
Since EGFR and MEK were not affected appreciably by glycolytic pathway inhibition (Figure 5, A–E, and Supplemental Figure 4, A–D), we searched for others that regulate their activities. Reanalysis of the microarray data of S1, T4-2, and reverted T4-2 cells indicated that the level of glutamine:fructose-6-phosphate transaminase (GFPT), the first and rate-limiting enzyme of HBP, was high in T4-2 colonies, and this was confirmed by Western blot using pan-GFPT antibody (Figure 8A). 2 different inhibitors of GFPT, azaserine (AZS) and 6-diazo-5-oxonorleucine (DON), induced the repertoire of the reversion phenotype: growth arrest, reestablishment of tissue polarity, suppression of oncogenic signaling, and reduction of glycolytic activity (Figure 8, B–H). Under these conditions, EGFR and MEK were substantially downregulated. As expected, relative oxygen consumption rate remained essentially unaltered, and expression levels of GLUT3 and metabolic enzymes became similar to those of S1 cells (Figure 8, F–H).
Figure 8. HBP supports oncogenic signaling and malignant phenotype through O-GlcNAcylation.
(A) Western blot of GFPT and OGT in S1 cells, T4-2 cells, and T4-2 cells reverted with 2DG or different signaling inhibitors (see Figure 1A). The same lamin A/C blots also served as a control for Figure 1, C and E. (B–H) T4-2 cells were cultured in 3D lrECM with or without inhibitors of GFPT (20 μM AZS or DON), O-GlcNAc transferase (5 mM BADGP), or N-glycosylation (10 ng/ml TM). (B) Confocal IF images. Green, α6 integrin; red, nuclei. Scale bars: 20 μm. (C) Cell number at the colony midsection (black bars) and EdU incorporation per cell (white bars). (D) Percent colonies with basal polarity. (E) Glucose uptake (black bars) and lactate release (white bars). (F) Relative oxygen consumption rate. (G and H) Western blot of signaling intermediates (G) and GLUT3 and metabolic enzymes (H). Lamin A/C served as a control for both G and H. (I) mRNA expression of EGFR, ITGB1, and SLC2A3 in S1 cells, T4-2 cells, and T4-2 cells reverted with metabolic inhibitors. Expression level of each gene was normalized to 18S ribosomal RNA. (J) Total O-GlcNAc level in S1 cells, T4-2 cells, and T4-2 cells reverted with DON, BADGP, or low glucose (low gluc; 0.175 mM). Asterisks denote O-GlcNAc bands specifically increased in T4-2 cells. In C–F and I, data are mean ± SD of triplicate experiments.
HBP branches into N-linked glycosylation and O-linked N-acetylglucosamine (O-GlcNAc) modification. Benzyl-2-acetamido-2-deoxy-α-D-galactopyranoside (BADGP), which inhibits O-GlcNAc transferase–mediated (OGT-mediated) O-GlcNAcylation (39), also induced phenotypic reversion, although protein expression of OGT was not very different in S1, T4-2, and reverted T4-2 cells (Figure 8, A–H). These results were essentially reproduced by siRNA-mediated GFPT1/GFPT2 or OGT knockdown in T4-2 cells (Supplemental Figure 7, A–D). On the other hand, inhibition of N-linked glycosylation by tunicamycin (TM) did not lead to phenotypic reversion (Figure 8, B–H), and increasing amounts induced substantial cell death (data not shown). O-GlcNAcylation is known to regulate transcriptional events (40), and phenotypic reversion caused by inhibition of O-GlcNAcylation downmodulated mRNA levels of EGFR, ITGB1, and SLC2A3 (Figure 8I). This was not the case with TM treatment, although TM did reduce SLC2A3 mRNA. O-GlcNAcylation of most proteins was similar in S1, T4-2, and reverted T4-2 cells (by DON treatment or glucose starvation); however, there were some specific upregulated bands only in T4-2 cells (Figure 8J). In addition, treatment with BADGP led to suppression of all O-GlcNAcylation (Figure 8J).
Activation of HBP and/or EPAC-RAP1 pathways partially deregulates tissue polarity in nonmalignant cells and disorganizes reverted tumor cells.
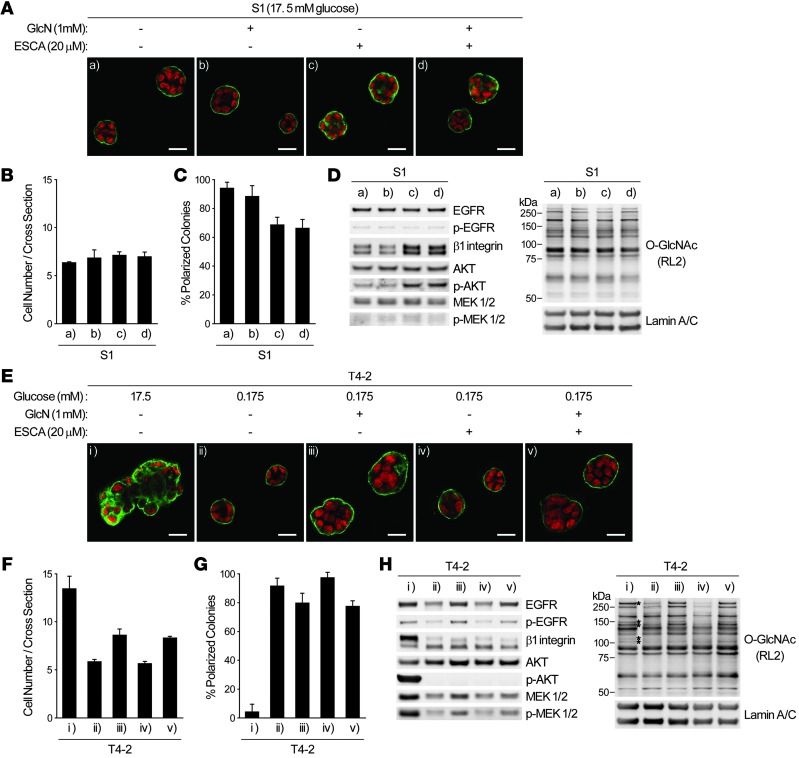
The above findings indicated that activation of the HBP and EPAC-RAP1 pathways may be sufficient to induce the malignant phenotype in 3D lrECM assays. However, addition of glucosamine (GlcN) or N-acetyl glucosamine (GlcNAc) to S1 cells cultured with 17.5 mM glucose changed neither O-GlcNAcylation pattern and signaling activities nor acinar morphology in 3D, whereas ESCA supplementation increased β1 integrin level and partially deregulated tissue polarity (Figure 9, A–D, and data not shown). In GLUT3-overexpressing S1 cells, however, increased O-GlcNAcylation on some proteins, as well as slight upregulation of PKM2 and sAC expression, was observed (Supplemental Figure 8), which suggests that glucose metabolism through yet-unidentified pathways is necessary for tumor-like O-GlcNAcylation pattern. On the other hand, in glucose-starved (0.175 mM) T4-2 cells, which were reverted completely, supplementation with GlcN or GlcNAc partially substituted for increased glucose uptake, leading to increased oncogenic signaling activities and O-GlcNAcylation. However, addition of ESCA neither restored the high level of β1 integrin nor reactivated the downstream signaling (Figure 9, E–H, and data not shown). These data collectively suggest that as-yet unidentified metabolic/signaling pathways must also be dysregulated in order to achieve fully malignant behavior upon increased sugar uptake and metabolism (see Discussion).
Figure 9. Activation of O-GlcNAcylation or EPAC-RAP1 pathways affects phenotypes of nonmalignant or reverted malignant mammary epithelial cells.
(A–D) S1 cells were cultured in 3D lrECM with or without 1 mM GlcN or 20 μM ESCA. (A) Confocal IF images. Green, α6 integrin; red, nuclei. Scale bars: 20 μm. (B) Cell number at the colony midsection. (C) Percent colonies with basal polarity. (D) Western blot of signaling intermediates and total O-GlcNAc. Lamin A/C served as a control. (E–H) T4-2 cells were cultured in 3D lrECM with 17.5 or 0.175 mM glucose, 1 mM GlcN, and/or 20 μM ESCA. (E) Confocal IF images. Green, α6 integrin; red, nuclei. Scale bars: 20 μm. (F) Cell number at the colony midsection. (G) Percent colonies with basal polarity. (H) Western blot of signaling intermediates and total O-GlcNAc. Lamin A/C served as a control. Asterisks denote O-GlcNAc bands specifically increased in T4-2 cells. In B, C, F, and G, data are mean ± SD of triplicate experiments.
Application of our findings to other breast cancer cells and to previously published patient data.
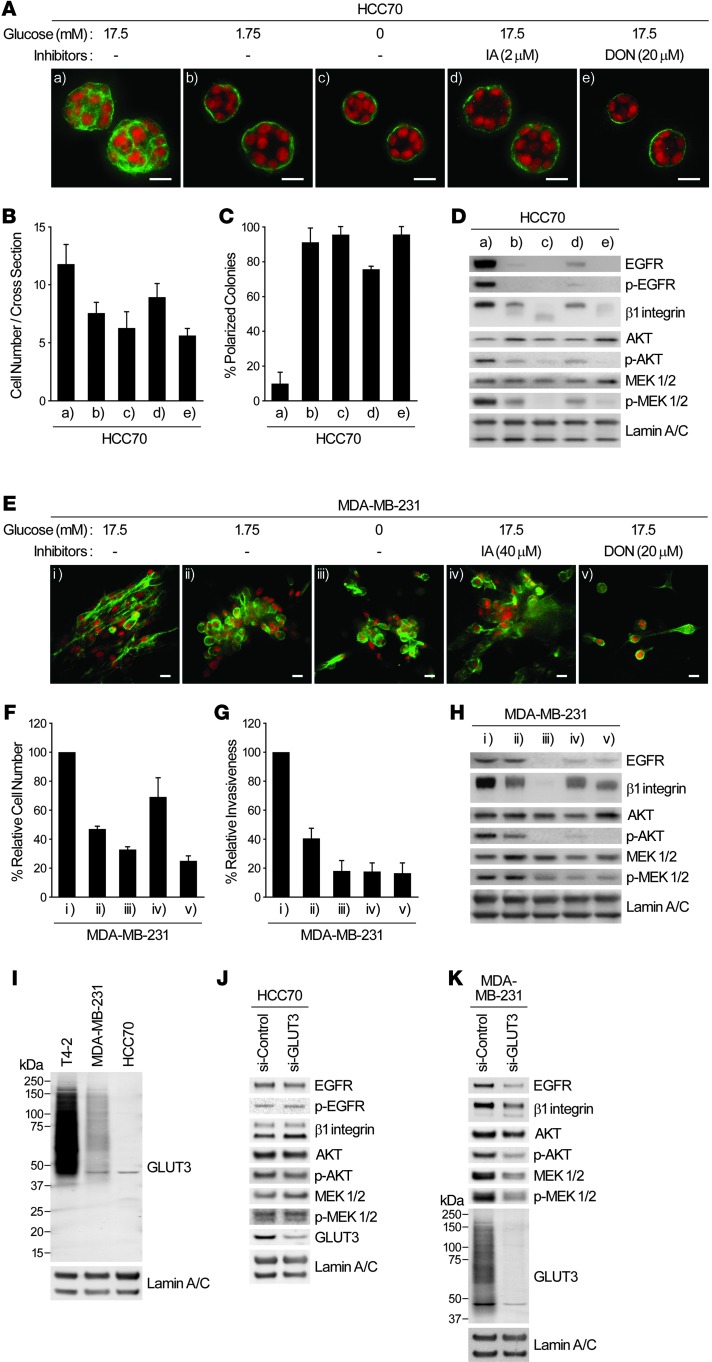
To ascertain the generality of the above findings, we examined 2 additional human breast cancer cell lines, HCC70 and MDA-MB-231, which display distinct phenotypes in 3D lrECM (41). When HCC70 cultures were deprived of glucose or treated with IA or DON, the reversion phenotype was similar to that obtained with T4-2 cells (Figure 10, A–D). In the highly metastatic MDA-MB-231 cells, the altered phenotype was still substantial, but somewhat incomplete, as we previously reported for reversion using EGFR inhibitors and other reverting agents (24). There were also appreciable decreases in proliferation, invasive properties, and other traits (Figure 10, E–H). Consistent with the expression level of GLUT3 in the 2 cell lines, its knockdown led to suppression of oncogenic signaling activities in MDA-MB-231 cells, but not HCC70 cells (Figure 10, I–K). These results showed that the master regulator for the malignant phenotype here is the high level of sugar uptake and metabolism, rather than the specific glucose transporter.
Figure 10. Other breast cancer cell lines also exhibit suppression of malignant phenotype when glucose uptake and metabolism are inhibited.
(A–D) HCC70 cells were cultured in 3D lrECM with 0, 1.75, or 17.5 mM glucose in the presence or absence of 2 μM IA or 20 μM DON. (A) Confocal IF images. Green, α6 integrin; red, nuclei. Scale bars: 20 μm. (B) Cell number at the colony midsection. (C) Percent colonies with basal polarity. (D) Western blot of signaling intermediates. (E–H) MDA-MB-231 metastatic cells were cultured in 3D lrECM with 0, 1.75, or 17.5 mM glucose in the presence or absence of 40 μM IA or 20 μM DON. (E) Confocal IF images showing phalloidin staining. Green, β-actin; red, nuclei. Scale bars: 20 μm. (F) Total cell numbers, measured by DNA staining. (G) Invasive activity. (H) Western blot of signaling intermediates. (I) Protein expression of GLUT3 in the indicated breast cancer cell lines cultured in 3D lrECM. (J and K) Western blot of signaling intermediates in HCC70 (J) or MDA-MB-231 (K) cells transfected with control or GLUT3 siRNA. In B, C, F, and G, data are mean ± SD of triplicate experiments.
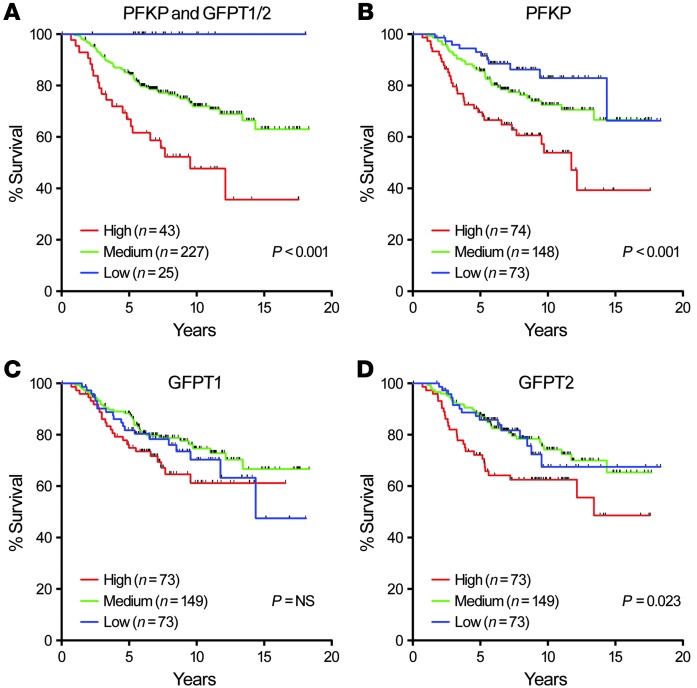
Our results from 3D cultures suggested that activation of both glycolysis and HBP is essential for induction and/or maintenance of canonical oncogenic pathways and, hence, malignant properties. We examined expression of PFKP and GFPT1/GFPT2, the rate-limiting enzymes of glycolysis and HBP, respectively, in a microarray dataset of 295 breast cancer patients (42). We found a significant correlation between the levels of these enzymes and poor prognosis; conversely, when expression levels of all 3 proteins were low, prognosis was very good (Figure 11A). Higher expression of PFKP or GFPT2 by themselves, but not GFPT1, also correlated with poor prognosis (Figure 11, B–D), although separation of survival curves of each group was not as clear as the combined analyses.
Figure 11. Analysis of previously published microarray dataset of samples from 295 breast cancer patients.
(A–D) Kaplan-Meier survival analysis of 295 breast cancers (45) classified as having high, medium, or low expression of PFKP, GFPT1, GFPT2, either together (A) or singly (B–D). P values were calculated using log-rank test.
Discussion
It was shown almost 3 decades ago that glucose metabolism is tissue specific (1, 43, 44) and that increased glucose transport could push chick embryo fibroblasts toward a pattern of glucose metabolism resembling virus-transformed cells, and vice versa (45). Whether altered glucose uptake and metabolism could by themselves modulate normal and malignant phenotype and signaling was not known, nor was the mechanism underlying these observations. Our present findings fill a fundamental gap in our current understanding of the mechanism by which glucose metabolism is involved in cancer. Using a physiologically relevant 3D assay and a breast cancer progression series (20, 28) as well as other breast cancer cell lines, we showed here that overexpression of a glucose transporter in a nonmalignant human breast epithelial cell disrupted polarity and formation of organized tissue-like acini in 3D cultures and upregulated canonical oncogenic signaling. Conversely, forced reduction of glucose uptake by breast cancer cells led to phenotypic reversion (19–26) of the malignant cells and downregulation of the oncogenic pathways. To our knowledge, this is the first report in which changed glucose uptake alone has been shown to have such profound consequences on the behavior of nonmalignant and malignant epithelial cells.
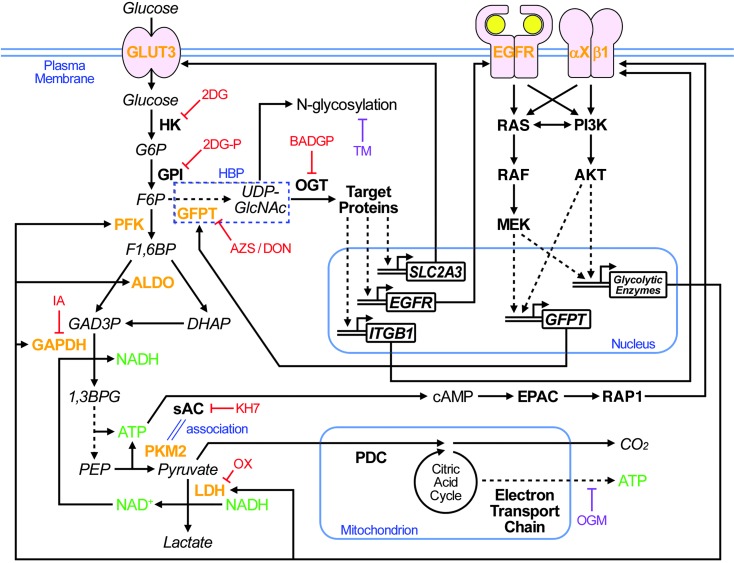
Taking full advantage of our 3D culture system, in which we could directly compare nonmalignant cells with their tumorigenic counterparts as well as with phenotypically reverted tumor cells, we identify 2 pathways/mechanisms with significant roles in the crosstalk between aerobic glycolysis and canonical oncogenic signaling (Figure 12). First, the glycolytic pathway between GAPDH and LDH was required for increased β1 integrin expression and downstream AKT activity. We showed a novel molecular interaction between PKM2 and sAC, linking production of ATP and its conversion to cAMP with consequent activation of the EPAC-RAP1 pathway (Figures 6 and 7). The mechanisms by which RAP1 regulates β1 integrin expression and signaling remain to be elucidated fully; however, another group also has shown that RAP1A regulates β1 integrin expression level in a cell line model of human colonic epithelia, derived from colorectal adenocarcinoma (46).
Figure 12. Reciprocal interactions between increased glucose uptake/metabolism and other signaling pathways.
Extracellular glucose is taken up by glucose transporters, including GLUT3, as well as by diffusion and is metabolized by hexokinase (HK) and glucose-6-phosphate isomerase (GPI) to enter different metabolic pathways. The glycolytic pathway includes subsequent steps mediated by PFK, ALDO, and GAPDH; LDH also supports the glycolytic pathway by production of the GAPDH coenzyme NAD+. These enzymes were all upregulated in T4-2 cells, leading to loss of integration of form and function. The sAC-EPAC-RAP1 pathway regulates β1 integrin positively, most likely via a direct link between ATP production in the glycolytic pathway and cAMP generation by sAC, which is mediated by tumor-specific PKM2-sAC association. HBP (dashed outline) is rate-limited by GFPT, which is also upregulated via activation of oncogenic signaling. Downstream O-GlcNAcylation of target proteins mediated by OGT regulates β1 integrin, EGFR, and GLUT3 expression. Inhibition of any of the key metabolic enzymes or the key signaling molecules results in suppression of all the others, reestablishment of the polarized acinar structure, and growth arrest. See Results and Discussion for details. Fonts distinguish metabolites (italic), proteins (bold), and genes (bold and italic). Colored text highlights proteins upregulated in T4-2 cells (orange), energy carrier molecules (green), and chemical reagents that do (red) or do not (purple) induce phenotypic reversion. 2DGP, 2DG-phosphate; G6P, glucose-6-phosphate; F1,6BP, fructiose-1,6-bisphosphate; GAD3P, glyceraldehyde-3-phosphate; DHAP, dihydroxyacetone phosphate; 1,3BPG, 1,3-bisphosphoglycerate; GlcNAc, N-acetylglucosamine.
The second crucial pathway between glucose metabolism and canonical oncogenic signaling that we uncovered here was HBP. Inhibition of this pathway was sufficient to induce suppression of all oncogenic signaling measured, including EGFR and β1 integrin pathways and aerobic glycolysis, resulting in complete phenotypic reversion of tumor cells in 3D lrECM gels. GFPT, the rate-limiting enzyme of HBP, was shown in 1995 to be regulated at the transcriptional level downstream of EGF signaling in breast cancer cell line MDA-MB-468 (47). Here, we measured expression and activity of EGFR as well as β1 integrin, AKT, and MEK as essential oncogenic pathways in breast cancer. Suppression of any of these molecules in 3D led to suppression of all others, as well as GPFT (Figure 8A and Supplemental Figure 1A). Of the 2 HBP branch pathways (Figure 12), inhibition of O-GlcNAcylation, but not N-linked glycosylation, was sufficient to cause phenotypic reversion. There was significant suppression of EGFR, ITGB1, and SLC2A3 mRNA expression by inhibiting either HBP or O-GlcNAcylation (Figure 8 and Supplemental Figure 7).
Importantly, the mechanism of the reciprocity shown here was 3D-specific: treatment with the same metabolic inhibitors that reverted the malignant phenotype in 3D induced no measurable suppression of the key oncogenic signaling in 2D cultures (Supplemental Figure 9A). Similarly, GLUT3 overexpression, which led to malignant-like phenotype in S1 cells, did not change signaling activity or morphology of S1 cells in 2D (data not shown). More astonishingly, despite more than 100-fold higher GLUT3 in T4-2 compared with S1 cells even in 2D, there were no statistically significant difference in glucose uptake (Supplemental Figure 9B). Thus, glucose metabolic pathways require 3D contexts in order to retain their physiological/pathological function in situ. The interdependence of form and function in regulating glucose metabolism parallels our previous findings for other oncogenic signaling in which integration occurs in the context of 3D architecture, but rarely in 2D monolayers (19, 25, 48).
The 3D culture systems of both rodents and human mammary epithelial cells were developed to allow analysis of molecular events and morphological properties to understand how glandular organs maintain homeostasis in physiological conditions (17, 49). Mouse mammary cells that would lose their tissue-specific structure and functions in 2D cultures on plastic retain the ability to produce milk proteins such as β-casein in 3D (49–53). In addition, 3D assays can be used to measure drug resistance (26, 54) and/or probe how tissues achieve quiescence (55). It is also noteworthy that our findings in tumor cells in 3D assays correlate well with findings in breast cancer patients (Figure 11 and refs. 22, 56) and with tumor architecture formed by cells in vivo (41). Most likely, we would not have discovered how glucose metabolism integrates with other oncogenic signaling pathways had we used tissue culture plastic to cultivate these same epithelial cells. It is also relevant that phenotypic reversion in the 3D lrECM cultures is not simply due to growth arrest, but rather to reacquisition of tissue polarity, as we have repeatedly shown here and elsewhere (Figure 6, Supplemental Figure 4, and refs. 15, 19, 23, 26, 57).
The signaling mechanisms triggered by glucose metabolism have been widely investigated in a number of diseases, such as diabetes. There is also ample evidence — starting with Warburg’s findings (2) — that tumors require more aerobic glycolysis and, more recently, that oncogenic pathways will increase glucose uptake and metabolism, interpreted as a necessary step for increased growth and increased energy production for tumors (6–8). The reverse (i.e., a direct causative role of increased glucose uptake and its relation to metabolic patterns) was originally reported in chick embryo fibroblasts and their RSV-transformed counterparts more than 3 decades ago, as discussed above. We believe ours is the first mechanistic study to shed light on how a breakdown in homeostasis of sugar uptake and its metabolic signaling could be instrumental in malignant progression.
The connection between metabolic pathways and cellular function has been studied in detail in glucose-sensing pancreatic β cells: increased glucose metabolism leads to a rise in ATP/AMP ratios, membrane depolarization by closure of ATP-sensitive K+ channels, activation of voltage-dependent Ca2+ channels, and insulin secretion (reviewed in ref. 14). In this context, Levin and colleagues also invoke cAMP signaling (34, 58). Their data indicate that, due to the relatively low affinity of sAC for ATP, the enzyme activity is sensitive to cellular ATP concentration. sAC is known to localize to mitochondria (59, 60), suggesting the possibility that mitochondrial ATP synthesis may be linked to sAC-mediated cAMP generation and downstream signaling. Not surprisingly, however, and given the organ specificity of signaling, our results for breast tumor cells in the 3D lrECM oncogenesis model showed that mitochondrial activity was hardly impaired and that direct inhibition of mitochondrial ATP synthesis did not induce phenotypic reversion of cancer cells (Figure 1, D and J, Figure 8F, and Supplemental Figure 4, I–K). Thus, activation of oncogenic signaling by sAC in breast cancer cells in 3D should not be expected to be regulated by mitochondrial ATP production. Since we showed that sAC associated with PKM2 (Figure 7, H and I), we expected that ATP production by PKM2 would be linked directly to sAC-mediated conversion of ATP to cAMP. Our results using PKM2 or sAC siRNA suggested that this is indeed the case (Figure 7J). The effect of PKM2-sAC association on the enzymatic activities of these 2 proteins remains to be elucidated.
The literature indicates that the protein level of PKM2 is frequently increased in cancer cells, whereas that of PKM1 is reduced (35, 61). PKM2 preferentially forms enzymatically inactive dimers, whereas PKM1 forms stably active tetramers (35). Thus, switching to PKM2 from PKM1 is thought to result in reduction of PEP metabolism and accumulation of glycolytic intermediates upstream of PEP, increasing the anabolic processes required for rapidly proliferating cancer cells (8). Therefore, high PK activity is thought to be tumor-suppressive, rather than -supportive. This was previously shown to be the case when small-molecule agents that induce formation of constitutively active PKM2 tetramers suppressed tumor growth (62). On the other hand, the findings of 2 other studies suggest additional complexity: PKM2 inhibitors were also shown to suppress malignant properties of cancer cells (63, 64), which indicates that PKM2 has tumor-supportive roles as well.
Our data suggested that ATP production by PKM2 is directly linked to cAMP production by virtue of its association with sAC, which resulted in oncogenic activation and a malignant phenotype (Figure 7). These findings provide a new molecular mechanism that could explain how PKM2 enzymatic activity is tumor-supportive. It should be noted that PKM2 activity, which can be tumor-suppressive, need not be very high to achieve the mechanism we suggest here: once activated by sAC-generated cAMP, EPAC would continue GDP/GTP exchange on RAP1 molecules, and downstream signaling could be amplified without increasing PEP metabolism by PKM2. Our findings and interpretations are easily compatible with — and fill the gaps in — previous findings. In 3D cultures, PKM2 levels were highly increased in malignant T4-2 cells, but PKM1, rather than going down (switching hypothesis; refs. 35, 61), actually goes up, albeit at a lower level than PKM2. Concomitant increases of PKM1 and PKM2 in oncogenesis were also shown previously (65).
AMPK, mTOR, and HBP have been referred to in the literature as the “well-established, nutrient signaling pathways” (reviewed in refs. 12, 66). The involvement of the first 2 pathways in cancer have been studied and reported extensively. However, our data obtained in 3D cultures showed that these pathways, as well as HIFs, were not important players in inducing oncogenic signaling by increased glucose uptake and metabolism in breast cells (Figure 4 and Supplemental Figure 3). The roles of HBP have been investigated largely in diabetes. Increased carbon flux into HBP was previously shown to suppress insulin-induced glucose uptake and to increase the storage of glucose as glycogen and lipids in adipose tissue and muscle, resulting in insulin resistance (12). Our present data showed that in 3D colonies of breast cancer cells, HBP did the opposite of diabetes, even in the presence of insulin: increased glucose uptake was dependent on increased HBP activity (Figure 8). Recently, essential roles of HBP and downstream O-GlcNAcylation in human cancers have been reported (67). However, whereas OGT inhibition by BADGP or siRNA led to suppression of canonical oncogenic signaling, including AKT, in our 3D cultures of breast cancer cells (Figure 8 and Supplemental Figure 7), OGT inhibition by siRNA in ErbB2-expressing mammary epithelial cells in 2D plastic culture did not reduce activity of ErbB2, ERK, or AKT (67), further highlighting the importance of microenvironment. Others also reported that in hematopoietic cells, surface expression and downstream signaling of IL-3Rα is dependent on N-linked glycosylation, another downstream pathway of HBP (68). However, direct inhibition of N-linked glycosylation in 3D cultures of mammary tumor cells did not result in strong reduction of signaling or complete phenotypic reversion (Figure 8). These findings indicate that crosstalk between glucose metabolism and canonical oncogenic signaling should be examined in the proper context for each intermediate molecule. O-GlcNAcylation of some proteins was observed only in malignant cells, and glucose deprivation or inhibition of HBP or OGT significantly reduced tumor-specific O-GlcNAcylation in 3D cultures (Figure 8). We suggest that proteins that are O-GclNAcylated in a tumor-specific, glucose-dependent manner play important roles in malignant progression.
Curiously, Warburg’s original hypothesis that aerobic glycolysis itself could be the “origin of cancer cells” (2) had not been proven directly. Our findings provide a hitherto-undescribed direct role of increased aerobic glycolysis in inducing the cancer phenotype, in which increased glycolytic activity regulates the canonical oncogenic pathways dynamically and reciprocally (Figure 12). These results may provide additional evidence for how hyperglycemia in diseases such as obesity and diabetes could provide a microenvironment that results in higher risk of some cancers (69, 70). Additionally, our findings may explain how small molecules, such as metformin (used for treatment of diabetes and known to lower blood glucose levels), decrease the risk and mortality of several types of cancers (69, 71). The metabolic pathways and the molecular interactions identified here highlight the importance of context in studying pathways involved in tissue specificity and disease. Our present findings may also provide additional targets for cancer therapy and shed additional light on the relationship between metabolic diseases and cancer.
Methods
Further information can be found in Supplemental Methods.
Cell culture in 2D and 3D.
HMT-3522 cells were cultured on tissue culture plastic (2D) and in 3D lrECM gels with H14 medium, a 1:1 mix of DMEM/F12 (UCSF Cell Culture Facility) supplemented with 250 ng/ml insulin, 10 μg/ml transferrin, 2.6 ng/ml sodium selenite, 0.1 nM β-estradiol, 1.4 μM hydrocortisone, and 5 μg/ml prolactin, but no serum. S1 cells were additionally supplemented with 10 ng/ml EGF. MDA-MB-231 and HCC70 cells were cultured in DMEM and RPMI1640, respectively, and were supplemented with 10% FBS.
For 3D lrECM cultures, S1 and T4-2 cells were seeded at 840,000 and 600,000 cells/cm3, respectively, in lrECM gel (Cultrex) overlaid with H14 medium. MDA-MB-231 and HCC70 cells were seeded at 625,000 cells/cm3 and overlaid with H14 medium supplemented with 1% FBS. Culture medium was replaced with fresh medium every other day, and cells were used for each assay after 10 days, unless otherwise indicated.
For experiments that needed to be done in the shorter term (e.g., cultures of siRNA-transfected cells or live imaging), cells were seeded at 60,000 cells/cm2 on top (3D-OT) of lrECM gels overlaid with H14 medium containing 5% (v/v) lrECM. Cells were harvested after 3 days.
Chemicals, inhibitory antibodies, and metabolic intermediates.
Chemicals and inhibitory antibodies were as follows: anti–β1 integrin (clone AIIB2; Aragen Bioscience); anti-EGFR (clone mAb225; Oncogene); AG1478, LY294002, and GM6001 (Calbiochem); PD98059 (New England Biolabs); and KH7 (Cayman Chemical). All other reagents and metabolic intermediates were purchased from Sigma-Aldrich.
Statistics.
In all experiments, statistical significance was determined by 2-tailed Student’s t test. A P value less than 0.05 was considered statistically significant.
Accession number.
Microarray data have been deposited in GEO (accession no. GSE50444).
Supplementary Material
Acknowledgments
The authors thank Saori Furuta, Ramray Bhat, Ren Xu, and Irene Kuhn from the Bissell laboratory and Carolyn Bertozzi and Mike Boyce for helpful suggestions and stimulating discussions; Eva Lee, Alvin Lo, and Atsuko Saito for excellent technical assistance; and Hisataka Sabe, Hiroki Shirato, and Masayori Ishikawa for continued support and encouragement. Y. Onodera was supported by a postdoctoral fellowship, Uehara Memorial Foundation (Tokyo, Japan). The work from M.J. Bissell’s laboratory is supported by grants from the U.S. Department of Energy, Office of Biological and Environmental Research Low Dose Radiation Program (contract no. DE-AC02-05CH1123); by National Cancer Institute awards R37CA064786, U54CA126552, and U54CA143836; by a U.S. Department of Defense Innovator Award (W81XWH0810736); and in part by a grant from The Breast Cancer Research Foundation. The work by Y. Onodera is supported also by Grant-in-Aid from Japan Society for Young Scientists (B) from Japan Society for the Promotion of Science (22700868); and the Creation of Innovation Centers for Advanced Interdisciplinary Research Areas Program, Ministry of Education, Culture, Sports, Sciences and Technology, Japan.
Footnotes
Conflict of interest: The authors have declared that no conflict of interest exists.
Citation for this article: J Clin Invest. 2014;124(1):367–384. doi:10.1172/JCI63146.
References
- 1.Bissell MJ. The differentiated state of normal and malignant cells or how to define a “normal” cell in culture. Int Rev Cytol. 1981;70:27–100. doi: 10.1016/s0074-7696(08)61130-4. [DOI] [PubMed] [Google Scholar]
- 2.Warburg O. On the origin of cancer cells. Science. 1956;123(3191):309–314. doi: 10.1126/science.123.3191.309. [DOI] [PubMed] [Google Scholar]
- 3.Bissell MJ, Rambeck WA, White RC, Bassham JA. Glycerol phosphate shuttle in virus-transformed cells in culture. Science. 1976;191(4229):856–858. doi: 10.1126/science.175441. [DOI] [PubMed] [Google Scholar]
- 4.Frezza C, Gottlieb E. Mitochondria in cancer: not just innocent bystanders. Semin Cancer Biol. 2009;19(1):4–11. doi: 10.1016/j.semcancer.2008.11.008. [DOI] [PubMed] [Google Scholar]
- 5.Koppenol WH, Bounds PL, Dang CV. Otto Warburg’s contributions to current concepts of cancer metabolism. Nat Rev Cancer. 2011;11(5):325–337. doi: 10.1038/nrc3038. [DOI] [PubMed] [Google Scholar]
- 6.Kroemer G, Pouyssegur J. Tumor cell metabolism: cancer’s Achilles’ heel. Cancer Cell. 2008;13(6):472–482. doi: 10.1016/j.ccr.2008.05.005. [DOI] [PubMed] [Google Scholar]
- 7.Levine AJ, Puzio-Kuter AM. The control of the metabolic switch in cancers by oncogenes and tumor suppressor genes. Science. 2010;330(6009):1340–1344. doi: 10.1126/science.1193494. [DOI] [PubMed] [Google Scholar]
- 8.Vander Heiden MG, Cantley LC, Thompson CB. Understanding the Warburg effect: the metabolic requirements of cell proliferation. Science. 2009;324(5930):1029–1033. doi: 10.1126/science.1160809. [DOI] [PMC free article] [PubMed] [Google Scholar]
- 9.Gatenby RA, Gillies RJ. Why do cancers have high aerobic glycolysis? Nat Rev Cancer. 2004;4(11):891–899. doi: 10.1038/nrc1478. [DOI] [PubMed] [Google Scholar]
- 10.Bensaad K, et al. TIGAR, a p53-inducible regulator of glycolysis and apoptosis. Cell. 2006;126(1):107–120. doi: 10.1016/j.cell.2006.05.036. [DOI] [PubMed] [Google Scholar]
- 11.Vaughn AE, Deshmukh M. Glucose metabolism inhibits apoptosis in neurons and cancer cells by redox inactivation of cytochrome c. Nat Cell Biol. 2008;10(12):1477–1483. doi: 10.1038/ncb1807. [DOI] [PMC free article] [PubMed] [Google Scholar]
- 12.Marshall S. Role of insulin, adipocyte hormones, and nutrient-sensing pathways in regulating fuel metabolism and energy homeostasis: a nutritional perspective of diabetes, obesity, and cancer. Sci STKE. 2006;2006(346):re7. doi: 10.1126/stke.3462006re7. [DOI] [PubMed] [Google Scholar]
- 13.Marty N, Dallaporta M, Thorens B. Brain glucose sensing, counterregulation, and energy homeostasis. Physiology (Bethesda). 2007;22:241–251. doi: 10.1152/physiol.00010.2007. [DOI] [PubMed] [Google Scholar]
- 14.Schuit FC, Huypens P, Heimberg H, Pipeleers DG. Glucose sensing in pancreatic beta-cells: a model for the study of other glucose-regulated cells in gut, pancreas, and hypothalamus. Diabetes. 2001;50(1):1–11. doi: 10.2337/diabetes.50.1.1. [DOI] [PubMed] [Google Scholar]
- 15.Nelson CM, Bissell MJ. Of extracellular matrix, scaffolds, and signaling: tissue architecture regulates development, homeostasis, and cancer. Annu Rev Cell Dev Biol. 2006;22:287–309. doi: 10.1146/annurev.cellbio.22.010305.104315. [DOI] [PMC free article] [PubMed] [Google Scholar]
- 16.Bissell MJ, Hines WC. Why don’t we get more cancer? A proposed role of the microenvironment in restraining cancer progression. Nat Med. 2011;17(3):320–329. doi: 10.1038/nm.2328. [DOI] [PMC free article] [PubMed] [Google Scholar]
- 17.Petersen OW, Ronnov-Jessen L, Howlett AR, Bissell MJ. Interaction with basement membrane serves to rapidly distinguish growth and differentiation pattern of normal and malignant human breast epithelial cells. Proc Natl Acad Sci U S A. 1992;89(19):9064–9068. doi: 10.1073/pnas.89.19.9064. [DOI] [PMC free article] [PubMed] [Google Scholar]
- 18.Briand P, Petersen OW, Van Deurs B. A new diploid nontumorigenic human breast epithelial cell line isolated and propagated in chemically defined medium. In Vitro Cell Dev Biol. 1987;23(3):181–188. doi: 10.1007/BF02623578. [DOI] [PubMed] [Google Scholar]
- 19.Beliveau A, et al. Raf-induced MMP9 disrupts tissue architecture of human breast cells in three-dimensional culture and is necessary for tumor growth in vivo. Genes Dev. 2010;24(24):2800–2811. doi: 10.1101/gad.1990410. [DOI] [PMC free article] [PubMed] [Google Scholar]
- 20.Weaver VM, et al. Reversion of the malignant phenotype of human breast cells in three-dimensional culture and in vivo by integrin blocking antibodies. J Cell Biol. 1997;137(1):231–245. doi: 10.1083/jcb.137.1.231. [DOI] [PMC free article] [PubMed] [Google Scholar]
- 21.Itoh M, Nelson CM, Myers CA, Bissell MJ. Rap1 integrates tissue polarity, lumen formation, and tumorigenic potential in human breast epithelial cells. Cancer Res. 2007;67(10):4759–4766. doi: 10.1158/0008-5472.CAN-06-4246. [DOI] [PMC free article] [PubMed] [Google Scholar]
- 22.Kenny PA, Bissell MJ. Targeting TACE-dependent EGFR ligand shedding in breast cancer. J Clin Invest. 2007;117(2):337–345. doi: 10.1172/JCI29518. [DOI] [PMC free article] [PubMed] [Google Scholar]
- 23.Liu H, Radisky DC, Wang F, Bissell MJ. Polarity and proliferation are controlled by distinct signaling pathways downstream of PI3-kinase in breast epithelial tumor cells. J Cell Biol. 2004;164(4):603–612. doi: 10.1083/jcb.200306090. [DOI] [PMC free article] [PubMed] [Google Scholar]
- 24.Wang F, et al. Phenotypic reversion or death of cancer cells by altering signaling pathways in three-dimensional contexts. J Natl Cancer Inst. 2002;94(19):1494–1503. doi: 10.1093/jnci/94.19.1494. [DOI] [PMC free article] [PubMed] [Google Scholar]
- 25.Wang F, et al. Reciprocal interactions between beta1-integrin and epidermal growth factor receptor in three-dimensional basement membrane breast cultures: a different perspective in epithelial biology. Proc Natl Acad Sci U S A. 1998;95(25):14821–14826. doi: 10.1073/pnas.95.25.14821. [DOI] [PMC free article] [PubMed] [Google Scholar]
- 26.Weaver VM, et al. beta4 integrin-dependent formation of polarized three-dimensional architecture confers resistance to apoptosis in normal and malignant mammary epithelium. Cancer Cell. 2002;2(3):205–216. doi: 10.1016/S1535-6108(02)00125-3. [DOI] [PMC free article] [PubMed] [Google Scholar]
- 27.Godoy A, et al. Differential subcellular distribution of glucose transporters GLUT1-6 and GLUT9 in human cancer: ultrastructural localization of GLUT1 and GLUT5 in breast tumor tissues. J Cell Physiol. 2006;207(3):614–627. doi: 10.1002/jcp.20606. [DOI] [PubMed] [Google Scholar]
- 28.Rizki A, et al. A human breast cell model of preinvasive to invasive transition. Cancer Res. 2008;68(5):1378–1387. doi: 10.1158/0008-5472.CAN-07-2225. [DOI] [PMC free article] [PubMed] [Google Scholar]
- 29.Shackelford DB, Shaw RJ. The LKB1-AMPK pathway: metabolism and growth control in tumour suppression. Nat Rev Cancer. 2009;9(8):563–575. doi: 10.1038/nrc2676. [DOI] [PMC free article] [PubMed] [Google Scholar]
- 30.Sarbassov DD, et al. Prolonged rapamycin treatment inhibits mTORC2 assembly and Akt/PKB. Mol Cell. 2006;22(2):159–168. doi: 10.1016/j.molcel.2006.03.029. [DOI] [PubMed] [Google Scholar]
- 31.Dupuy AG, L’Hoste S, Cherfils J, Camonis J, Gaudriault G, de Gunzburg J. Novel Rap1 dominant-negative mutants interfere selectively with C3G and Epac. Oncogene. 2005;24(28):4509–4520. doi: 10.1038/sj.onc.1208647. [DOI] [PubMed] [Google Scholar]
- 32.Enserink JM, et al. A novel Epac-specific cAMP analogue demonstrates independent regulation of Rap1 and ERK. Nat Cell Biol. 2002;4(11):901–906. doi: 10.1038/ncb874. [DOI] [PubMed] [Google Scholar]
- 33.Kamenetsky M, Middelhaufe S, Bank EM, Levin LR, Buck J, Steegborn C. Molecular details of cAMP generation in mammalian cells: a tale of two systems. J Mol Biol. 2006;362(4):623–639. doi: 10.1016/j.jmb.2006.07.045. [DOI] [PMC free article] [PubMed] [Google Scholar]
- 34.Ramos LS, Zippin JH, Kamenetsky M, Buck J, Levin LR. Glucose and GLP-1 stimulate cAMP production via distinct adenylyl cyclases in INS-1E insulinoma cells. J Gen Physiol. 2008;132(3):329–338. doi: 10.1085/jgp.200810044. [DOI] [PMC free article] [PubMed] [Google Scholar]
- 35.Mazurek S, Boschek CB, Hugo F, Eigenbrodt E. Pyruvate kinase type M2 and its role in tumor growth and spreading. Semin Cancer Biol. 2005;15(4):300–308. doi: 10.1016/j.semcancer.2005.04.009. [DOI] [PubMed] [Google Scholar]
- 36.Goldberg MS, Sharp PA. Pyruvate kinase M2-specific siRNA induces apoptosis and tumor regression. J Exp Med. 2012;209(2):217–224. doi: 10.1084/jem.20111487. [DOI] [PMC free article] [PubMed] [Google Scholar]
- 37.Gao X, Wang H, Yang JJ, Liu X, Liu ZR. Pyruvate kinase M2 regulates gene transcription by acting as a protein kinase. Mol Cell. 2012;45(5):598–609. doi: 10.1016/j.molcel.2012.01.001. [DOI] [PMC free article] [PubMed] [Google Scholar]
- 38.Yang W, et al. PKM2 phosphorylates histone H3 and promotes gene transcription and tumorigenesis. Cell. 2012;150(4):685–696. doi: 10.1016/j.cell.2012.07.018. [DOI] [PMC free article] [PubMed] [Google Scholar]
- 39.Park J, Kwon H, Kang Y, Kim Y. Proteomic analysis of O-GlcNAc modifications derived from streptozotocin and glucosamine induced beta-cell apoptosis. J Biochem Mol Biol. 2007;40(6):1058–1068. doi: 10.5483/BMBRep.2007.40.6.1058. [DOI] [PubMed] [Google Scholar]
- 40.Issad T, Kuo M. O-GlcNAc modification of transcription factors, glucose sensing and glucotoxicity. Trends Endocrinol Metab. 2008;19(10):380–389. doi: 10.1016/j.tem.2008.09.001. [DOI] [PubMed] [Google Scholar]
- 41.Kenny PA, et al. The morphologies of breast cancer cell lines in three-dimensional assays correlate with their profiles of gene expression. Mol Oncol. 2007;1(1):84–96. doi: 10.1016/j.molonc.2007.02.004. [DOI] [PMC free article] [PubMed] [Google Scholar]
- 42.van de Vijver MJ, et al. A gene-expression signature as a predictor of survival in breast cancer. N Engl J Med. 2002;347(25):1999–2009. doi: 10.1056/NEJMoa021967. [DOI] [PubMed] [Google Scholar]
- 43.Bissell MJ, Hatie C, Rubin H. Patterns of glucose metabolism in normal and virus-transformed chick cells in tissue culture. J Natl Cancer Inst. 1972;49(2):555–565. [PubMed] [Google Scholar]
- 44.Bissell MJ, White RC, Hatie C, Bassham JA. Dynamics of metabolism of normal and virus-transformed chick cells in culture. Proc Natl Acad Sci U S A. 1973;70(10):2951–2955. doi: 10.1073/pnas.70.10.2951. [DOI] [PMC free article] [PubMed] [Google Scholar]
- 45.Bissell MJ. Transport as a rate limiting step in glucose metabolism in virus-transformed cells: studies with cytochalasin B. J Cell Physiol. 1976;89(4):701–709. doi: 10.1002/jcp.1040890430. [DOI] [PubMed] [Google Scholar]
- 46.Severson EA, Lee WY, Capaldo CT, Nusrat A, Parkos CA. Junctional adhesion molecule A interacts with Afadin and PDZ-GEF2 to activate Rap1A, regulate beta1 integrin levels, and enhance cell migration. Mol Biol Cell. 2009;20(7):1916–1925. doi: 10.1091/mbc.E08-10-1014. [DOI] [PMC free article] [PubMed] [Google Scholar]
- 47.Paterson AJ, Kudlow JE. Regulation of glutamine:fructose-6-phosphate amidotransferase gene transcription by epidermal growth factor and glucose. Endocrinology. 1995;136(7):2809–2816. doi: 10.1210/en.136.7.2809. [DOI] [PubMed] [Google Scholar]
- 48.Muthuswamy SK, Li D, Lelievre S, Bissell MJ, Brugge JS. ErbB2, but not ErbB1, reinitiates proliferation and induces luminal repopulation in epithelial acini. Nat Cell Biol. 2001;3(9):785–792. doi: 10.1038/ncb0901-785. [DOI] [PMC free article] [PubMed] [Google Scholar]
- 49.Barcellos-Hoff MH, Aggeler J, Ram TG, Bissell MJ. Functional differentiation and alveolar morphogenesis of primary mammary cultures on reconstituted basement membrane. Development. 1989;105(2):223–235. doi: 10.1242/dev.105.2.223. [DOI] [PMC free article] [PubMed] [Google Scholar]
- 50.Li ML, Aggeler J, Farson DA, Hatier C, Hassell J, Bissell MJ. Influence of a reconstituted basement membrane and its components on casein gene expression and secretion in mouse mammary epithelial cells. Proc Natl Acad Sci U S A. 1987;84(1):136–140. doi: 10.1073/pnas.84.1.136. [DOI] [PMC free article] [PubMed] [Google Scholar]
- 51.Muschler J, Lochter A, Roskelley CD, Yurchenco P, Bissell MJ. Division of labor among the alpha6beta4 integrin, beta1 integrins, and an E3 laminin receptor to signal morphogenesis and beta-casein expression in mammary epithelial cells. Mol Biol Cell. 1999;10(9):2817–2828. doi: 10.1091/mbc.10.9.2817. [DOI] [PMC free article] [PubMed] [Google Scholar]
- 52.Streuli CH, Bailey N, Bissell MJ. Control of mammary epithelial differentiation: basement membrane induces tissue-specific gene expression in the absence of cell-cell interaction and morphological polarity. J Cell Biol. 1991;115(5):1383–1395. doi: 10.1083/jcb.115.5.1383. [DOI] [PMC free article] [PubMed] [Google Scholar]
- 53.Xu R, Spencer VA, Bissell MJ. Extracellular matrix-regulated gene expression requires cooperation of SWI/SNF and transcription factors. J Biol Chem. 2007;282(20):14992–14999. doi: 10.1074/jbc.M610316200. [DOI] [PMC free article] [PubMed] [Google Scholar]
- 54.Weigelt B, Lo AT, Park CC, Gray JW, Bissell MJ. HER2 signaling pathway activation and response of breast cancer cells to HER2-targeting agents is dependent strongly on the 3D microenvironment. Breast Cancer Res Treat. 2010;122(1):35–43. doi: 10.1007/s10549-009-0502-2. [DOI] [PMC free article] [PubMed] [Google Scholar]
- 55.Spencer VA, et al. Depletion of nuclear actin is a key mediator of quiescence in epithelial cells. J Cell Sci. 2011;124(pt 1):123–132. doi: 10.1242/jcs.073197. [DOI] [PMC free article] [PubMed] [Google Scholar]
- 56.Fournier MV, et al. Gene expression signature in organized and growth-arrested mammary acini predicts good outcome in breast cancer. Cancer Res. 2006;66(14):7095–7102. doi: 10.1158/0008-5472.CAN-06-0515. [DOI] [PMC free article] [PubMed] [Google Scholar]
- 57.Bissell MJ, Kenny PA, Radisky DC. Microenvironmental regulators of tissue structure and function also regulate tumor induction and progression: the role of extracellular matrix and its degrading enzymes. Cold Spring Harb Symp Quant Biol. 2005;70:343–356. doi: 10.1101/sqb.2005.70.013. [DOI] [PMC free article] [PubMed] [Google Scholar]
- 58.Litvin TN, Kamenetsky M, Zarifyan A, Buck J, Levin LR. Kinetic properties of “soluble” adenylyl cyclase. Synergism between calcium and bicarbonate. J Biol Chem. 2003;278(18):15922–15926. doi: 10.1074/jbc.M212475200. [DOI] [PubMed] [Google Scholar]
- 59.Acin-Perez R, Salazar E, Brosel S, Yang H, Schon EA, Manfredi G. Modulation of mitochondrial protein phosphorylation by soluble adenylyl cyclase ameliorates cytochrome oxidase defects. EMBO Mol Med. 2009;1(8–9):392–406. doi: 10.1002/emmm.200900046. [DOI] [PMC free article] [PubMed] [Google Scholar]
- 60.Acin-Perez R, Salazar E, Kamenetsky M, Buck J, Levin LR, Manfredi G. Cyclic AMP produced inside mitochondria regulates oxidative phosphorylation. Cell Metab. 2009;9(3):265–276. doi: 10.1016/j.cmet.2009.01.012. [DOI] [PMC free article] [PubMed] [Google Scholar]
- 61.Christofk HR, et al. The M2 splice isoform of pyruvate kinase is important for cancer metabolism and tumour growth. Nature. 2008;452(7184):230–233. doi: 10.1038/nature06734. [DOI] [PubMed] [Google Scholar]
- 62.Anastasiou D, et al. Pyruvate kinase M2 activators promote tetramer formation and suppress tumorigenesis. Nat Chem Biol. 2012;8(10):839–847. doi: 10.1038/nchembio.1060. [DOI] [PMC free article] [PubMed] [Google Scholar]
- 63.Chen J, Xie J, Jiang Z, Wang B, Wang Y, Hu X. Shikonin and its analogs inhibit cancer cell glycolysis by targeting tumor pyruvate kinase-M2. Oncogene. 2011;30(42):4297–4306. doi: 10.1038/onc.2011.137. [DOI] [PubMed] [Google Scholar]
- 64.Vander Heiden MG, et al. Identification of small molecule inhibitors of pyruvate kinase M2. Biochem Pharmacol. 2010;79(8):1118–1124. doi: 10.1016/j.bcp.2009.12.003. [DOI] [PMC free article] [PubMed] [Google Scholar]
- 65.Bluemlein K, Gruning NM, Feichtinger RG, Lehrach H, Kofler B, Ralser M. No evidence for a shift in pyruvate kinase PKM1 to PKM2 expression during tumorigenesis. Oncotarget. 2011;2(5):393–400. doi: 10.18632/oncotarget.278. [DOI] [PMC free article] [PubMed] [Google Scholar]
- 66.Loewith R, Hall MN. Target of rapamycin (TOR) in nutrient signaling and growth control. Genetics. 2011;189(4):1177–1201. doi: 10.1534/genetics.111.133363. [DOI] [PMC free article] [PubMed] [Google Scholar]
- 67.Caldwell SA, et al. Nutrient sensor O-GlcNAc transferase regulates breast cancer tumorigenesis through targeting of the oncogenic transcription factor FoxM1. Oncogene. 2010;29(19):2831–2842. doi: 10.1038/onc.2010.41. [DOI] [PubMed] [Google Scholar]
- 68.Wellen KE, et al. The hexosamine biosynthetic pathway couples growth factor-induced glutamine uptake to glucose metabolism. Genes Dev. 2010;24(24):2784–2799. doi: 10.1101/gad.1985910. [DOI] [PMC free article] [PubMed] [Google Scholar]
- 69.Giovannucci E, et al. Diabetes and cancer: a consensus report. CA Cancer J Clin. 2010;60(4):207–221. doi: 10.3322/caac.20078. [DOI] [PubMed] [Google Scholar]
- 70.Hjartaker A, Langseth H, Weiderpass E. Obesity and diabetes epidemics: cancer repercussions. Adv Exp Med Biol. 2008;630:72–93. doi: 10.1007/978-0-387-78818-0_6. [DOI] [PubMed] [Google Scholar]
- 71.Bost F, Sahra IB, Le Marchand-Brustel Y, Tanti JF. Metformin and cancer therapy. Curr Opin Oncol. 2012;24(1):103–108. doi: 10.1097/CCO.0b013e32834d8155. [DOI] [PubMed] [Google Scholar]
Associated Data
This section collects any data citations, data availability statements, or supplementary materials included in this article.


