

Abstract
Introduction
Although brain rhythms depend on brain structure (e.g., gray and white matter), to our knowledge associations between brain oscillations and structure have not been investigated in healthy controls (HC) or in individuals with schizophrenia (SZ). Observing function–structure relationships, for example establishing an association between brain oscillations (defined in terms of amplitude or phase) and cortical gray matter, might inform models on the origins of psychosis. Given evidence of functional and structural abnormalities in primary/secondary auditory regions in SZ, the present study examined how superior temporal gyrus (STG) structure relates to auditory STG low-frequency and 40 Hz steady-state activity. Given changes in brain activity as a function of age, age-related associations in STG oscillatory activity were also examined.
Methods
Thirty-nine individuals with SZ and 29 HC were recruited. 40 Hz amplitude-modulated tones of 1 s duration were presented. MEG and T1-weighted sMRI data were obtained. Using the sources localizing 40 Hz evoked steady-state activity (300 to 950 ms), left and right STG total power and inter-trial coherence were computed. Time–frequency group differences and associations with STG structure and age were also examined.
Results
Decreased total power and inter-trial coherence in SZ were observed in the left STG for initial post-stimulus low-frequency activity (~ 50 to 200 ms, ~ 4 to 16 Hz) as well as 40 Hz steady-state activity (~ 400 to 1000 ms). Left STG 40 Hz total power and inter-trial coherence were positively associated with left STG cortical thickness in HC, not in SZ. Left STG post-stimulus low-frequency and 40 Hz total power were positively associated with age, again only in controls.
Discussion
Left STG low-frequency and steady-state gamma abnormalities distinguish SZ and HC. Disease-associated damage to STG gray matter in schizophrenia may disrupt the age-related left STG gamma-band function–structure relationships observed in controls.
Keywords: Schizophrenia, Auditory, Superior temporal gyrus, Theta, Alpha, Gamma, Magnetoencephalography
Highlights
-
•
Associations between brain oscillations and structure were investigated in SZ
-
•
The present study examined how superior temporal gyrus (STG) structure and agerelate to auditory STG low-frequency and 40 Hz steady-state activity
-
•
Decreased total power and inter-trial coherence in SZ were observed in the left STG for early low-frequency activity (~ 50 to 200 ms, ~ 4 to 16 Hz) as well as 40 Hz steady-state activity (~ 400 to 1000 ms)
-
•
Left STG 40 Hz total power and inter-trial coherence were positively associated with left STG cortical thickness in HC, not in SZ
-
•
Disease-associated damage to STG gray matter in schizophrenia may disrupt the age-related left STG function-structure relationships observed in controls.
1. Introduction
Accepting the hypothesis that functional and structural brain measures are more proximal to neurobiological mechanisms and/or pathways associated with schizophrenia (SZ) than overt behavioral measures, it is hoped that neuroimaging-based endophenotypes will identify biological mechanisms at the level of neural circuits (Miller and Rockstroh, 2013; Rasetti and Weinberger, 2011; Rose and Donohoe, 2013). Although brain rhythms depend on brain structure (e.g., gray and white matter), to our knowledge associations between brain oscillations and structure have not been investigated in healthy controls (HC) or in individuals with SZ. Given evidence of functional and structural abnormalities in primary/secondary auditory regions in SZ (reviewed below), and given that gray matter comprises the brain's fundamental units of information processing (neurons), the present study investigated associations between superior temporal gyrus (STG) oscillatory auditory processes and STG gray-matter cortical thickness to begin identifying neural oscillation and brain structure relationships in HC and SZ.
Studies examining evoked auditory measures (averaging brain activity over repetitions of stimuli) show clear evidence of auditory abnormalities in SZ (e.g., Rosburg et al., 2008; Smith et al., 2010; Turetsky et al., 2008). The time–frequency profile of neural activity associated with auditory processes in SZ is potentially more informative, as time–frequency analyses provide more detailed information, with abnormalities defined in terms of amplitude or phase abnormalities at a specific frequency in a specific time range (Edgar et al., 2008; Popov et al., 2011). Indeed, electroencephalography (EEG) time–frequency studies have shown that early auditory abnormalities in SZ are best characterized by increased low-frequency trial-to-trial synchrony, observed as decreased phase-locking (PL) in SZ (Blumenfeld and Clementz, 2001; Clementz and Blumenfeld, 2001; Jansen et al., 2004; Johannesen et al., 2005). Using source localization, such abnormalities can be described more precisely. For example, using magnetoencephalography (MEG) and source localization to examine auditory processes in left and right STG in 45 SZ and 45 HC subjects, Edgar et al. (2008) observed that individuals with SZ showed more low-frequency STG phase variability (high theta and alpha bilaterally, low beta left-hemisphere).
A growing literature also shows auditory processing abnormalities in SZ using driving stimuli, and almost all published EEG studies have observed 40 Hz steady-state abnormalities in SZ (Brenner et al., 2003; Hall et al., 2011; Hamm et al., 2012; Hong et al., 2004; Koenig et al., 2012; Krishnan et al., 2009; Kwon et al., 1999; Lenz et al., 2011; Light et al., 2006; Rass et al., 2012; Spencer et al., 2009). MEG steady-state studies applying source localization also show 40 Hz abnormalities in SZ. For example, Teale et al. (2008) observed decreased STG 40 Hz driving inter-trial coherence and evoked activity bilaterally in patients with SZ. In steady-state tasks, the early transient 50 ms and 100 ms auditory responses as well as the steady-state response can be examined (Jacobson and Fitzgerald, 1997; Pantev, 1995). In a recent study comparing early low-frequency and steady-state activity across several driving frequencies, Hamm et al. (2011) found that only low-frequency activity uniquely discriminated groups.
Considering STG structure, reduced STG volume and cortical thickness (CT) are among the most reliably observed structural brain abnormalities in SZ (Ehrlich et al., 2011; Mitelman and Buchsbaum, 2007; Shenton et al., 2001; Smiley et al., 2009). Although brain function and structure are inherently related, associations between STG gray-matter volume and auditory evoked responses have been examined in very few studies of SZ. Using EEG, less left posterior STG and left planum temporale GM were associated with smaller left temporal auditory P300 in SZ (McCarley et al., 1993, 2002). Similar associations were observed between reduced left Heschl's Gyrus GM and smaller Fz mismatch negativity (MMN) in first-episode SZ (Salisbury et al., 2007). Using MEG and examining function–structure associations in each hemisphere, Edgar et al. (2012) observed that in SZ and HC left STG GM was positively associated with left M100 source strength. Although the above studies are of interest, as previously noted auditory abnormalities in SZ are best described as decreased STG low-frequency phase-locking and decreased STG 40 Hz phase-locking for 40 Hz driving stimuli. To our knowledge, however, no study has examined associations between STG time–frequency measures and STG brain structure.
The present study measured associations between left and right STG auditory processes (early transient and 40 Hz steady-state activity) and STG gray matter to begin to assess the structural correlates of oscillatory activity in HC and SZ. Replicating previous studies, it was hypothesized that early low-frequency (~ 4 to 20 Hz) and sustained 40 Hz driving abnormalities would be observed in SZ. Second, building on studies reporting associations between auditory processes and STG gray matter, it was hypothesized that early low-frequency and sustained 40 Hz driving activity would be associated with STG gray-matter cortical thickness. However, given that STG gray-matter abnormalities in SZ are observed at the onset of the disease (see review by Steen et al., 2006), it was hypothesized that the associations between STG function and structure would be weaker in SZ than in HC, indicating a deterioration of function–structure relationships in SZ. Finally, given that gray-matter cortical thickness decreases with age (Lemaitre et al., 2012), analyses examined associations between age and STG functional measures.
2. Methods and materials
2.1. Subjects
Thirty-nine patients with chronic SZ (6 females) and 29 HC (7 females) were recruited. As shown in Table 1, groups did not differ in age or parental socioeconomic status (SES). Patients' SES was lower than controls', and patients were slightly less educated than controls. Patients' mean total scores on the Positive and Negative Syndrome Scale (PANSS) (Kay et al., 1987) were 17.79 for positive symptoms and 15.79 for negative symptoms. Recruitment procedures and information on inclusion and exclusion criteria are reported in Smith et al. (2010); there is no overlap in the subjects reported in Smith et al. and this study.
Table 1.
Demographic information (SES measures missing from a few subjects).
| HC (N = 29) |
SZ (N = 39) |
|||
|---|---|---|---|---|
| Mean | SD | Mean | SD | |
| Age | 37.90 | 10.88 | 40.87 | 12.62 |
| Education (years) | 14.58 | 1.52 | 13.15 | 2.16 |
| SES | 53.04 | 16.10 | 65.51 | 10.66 |
| Parental SES | 39.69 | 18.18 | 48.30 | 17.64 |
HC had higher SES, t(61) = 3.70, and more education, t(66) = 3.05 (ps < 0.01). Group differences in age, t(66) = 1.02, and parental SES, t(55) = − 1.80, were not significant (ps > 0.05).
Five HC and 2 SZ were left-handed as assessed by the Waterloo Handedness Questionnaire (Bryden, 1977). Patients with SZ were medicated and clinically stable without change in medications for at least three months before MEG. In the patient group, 28 subjects were treated with 2nd generation antipsychotics, four subjects were treated with the 1st generation antipsychotic haloperidol, five subjects treated with more than one antipsychotic, and two subjects were not taking medications. Thirteen subjects with SZ and 7 HC were smokers.
2.2. Steady-state task
The amplitude of a 500 Hz stimulus was modulated at 40 Hz. Stimuli of 1 s duration were binaurally presented with a 4 s ISI (± 2 s) through earphones placed in each ear canal. For each ear, the peak intensity of the click was presented 35 dB above each subject's hearing threshold. The number of steady-state stimuli presented depended on the MEG recording time available. MEG data were examined only from subjects with 50 + trials. The mean number of trials in the control group (range 51 to 125, mean = 84) and the SZ group (range 58 to 113 mean = 79) did not differ (t(66) = 1.11, p = 0.27).
2.3. Structural magnetic resonance imaging (sMRI)
T1-weighted MPRAGE structural MR images were collected on a Siemens 3T TIM Trio scanner at the Mind Research Network (MRN). Images were collected with a field-of-view (FOV) = 256 × 256 mm, 192 sagittal slices, and 1 × 1 × 1 mm spatial resolution. This was a five-echo sequence with echo times (TE) of 1.64, 3.5, 5.36, 7.22, and 9.08 ms, a repetition time (TR) = 2530 ms, a gray-white matter contrast enhancement inversion recovery time (TI) of 1200 ms, and 7° flip angle.
2.4. MEG, EEG, and sMRI data acquisition and coregistration
MEG data were recorded in a magnetically shielded room (Vacuumschmelze, Germany) using all channels of a 306-channel Vector-View MEG system (Elekta-Neuromag, Helsinki, Finland). After a band-pass filter (0.1–330 Hz), MEG signals were digitized at 1000 Hz. EEG data were recorded from 60 equidistant sites (Falk Minow Customized Easy Cap®). The left mastoid served as the EEG reference. Comparisons between EEG and MEG will be presented in a separate paper. Electro-oculogram (EOG) (vertical EOG on the upper and lower left sides) and electrocardiogram (ECG) (at the collarbone) were also obtained.
To coregister MEG and sMRI data, three anatomical landmarks (nasion and right and left preauriculars) as well as an additional 200 + points on the scalp and face were digitized for each subject using the Probe Position Identification (PPI) System (Polhemus, Colchester, VT). During the MEG recording, the subject's head position was monitored using four HPI coils attached to the scalp. To co-register the MEG and sMRI for each subject, the three fiducials were identified in the subject's sMRI, and a transformation matrix that involved rotation and translation between the MEG and sMRI coordinate systems was obtained by matching the 200 + points from the PPI measurements to the surface of the scalp and face from the sMRI using BrainVoyager QX (Brain Innovations, The Netherlands).
2.5. Magnetic source analysis
MEG raw signals were first processed with Signal Space Separation (SSS; Taulu et al., 2004) using Maxfilter (Elekta MaxfilterTM; Elekta Oy). SSS separates neuronal magnetic signals arising from inside the MEG sensor array from external magnetic signals arising from the surrounding environment to effectively reduce environmental noise and artifacts. Following SSS, eye-blink activity was corrected using the methods outlined in Berg and Scherg (1994). Epochs with artifacts other than blinks were rejected by amplitude and gradient criteria (amplitude > 1200fT/cm, gradient > 800fT/cm/sample).
Source localization and scoring were done blind to group. For source localization analyses, artifact-free epochs − 400 ms pre-stimulus to 1000 ms post-stimulus were defined from the continuous recording. Noncontaminated epochs were averaged, and a 40 Hz (width 20 Hz) band-pass filter applied. Determination of the location of the 40 Hz steady-state generators in the left and right hemispheres was accomplished by fitting a dipole source in each hemisphere using a realistic head model. For modeling the 40 Hz steady-state response, data 300 to 950 ms post-stimulus were selected. Left- and right-hemisphere responses were separately localized, with the MEG channels on the opposite hemisphere turned off. In 4 HC and 5 SZ the left STG 40 Hz response was not well localized (source strength less than 5 nA-m, or location > 15 mm from Heschl's Gyrus). In 1 SZ the right STG 40 Hz was not well localized. In these subjects, the ‘missing’ STG response was fixed at the analog of the localized contralateral response, with the ‘missing’ STG dipole oriented to optimally explain the variance in the 40 Hz response. Examining the full model (left + right STG sources + eye-blink source), goodness-of-fit values (300 to 950 ms period) for HC (mean = 78%, SD = 10.15) and SZ (mean = 76%, SD = 12.0) did not differ, t(66) = 0.74, n.s.
2.6. Source time–frequency analysis
The calculation of single-trial phase and magnitude for the left and right STG sources used procedures outlined in Hoechstetter et al. (2004) where in each subject the derived source model was applied to the raw unfiltered data. Transformation from the time domain to the time–frequency domain used complex demodulation procedures (Papp and Ktonas, 1977) implemented in BESA 5.3, using frequencies between 4 and 60 Hz, in steps of 2 Hz. Continuous data were analyzed relative to tone onset every 25 ms (i.e., each 40 Hz cycle), utilizing ± 39.4 ms and ± 2.83 Hz (full width at half maximum parameters) of contiguous data at each 25 ms step.
Total power and phase-locking measures were extracted from the single-trial complex time–frequency matrix. Total power is calculated by averaging the time–frequency spectra of each MEG epoch. When baseline power is subtracted, poststimulus total power assesses the poststimulus increase in the magnitude/power of oscillatory activity (temporal spectral evolution, TSE). A measure of phase-locking referred to as inter-trial coherence was computed as where the sum is over all N trials, and ϕ(k) is the phase of the signal at each time frequency bin (see below) in the kth trial. Inter-trial coherence (ITC) is a normalized measure with ITC = 1 reflecting no phase variability and ITC = 0 reflecting maximal phase variability across trials.
For all analyses involving time–frequency measures (i.e., t-tests and correlations), a clustering method controlled family-wise error (e.g., see Edgar et al., 2008, 2013). The method computes the probability of a random field of noise producing a cluster of adjacent time–frequency cells of a given size after the noise is thresholded at a given probability level and provides a corrected p-value. The cluster size needed to obtain the desired family-wise correction was determined using a standard fMRI package (AFNI AlphaSim) and clustering performed with custom MatLab software. For all analyses, subjects more than 2.5 standard deviations were excluded (typically 1 to 2 subjects per analysis).
2.7. Cortical thickness measures
FreeSurfer uses intensity and continuity sMRI information in segmentation and deformation procedures to obtain cortical thickness (CT) measures, calculated as the closest distance from the gray/white to gray/cerebral-spinal-fluid boundary at each vertex on the tessellated surface (Fischl and Dale, 2000). Using the FreeSurfer software suite (http://sufer.nmr.mgh.harvard.ed), the sMRI from each subject were processed to obtain STG CT measures using the procedures outlined in Edgar et al. (2012).
The present study examined gray-matter CT, as CT may represent a particularly reliable endophenotype for SZ (Ehrlich et al., 2011), given that alterations of CT reflect pathological abnormalities such as reduced neuropil density or loss of glial cells (Stark et al., 2004), abnormalities observed in postmortem SZ studies (Glantz et al., 2006; Kubota et al., 2011). In addition, genetic studies have suggested a heritability component for CT loss but not for volume in SZ (Goghari et al., 2007; Gogtay et al., 2007; Goldman et al., 2009; Winkler et al., 2010).
For analyses involving STG CT, to reduce the chance of type I error in each hemisphere a composite score was calculated, with each STG subregion score scaled by its surface area (SA).
3. Results
3.1. Source localization analyses
ANOVAs assessed Hemisphere and Group differences in the position of the STG 40 Hz steady-state dipoles (excluding the 4 HC and 6 SZ subjects whose ‘missing’ STG dipole was placed at the analog of the contralateral response). Examining medial-to-lateral position (x axis), a main effect of Group, F(1,56) = 4.47, p = 0.04, indicated more medial STG sources in patients than controls (~ 2 mm). Examining anterior-to-posterior position (y axis), a main effect of Hemisphere, F(1,56) = 99.37, p < 0.001, indicated more anterior right than left STG sources in both groups. Examining inferior-to-superior position (z axis), neither of the main effects nor the interaction was significant.
3.2. Total power analyses
Fig. 1 shows total-power family-wise corrected statistical maps (HC > SZ blue, SZ > HC red). In the left STG, statistical maps show (1) greater pre-stimulus ~ 4 to 20 Hz power in SZ than HC (Cohen's D = 0.96), (2) greater post-stimulus ~ 4 to 12 Hz power in HC than SZ from ~ 25 to 150 ms (Cohen's D = 0.89), and (3) greater 40 Hz steady-state activity in HC than SZ from ~ 500 to 1000 ms (Cohen's D = 0.53). Insets show left STG post-stimulus low-frequency (4 to 12 Hz activity averaged from 25 to 150 ms) and 40 Hz steady-state (38 to 42 Hz activity averaged from 300 to 950 ms) total power values for each subject. In the right STG, statistical maps show less ~ 4 to 12 Hz de-synchronization in SZ than in HC from ~ 700 to 900 ms (Cohen's D = 0.61).
Fig. 1.
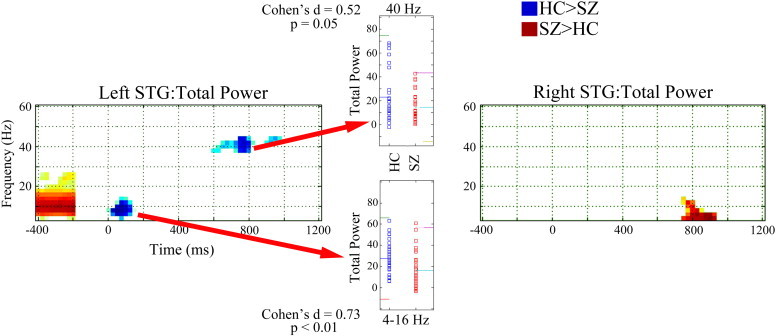
Total power family-wise corrected statistical maps for left and right STG (HC > SZ blue, SZ > HC red). Time is shown on the x axis and frequency on the y axis. The − 400 to − 200 ms period shows pre-stimulus total power without baseline subtraction. Insets show left STG post-stimulus low-frequency (4 to 12 Hz activity averaged from 25 to 150 ms) and 40 Hz steady-state (38 to 42 Hz activity averaged from 300 to 950 ms) total power values for each subject. In the inset, for each measure, colored lines show the mean and ± 2 SD.
3.3. ITC analyses
Fig. 2 shows ITC family-wise corrected statistical maps (HC > SZ blue, SZ > HC red). In the left STG, statistical maps show (1) greater post-stimulus ~ 4 to 12 Hz ITC in HC than SZ from ~ 25 to 300 ms (Cohen's D = 0.69) and (2) greater 40 Hz steady-state ITC in HC than SZ from ~ 400 to 1000 ms (Cohen's D = 0.65). Insets show left STG post-stimulus low-frequency (4 to 12 Hz activity averaged from 25 to 300 ms) and 40 Hz steady-state (38 to 42 Hz activity averaged from 300 to 950 ms) ITC values for each subject. In the right STG, statistical maps show greater early ~ 50 Hz ITC in HC than SZ from ~ 25 to 200 ms (Cohen's D = 0.76).
Fig. 2.
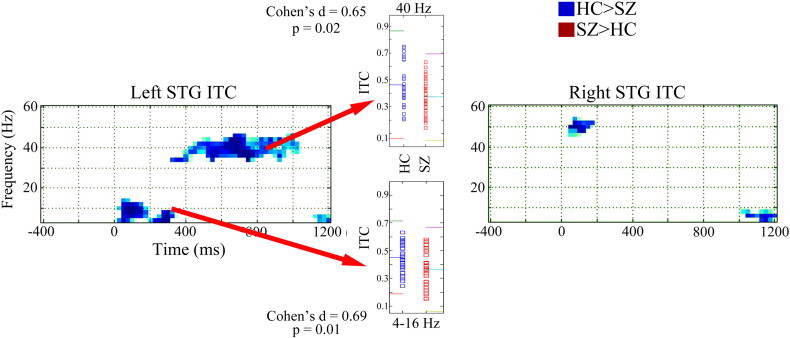
Inter-trial coherence family-wise corrected statistical maps for left and right STG (HC > SZ blue, SZ > HC red). Time is shown on the x axis and frequency on the y axis. Insets show left STG post-stimulus low-frequency (4 to 12 Hz activity averaged from 25 to 150 ms) and 40 Hz steady-state (38 to 42 Hz activity averaged from 300 to 950 ms) inter-trial coherence values for each subject. In the inset, for each measure, colored lines show the mean and ± 2 SD.
3.4. Associations between STG gray-matter cortical thickness and STG total power and ITC
A Group by Hemisphere ANOVA on STG gray-matter CT showed a marginally significant main effect of Group (HC > SZ), F(1,66) = 3.20, p = 0.08.
Fig. 3 shows family-wise corrected statistical maps of correlations between STG gray-matter CT and left STG total power (upper panel) and ITC (lower panel) for each group (right hemisphere not shown, as significant correlations were observed only in the left hemisphere). Insets show scatterplots of gray-matter CT versus 40 Hz steady-state ITC and total power (38 to 42 Hz activity averaged from 300 to 950 ms) for each group. Insets show that increased gray-matter CT was associated with increased 40 Hz steady-state total power and ITC in HC (ps < 0.05) but not SZ (ps > 0.05).
Fig. 3.
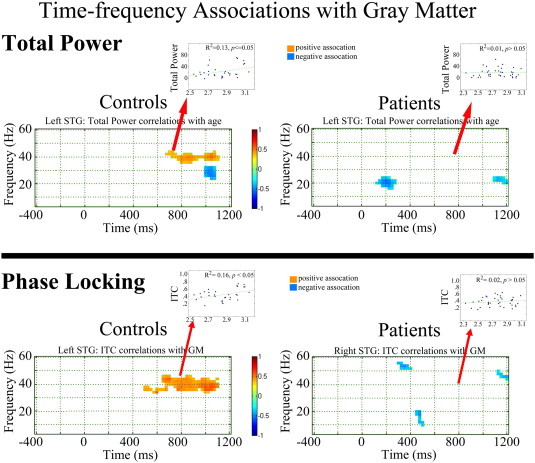
Family-wise corrected statistical maps showing correlations between gray-matter cortical thickness and left STG total power (upper panel) and ITC (lower panel) for each group. Time is shown on the x axis and frequency on the y axis. Insets show scatterplots of gray-matter cortical thickness versus left STG low-frequency (4 to 16 Hz activity averaged from 25 to 150 ms) and 40 Hz ITC and total power (38 to 42 Hz activity averaged from 300 to 950 ms) for each group, with the R2 values showing the percent variance explained.
3.5. Associations between age and STG total power and ITC
Fig. 4 shows family-wise corrected statistical maps of correlations between age and left STG total power (upper panel) and ITC (lower panel) for each group (right hemisphere not shown, as significant correlations were observed only in the left hemisphere). Insets show scatterplots of age versus left STG low-frequency (4 to 16 Hz activity averaged from 25 to 150 ms) and 40 Hz ITC and total power (38 to 42 Hz activity averaged from 300 to 950 ms) for each group. Insets show that increased age was associated with decreased early low-frequency total power and ITC as well as decreased 40 Hz steady-state total power and ITC in HC (ps < 0.05) but not SZ (ps > 0.05).
Fig. 4.
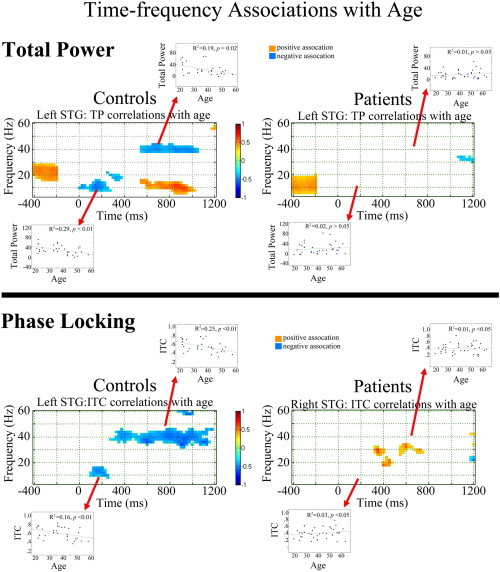
Family-wise corrected statistical maps showing correlations between age and left STG total power (upper panel) and ITC (lower panel) for each group. Time is shown on the x axis and frequency on the y axis. The − 400 to − 200 ms period shows pre-stimulus total power without baseline subtraction. Insets show scatterplots of age versus left STG low-frequency (4 to 16 Hz activity averaged from 25 to 150 ms) and 40 Hz ITC and total power (38 to 42 Hz activity averaged from 300 to 950 ms) for each group, with the R2 values showing the percent variance explained.
4. Discussion
Present findings indicated multiple disruptions to STG auditory areas in SZ. First, replicating earlier studies, analyses showed STG low-frequency and 40 Hz steady-state total power and ITC abnormalities in SZ. Second, STG function–structure relationships were observed only in HC, with STG gray-matter CT accounting for ~ 13% of the variance in STG 40 Hz steady-state total power and ~ 16% of the variance in 40 Hz steady-state ITC. Finally, in controls only, associations with age were observed, with decreased left STG low-frequency and 40 Hz steady-state total power and ITC observed in older controls.
Examining gray-matter changes associated with normal aging, Pakkenberg and Gundersen (1997) estimated a loss of ~ 85,000 neurons per day (from an estimated ~ 20 billion total neocortical neurons). As reviewed in Raz and Rodrigue (2006), age-related gray-matter changes associated with normal aging include (but are not limited to) myelin pallor, loss of neuronal bodies in the neocortex, shrinkage and dysmorphology of neurons, reduction in synaptic density, deafferentation, loss of dendritic spines, reduction in DNA repair ability, and failure to remove neurons with damaged nuclear DNA. Present findings indicate that in HC these age-related STG gray-matter changes are associated with weaker and less synchronous auditory responses.
We hypothesize that individuals with SZ do not show 40 Hz activity, age, and gray-matter associations because gray-matter abnormalities in SZ differ from the gray-matter changes observed in normal aging, with gray-matter loss in SZ prior to or at the onset of the disease (Jung et al., 2012; Steen et al., 2006) precluding normal age-related function–structure associations. For example, in typical adult-onset schizophrenia the extent of annualized progressive brain tissue loss is estimated to be 0.5%, more than twice the rate of controls (Hulshoff Pol and Kahn, 2008). In addition, likely different from the age-related gray-matter changes in HC, in SZ gray-matter reductions are thought to be primarily due to elimination of the neuropil between neuron bodies (the reduced neuropil hypothesis) (Selemon and Goldman-Rakic, 1999). Sweet et al. (2003) found that, within auditory cortex, mean somal volumes of deep layer 3 pyramidal cells in BA 41 and 42 were reduced in SZ, and Sweet et al. (2007) observed reduced axon terminal densities in feed-forward auditory pathways. A combined MEG and proton magnetic resonance spectroscopy study showed that the number and integrity of neurons (assessed via auditory cortex N-acetylaspartate) and the density and functional integrity of cell membranes (assessed via auditory cortex choline-containing compounds) are associated with M100 source strength (Soros et al., 2006).
Failure to observe a structure–function association in SZ may also be due to heterogeneity in the present SZ group. In a recent review, Moran et al. (2013) noted (1) the likely influence of individual genetic polymorphisms on cortical gray matter in SZ (e.g., the association of COMT Val/Val genotype with increased age-associated gray-matter loss in childhood-onset SZ reported in Raznahan et al. (2011)), and (2) evidence indicating that gray-matter loss in SZ is associated with genetic risk, with the rate of age-related gray matter loss in individual with SZ at least 50% due to genes implicated in SZ (e.g., see Brans et al., 2008). The above suggest that the present group-level analyses showing a loss of function–structure and age relationships in SZ may ‘overestimate’ this loss, with function–structure relationships perhaps existing in some individuals with SZ but reduced in others. Given the Moran et al. findings, studies examining function–structure associations in SZ subgroups (e.g., different COMT genotypes) as well as function–structure processes in monozygotic and dizygotic twin pairs are of interest. Longitudinal studies are also needed to more fully examine how STG function–structure processes change over time in HC and SZ.
A few other findings are of note. First, pre-stimulus low-frequency activity as well as post-stimulus low-frequency activity was were associated with age but not gray matter, suggesting that the sustained 40 Hz response is more dependent on the integrity of local neural networks than is the early low-frequency response. It is hypothesized that this reflects differences in the neural networks sustaining low-frequency versus 40 Hz steady-state activity. Specifically, whereas local networks of pyramidal cells and inhibitory interneurons in the superficial cortical layers are likely sufficient to maintain the 40 Hz driving response, low-frequency activity, associated with the 50 ms and 100 ms auditory responses, likely reflects input to primary/secondary auditory areas via thalamocortical interactions in the deep cortical layers as well as interactions between temporal and frontal areas (Buffalo et al., 2011; Chen et al., 2013; Knight et al., 1999). An emerging hypothesis suggests that the multiple abnormalities observed in layer 3 inhibitory interneuron parvalbumin basket cell GABAergic neurons and pyramidal cell networks in SZ are a homeostatic response to a more fundamental abnormality in SZ — decreased layer 3 pyramidal cell dendritic spine density (for a review, see Lewis et al., 2012). A STG dendritic spine density deficit in SZ (thus indicating reduced glutamatergic synapses onto pyramidal cells) could account for the gamma oscillatory abnormalities observed in the present study. Finding consistent with this include post-mortem studies observing that STG pyramidal cells in SZ are smaller have and have lower spine density (Sweet et al., 2004, 2009).
Second, as shown in Fig. 3, increased background activity was observed in individuals with SZ in the left and right STG. Group differences were observed primarily for frequencies less than 30 Hz. Thus, although this finding is consistent with the hypothesis of increased background noise in SZ (Gandal et al., 2012), present findings suggest that in STG regions this abnormality is observed only in theta to beta bands. The increased low-frequency pre-stimulus activity in SZ suggests a reduced ability to return to (or perhaps maintain) typical STG baseline activity, thus perhaps resulting in an inability to fully engage local neural populations at stimulus onset. Present results are similar to recent findings by Hong et al. (2012), where increased low-frequency resting as well as pre-stimulus activity was observed in SZ than HC.
Third, in the right STG, group differences were observed in the early transient 40 Hz response (i.e., between 25 and 200 ms). Transient auditory evoked gamma group differences have been reported in some but not all studies (Roach and Mathalon, 2008). Discrepancies in EEG studies may be due to examining the composite response at midline electrodes rather than separately examining left and right STG activity. However, studies using MEG to examine left and right hemisphere activity have not observed early 40 Hz group differences, suggesting that early auditory gamma-band abnormalities are not a robust finding in SZ.
The present study has several limitations. First, most subjects were chronic patients, with almost all patients on medication. As such, it is not possible to determine whether the observed abnormalities were due to the disorder or an effect of medication. Studies, however, show that 40 Hz steady-state abnormalities in SZ are present at first onset and in first-degree relatives (Rass et al., 2012; Spencer et al., 2008), suggesting that 40 Hz steady-state abnormalities in SZ are not due to medication. In addition, in a review of 100 ms auditory studies Rosburg et al. (2008) concluded that medication did not seem to account for group differences in N100 activity. Second, although consistent with all other previous studies observing relationships between auditory responses and left but not right STG gray matter (Edgar et al., 2012; McCarley et al., 1993, 2002), it remains unclear why the associations in the present study were observed only in the left hemisphere. Finally, to more fully understand auditory time–frequency abnormalities in SZ as well as oscillatory processes in controls, studies are needed to identify other brain measures that predict oscillatory activity. For example, Roberts et al. (2009) showed that acoustic radiations white matter predicts STG auditory latencies in typically developing children, and Gaetz et al. (2011) showed that magnetic resonance spectroscopy GABA levels predict gamma activity in motor cortex. Studies examining associations between STG time–frequency measures with acoustic radiations white matter and local GABA are needed. Given the multiple determinates of oscillatory activity, just as SZ is a heterogeneous disorder, it may turn out that neuroimaging-based endophenotypes are similarly complex, with a combination of gray matter, white matter, and neurochemical measures best predicting oscillatory abnormalities in SZ.
In sum, present findings replicate studies showing that early left STG low-frequency and 40 Hz steady-state auditory abnormalities distinguish SZ and HC populations. Damage to STG gray matter at the onset of schizophrenia may disrupt the normal age-related left STG function–structure relationships observed in controls.
Acknowledgments
This research was supported by grants from the National Institute of Mental Health (R01 MH65304 to Dr. José M. Cañive, K08 MH085100 to Dr. J. Christopher Edgar), a VA Merit grant (VA Merit CSR&D: IIR-04-212-3 to Dr. José M. Cañive), and the University of California at San Diego Merit Review Grant from the Department of Veterans Affairs to Dr. Mingxiong Huang. The authors would like to thank the subjects who enrolled in this study and to Megan Schendel, Kim Paulson, and Emerson Epstein, who helped with the data collection, and Lawrence Calais, Gloria Fuldauer, and Nickolas Lemke for their help with subject recruitment and administrative support related to this project.
Declaration of interest
The authors have no conflicts of interest to report.
Footnotes
This is an open-access article distributed under the terms of the Creative Commons Attribution-NonCommercial-No Derivative Works License, which permits non-commercial use, distribution, and reproduction in any medium, provided the original author and source are credited.
References
- Berg P., Scherg M. A multiple source approach to the correction of eye artifacts. Electroencephalogr. Clin. Neurophysiol. 1994;90(3):229–241. doi: 10.1016/0013-4694(94)90094-9. [DOI] [PubMed] [Google Scholar]
- Blumenfeld L.D., Clementz B.A. Response to the first stimulus determines reduced auditory evoked response suppression in schizophrenia: single trials analysis using MEG. Clin. Neurophysiol. 2001;112(9):1650–1659. doi: 10.1016/s1388-2457(01)00604-6. [DOI] [PubMed] [Google Scholar]
- Brans R.G., van Haren N.E., van Baal G.C., Schnack H.G., Kahn R.S., Hulshoff Pol H.E. Heritability of changes in brain volume over time in twin pairs discordant for schizophrenia. Arch. Gen. Psychiatry. 2008;65(11):1259–1268. doi: 10.1001/archpsyc.65.11.1259. [DOI] [PubMed] [Google Scholar]
- Brenner C.A., Sporns O., Lysaker P.H., O'Donnell B.F. EEG synchronization to modulated auditory tones in schizophrenia, schizoaffective disorder, and schizotypal personality disorder. Am. J. Psychiatry. 2003;160(12):2238–2240. doi: 10.1176/appi.ajp.160.12.2238. [DOI] [PubMed] [Google Scholar]
- Bryden M.P. Measuring handedness with questionnaires. Neuropsychologia. 1977;15(4–5):617–624. doi: 10.1016/0028-3932(77)90067-7. [DOI] [PubMed] [Google Scholar]
- Buffalo E.A., Fries P., Landman R., Buschman T.J., Desimone R. Laminar differences in gamma and alpha coherence in the ventral stream. Proc. Natl. Acad. Sci. U. S. A. 2011;108(27):11262–11267. doi: 10.1073/pnas.1011284108. [DOI] [PMC free article] [PubMed] [Google Scholar]
- Chen Y., Edgar J.C., Huang M., Hunter M.A., Epstein E., Howell B. Frontal and superior temporal auditory processing abnormalities in schizophrenia. NeuroImage. 2013;2:695–702. doi: 10.1016/j.nicl.2013.05.002. [DOI] [PMC free article] [PubMed] [Google Scholar]
- Clementz B.A., Blumenfeld L.D. Multichannel electroencephalographic assessment of auditory evoked response suppression in schizophrenia. Exp. Brain Res. 2001;139(4):377–390. doi: 10.1007/s002210100744. [DOI] [PubMed] [Google Scholar]
- Edgar J.C., Hanlon F.M., Huang M.X., Weisend M.P., Thoma R.J., Carpenter B. Superior temporal gyrus spectral abnormalities in schizophrenia. Psychophysiology. 2008;45(5):812–824. doi: 10.1111/j.1469-8986.2008.00682.x. [DOI] [PMC free article] [PubMed] [Google Scholar]
- Edgar J.C., Hunter M.A., Huang M., Smith A.K., Chen Y., Sadek J. Temporal and frontal cortical thickness associations with M100 auditory activity and attention in healthy controls and individuals with schizophrenia. Schizophr. Res. 2012;140(1–3):250–257. doi: 10.1016/j.schres.2012.06.009. [DOI] [PMC free article] [PubMed] [Google Scholar]
- Edgar J.C., Khan S.Y., Blaskey L., Chow V.Y., Rey M., Gaetz W., Cannon K.M., Monroe J.F., Cornew L., Qasmieh S., Liu S., Welsh J.P., Levy S.E., Roberts T.P. Neruomagnetic noise predicts evoked-response delays and core language deficits in autism spectrum disorders. J. Autism Dev. Disord. 2013 doi: 10.1007/s10803-013-1904-x. [DOI] [PMC free article] [PubMed] [Google Scholar]
- Ehrlich S., Yendiki A., Greve D.N., Manoach D.S., Ho B.C., White T. Striatal function in relation to negative symptoms in schizophrenia. Psychol. Med. 2011:1–16. doi: 10.1017/S003329171100119X. [DOI] [PubMed] [Google Scholar]
- Fischl B., Dale A.M. Measuring the thickness of the human cerebral cortex from magnetic resonance images. Proc. Natl. Acad. Sci. U. S. A. 2000;97(20):11050–11055. doi: 10.1073/pnas.200033797. [DOI] [PMC free article] [PubMed] [Google Scholar]
- Gaetz W., Edgar J.C., Wang D.J., Roberts T.P. Relating MEG measured motor cortical oscillations to resting gamma-aminobutyric acid (GABA) concentration. NeuroImage. 2011;55(2):616–621. doi: 10.1016/j.neuroimage.2010.12.077. [DOI] [PMC free article] [PubMed] [Google Scholar]
- Gandal M.J., Edgar J.C., Klook K., Siegel S.J. Gamma synchrony: towards a translational biomarker for the treatment-resistant symptoms of schizophrenia. Neuropharmacology. 2012;62(3):1504–1518. doi: 10.1016/j.neuropharm.2011.02.007. [DOI] [PMC free article] [PubMed] [Google Scholar]
- Glantz L.A., Gilmore J.H., Lieberman J.A., Jarskog L.F. Apoptotic mechanisms and the synaptic pathology of schizophrenia. Schizophr. Res. 2006;81(1):47–63. doi: 10.1016/j.schres.2005.08.014. [DOI] [PubMed] [Google Scholar]
- Goghari V.M., Rehm K., Carter C.S., MacDonald A.W. Sulcal thickness as a vulnerability indicator for schizophrenia. Br. J. Psychiatry. 2007;191:229–233. doi: 10.1192/bjp.bp.106.034595. [DOI] [PubMed] [Google Scholar]
- Gogtay N., Greenstein D., Lenane M., Clasen L., Sharp W., Gochman P. Cortical brain development in nonpsychotic siblings of patients with childhood-onset schizophrenia. Arch. Gen. Psychiatry. 2007;64(7):772–780. doi: 10.1001/archpsyc.64.7.772. [DOI] [PubMed] [Google Scholar]
- Goldman A.L., Pezawas L., Mattay V.S., Fischl B., Verchinski B.A., Chen Q. Widespread reductions of cortical thickness in schizophrenia and spectrum disorders and evidence of heritability. Arch. Gen. Psychiatry. 2009;66(5):467–477. doi: 10.1001/archgenpsychiatry.2009.24. [DOI] [PMC free article] [PubMed] [Google Scholar]
- Hall M.H., Taylor G., Sham P., Schulze K., Rijsdijk F., Picchioni M. The early auditory gamma-band response is heritable and a putative endophenotype of schizophrenia. Schizophr. Bull. 2011;37(4):778–787. doi: 10.1093/schbul/sbp134. [DOI] [PMC free article] [PubMed] [Google Scholar]
- Hamm J.P., Gilmore C.S., Picchetti N.A., Sponheim S.R., Clementz B.A. Abnormalities of neuronal oscillations and temporal integration to low- and high-frequency auditory stimulation in schizophrenia. Biol. Psychiatry. 2011;69(10):989–996. doi: 10.1016/j.biopsych.2010.11.021. [DOI] [PMC free article] [PubMed] [Google Scholar]
- Hamm J.P., Gilmore C.S., Clementz B.A. Augmented gamma band auditory steady-state responses: support for NMDA hypofunction in schizophrenia. Schizophr. Res. 2012;138(1):1–7. doi: 10.1016/j.schres.2012.04.003. [DOI] [PMC free article] [PubMed] [Google Scholar]
- Hoechstetter K., Bornfleth H., Weckesser D., Ille N., Berg P., Scherg M. BESA source coherence: a new method to study cortical oscillatory coupling. Brain Topogr. 2004;16(4):233–238. doi: 10.1023/b:brat.0000032857.55223.5d. [DOI] [PubMed] [Google Scholar]
- Hong L.E., Summerfelt A., McMahon R., Adami H., Francis G., Elliott A. Evoked gamma band synchronization and the liability for schizophrenia. Schizophr. Res. 2004;70(2–3):293–302. doi: 10.1016/j.schres.2003.12.011. [DOI] [PubMed] [Google Scholar]
- Hong L.E., Summerfelt A., Mitchell B.D., O'Donnell P., Thaker G.K. A shared low-frequency oscillatory rhythm abnormality in resting and sensory gating in schizophrenia. Clin. Neurophysiol. 2012;123(2):285–292. doi: 10.1016/j.clinph.2011.07.025. [DOI] [PMC free article] [PubMed] [Google Scholar]
- Hulshoff Pol H.E., Kahn R.S. What happens after the first episode? A review of progressive brain changes in chronically ill patients with schizophrenia. Schizophr. Bull. 2008;34(2):354–366. doi: 10.1093/schbul/sbm168. [DOI] [PMC free article] [PubMed] [Google Scholar]
- Jacobson G.P., Fitzgerald M.B. Auditory evoked gamma band potential in normal subjects. J. Am. Acad. Audiol. 1997;8(1):44–52. [PubMed] [Google Scholar]
- Jansen B.H., Hegde A., Boutros N.N. Contribution of different EEG frequencies to auditory evoked potential abnormalities in schizophrenia. Clin. Neurophysiol. 2004;115(3):523–533. doi: 10.1016/j.clinph.2003.10.016. [DOI] [PubMed] [Google Scholar]
- Johannesen J.K., Kieffaber P.D., O'Donnell B.F., Shekhar A., Evans J.D., Hetrick W.P. Contributions of subtype and spectral frequency analyses to the study of P50 ERP amplitude and suppression in schizophrenia. Schizophr. Res. 2005;78(2–3):269–284. doi: 10.1016/j.schres.2005.05.022. [DOI] [PubMed] [Google Scholar]
- Jung W.H., Borgwardt S., Fusar-Poli P., Kwon J.S. Gray matter volumetric abnormalities associated with the onset of psychosis. Front. Psychiatry/Front. Res. Found. 2012;3:101. doi: 10.3389/fpsyt.2012.00101. [DOI] [PMC free article] [PubMed] [Google Scholar]
- Kay S.R., Fiszbein A., Opler L.A. The positive and negative syndrome scale (PANSS) for schizophrenia. Schizophr. Bull. 1987;13(2):261–276. doi: 10.1093/schbul/13.2.261. [DOI] [PubMed] [Google Scholar]
- Knight R.T., Staines W.R., Swick D., Chao L.L. Prefrontal cortex regulates inhibition and excitation in distributed neural networks. Acta Psychol. 1999;101(2–3):159–178. doi: 10.1016/s0001-6918(99)00004-9. [DOI] [PubMed] [Google Scholar]
- Koenig T., van Swam C., Dierks T., Hubl D. Is gamma band EEG synchronization reduced during auditory driving in schizophrenia patients with auditory verbal hallucinations? Schizophr. Res. 2012;141(2–3):266–270. doi: 10.1016/j.schres.2012.07.016. [DOI] [PubMed] [Google Scholar]
- Krishnan G.P., Hetrick W.P., Brenner C.A., Shekhar A., Steffen A.N., O'Donnell B.F. Steady state and induced auditory gamma deficits in schizophrenia. NeuroImage. 2009;47(4):1711–1719. doi: 10.1016/j.neuroimage.2009.03.085. [DOI] [PMC free article] [PubMed] [Google Scholar]
- Kubota M., Miyata J., Yoshida H., Hirao K., Fujiwara H., Kawada R. Age-related cortical thinning in schizophrenia. Schizophr. Res. 2011;125(1):21–29. doi: 10.1016/j.schres.2010.10.004. [DOI] [PubMed] [Google Scholar]
- Kwon J.S., O'Donnell B.F., Wallenstein G.V., Greene R.W., Hirayasu Y., Nestor P.G. Gamma frequency-range abnormalities to auditory stimulation in schizophrenia. Arch. Gen. Psychiatry. 1999;56(11):1001–1005. doi: 10.1001/archpsyc.56.11.1001. [DOI] [PMC free article] [PubMed] [Google Scholar]
- Lemaitre H., Goldman A.L., Sambataro F., Verchinski B.A., Meyer-Lindenberg A., Weinberger D.R. Normal age-related brain morphometric changes: nonuniformity across cortical thickness, surface area and gray matter volume? Neurobiol. Aging. 2012;33(3):617. doi: 10.1016/j.neurobiolaging.2010.07.013. (e1-9) [DOI] [PMC free article] [PubMed] [Google Scholar]
- Lenz D., Fischer S., Schadow J., Bogerts B., Herrmann C.S. Altered evoked gamma-band responses as a neurophysiological marker of schizophrenia? Int. J. Psychophysiol. 2011;79(1):25–31. doi: 10.1016/j.ijpsycho.2010.08.002. [DOI] [PubMed] [Google Scholar]
- Lewis D.A., Curley A.A., Glausier J.R., Volk D.W. Cortical parvalbumin interneurons and cognitive dysfunction in schizophrenia. Trends Neurosci. 2012;35(1):57–67. doi: 10.1016/j.tins.2011.10.004. [DOI] [PMC free article] [PubMed] [Google Scholar]
- Light G.A., Hsu J.L., Hsieh M.H., Meyer-Gomes K., Sprock J., Swerdlow N.R. Gamma band oscillations reveal neural network cortical coherence dysfunction in schizophrenia patients. Biol. Psychiatry. 2006;60(11):1231–1240. doi: 10.1016/j.biopsych.2006.03.055. [DOI] [PubMed] [Google Scholar]
- McCarley R.W., Shenton M.E., O'Donnell B.F., Faux S.F., Kikinis R., Nestor P.G. Auditory P300 abnormalities and left posterior superior temporal gyrus volume reduction in schizophrenia. Arch. Gen. Psychiatry. 1993;50(3):190–197. doi: 10.1001/archpsyc.1993.01820150036003. [DOI] [PubMed] [Google Scholar]
- McCarley R.W., Salisbury D.F., Hirayasu Y., Yurgelun-Todd D.A., Tohen M., Zarate C. Association between smaller left posterior superior temporal gyrus volume on magnetic resonance imaging and smaller left temporal P300 amplitude in first-episode schizophrenia. Arch. Gen. Psychiatry. 2002;59(4):321–331. doi: 10.1001/archpsyc.59.4.321. [DOI] [PubMed] [Google Scholar]
- Miller G.A., Rockstroh B. Endophenotypes in psychopathology research: where do we stand? Annu. Rev. Clin. Psychol. 2013;9:177–213. doi: 10.1146/annurev-clinpsy-050212-185540. [DOI] [PubMed] [Google Scholar]
- Mitelman S.A., Buchsbaum M.S. Very poor outcome schizophrenia: clinical and neuroimaging aspects. Int. Rev. Psychiatry. 2007;19(4):345–357. doi: 10.1080/09540260701486563. [DOI] [PMC free article] [PubMed] [Google Scholar]
- Moran M.E., Hulshoff Pol H., Gogtay N. A family affair: brain abnormalities in siblings of patients with schizophrenia. Brain. 2013;136(Pt 11):3215–3226. doi: 10.1093/brain/awt116. [DOI] [PMC free article] [PubMed] [Google Scholar]
- Pakkenberg B., Gundersen H.J. Neocortical neuron number in humans: effect of sex and age. J. Comp. Neurol. 1997;384(2):312–320. [PubMed] [Google Scholar]
- Pantev C. Evoked and induced gamma-band activity of the human cortex. Brain Topogr. 1995;7(4):321–330. doi: 10.1007/BF01195258. [DOI] [PubMed] [Google Scholar]
- Papp N., Ktonas P. Critical evaluation of complex demodulation techniques for the quantification of bioelectrical activity. Biomed. Sci. Instrum. 1977;13:135–145. [PubMed] [Google Scholar]
- Popov T., Jordanov T., Weisz N., Elbert T., Rockstroh B., Miller G.A. Evoked and induced oscillatory activity contributes to abnormal auditory sensory gating in schizophrenia. NeuroImage. 2011;56(1):307–314. doi: 10.1016/j.neuroimage.2011.02.016. [DOI] [PubMed] [Google Scholar]
- Rasetti R., Weinberger D.R. Intermediate phenotypes in psychiatric disorders. Curr. Opin. Genet. Dev. 2011;21(3):340–348. doi: 10.1016/j.gde.2011.02.003. [DOI] [PMC free article] [PubMed] [Google Scholar]
- Rass O., Forsyth J.K., Krishnan G.P., Hetrick W.P., Klaunig M.J., Breier A. Auditory steady state response in the schizophrenia, first-degree relatives, and schizotypal personality disorder. Schizophr. Res. 2012;136(1–3):143–149. doi: 10.1016/j.schres.2012.01.003. [DOI] [PMC free article] [PubMed] [Google Scholar]
- Raz N., Rodrigue K.M. Differential aging of the brain: patterns, cognitive correlates and modifiers. Neurosci. Biobehav. Rev. 2006;30(6):730–748. doi: 10.1016/j.neubiorev.2006.07.001. [DOI] [PMC free article] [PubMed] [Google Scholar]
- Raznahan A., Greenstein D., Lee Y., Long R., Clasen L., Gochman P. Catechol-o-methyl transferase (COMT) val158met polymorphism and adolescent cortical development in patients with childhood-onset schizophrenia, their non-psychotic siblings, and healthy controls. NeuroImage. 2011;57(4):1517–1523. doi: 10.1016/j.neuroimage.2011.05.032. [DOI] [PMC free article] [PubMed] [Google Scholar]
- Roach B.J., Mathalon D.H. Event-related EEG time–frequency analysis: an overview of measures and an analysis of early gamma band phase locking in schizophrenia. Schizophr. Bull. 2008;34(5):907–926. doi: 10.1093/schbul/sbn093. [DOI] [PMC free article] [PubMed] [Google Scholar]
- Roberts T.P., Khan S.Y., Blaskey L., Dell J., Levy S.E., Zarnow D.M. Developmental correlation of diffusion anisotropy with auditory-evoked response. Neuroreport. 2009;20(18):1586–1591. doi: 10.1097/WNR.0b013e3283306854. [DOI] [PubMed] [Google Scholar]
- Rosburg T., Boutros N.N., Ford J.M. Reduced auditory evoked potential component N100 in schizophrenia—a critical review. Psychiatry Res. 2008;161(3):259–274. doi: 10.1016/j.psychres.2008.03.017. [DOI] [PubMed] [Google Scholar]
- Rose E.J., Donohoe G. Brain vs behavior: an effect size comparison of neuroimaging and cognitive studies of genetic risk for schizophrenia. Schizophr. Bull. 2013;39(3):518–526. doi: 10.1093/schbul/sbs056. [DOI] [PMC free article] [PubMed] [Google Scholar]
- Salisbury D.F., Kuroki N., Kasai K., Shenton M.E., McCarley R.W. Progressive and interrelated functional and structural evidence of post-onset brain reduction in schizophrenia. Arch. Gen. Psychiatry. 2007;64(5):521–529. doi: 10.1001/archpsyc.64.5.521. [DOI] [PMC free article] [PubMed] [Google Scholar]
- Selemon L.D., Goldman-Rakic P.S. The reduced neuropil hypothesis: a circuit based model of schizophrenia. Biol. Psychiatry. 1999;45(1):17–25. doi: 10.1016/s0006-3223(98)00281-9. [DOI] [PubMed] [Google Scholar]
- Shenton M.E., Dickey C.C., Frumin M., McCarley R.W. A review of MRI findings in schizophrenia. Schizophr. Res. 2001;49(1–2):1–52. doi: 10.1016/s0920-9964(01)00163-3. [DOI] [PMC free article] [PubMed] [Google Scholar]
- Smiley J.F., Rosoklija G., Mancevski B., Mann J.J., Dwork A.J., Javitt D.C. Altered volume and hemispheric asymmetry of the superficial cortical layers in the schizophrenia planum temporale. Eur. J. Neurosci. 2009;30(3):449–463. doi: 10.1111/j.1460-9568.2009.06838.x. [DOI] [PMC free article] [PubMed] [Google Scholar]
- Smith A.K., Edgar J.C., Huang M., Lu B.Y., Thoma R.J., Hanlon F.M. Cognitive abilities and 50- and 100-msec paired-click processes in schizophrenia. Am. J. Psychiatry. 2010;167(10):1264–1275. doi: 10.1176/appi.ajp.2010.09071059. [DOI] [PMC free article] [PubMed] [Google Scholar]
- Soros P., Michael N., Tollkotter M., Pfleiderer B. The neurochemical basis of human cortical auditory processing: combining proton magnetic resonance spectroscopy and magnetoencephalography. BMC Biol. 2006;4:25. doi: 10.1186/1741-7007-4-25. [DOI] [PMC free article] [PubMed] [Google Scholar]
- Spencer K.M., Salisbury D.F., Shenton M.E., McCarley R.W. Gamma-band auditory steady-state responses are impaired in first episode psychosis. Biol. Psychiatry. 2008;64(5):369–375. doi: 10.1016/j.biopsych.2008.02.021. [DOI] [PMC free article] [PubMed] [Google Scholar]
- Spencer K.M., Niznikiewicz M.A., Nestor P.G., Shenton M.E., McCarley R.W. Left auditory cortex gamma synchronization and auditory hallucination symptoms in schizophrenia. BMC Neurosci. 2009;10:85. doi: 10.1186/1471-2202-10-85. [DOI] [PMC free article] [PubMed] [Google Scholar]
- Stark A.K., Uylings H.B., Sanz-Arigita E., Pakkenberg B. Glial cell loss in the anterior cingulate cortex, a subregion of the prefrontal cortex, in subjects with schizophrenia. Am. J. Psychiatry. 2004;161(5):882–888. doi: 10.1176/appi.ajp.161.5.882. [DOI] [PubMed] [Google Scholar]
- Steen R.G., Mull C., McClure R., Hamer R.M., Lieberman J.A. Brain volume in first-episode schizophrenia: systematic review and meta-analysis of magnetic resonance imaging studies. Br. J. Psychiatry. 2006;188:510–518. doi: 10.1192/bjp.188.6.510. [DOI] [PubMed] [Google Scholar]
- Sweet R.A., Pierri J.N., Auh S., Sampson A.R., Lewis D.A. Reduced pyramidal cell somal volume in auditory association cortex of subjects with schizophrenia. Neuropsychopharmacology. 2003;28(3):599–609. doi: 10.1038/sj.npp.1300120. [DOI] [PubMed] [Google Scholar]
- Sweet R.A., Bergen S.E., Sun Z., Sampson A.R., Pierri J.N., Lewis D.A. Pyramidal cell size reduction in schizophrenia: evidence for involvement of auditory feedforward circuits. Biol. Psychiatry. 2004;55(12):1128–1137. doi: 10.1016/j.biopsych.2004.03.002. [DOI] [PubMed] [Google Scholar]
- Sweet R.A., Bergen S.E., Sun Z., Marcsisin M.J., Sampson A.R., Lewis D.A. Anatomical evidence of impaired feedforward auditory processing in schizophrenia. Biol. Psychiatry. 2007;61(7):854–864. doi: 10.1016/j.biopsych.2006.07.033. [DOI] [PubMed] [Google Scholar]
- Sweet R.A., Henteleff R.A., Zhang W., Sampson A.R., Lewis D.A. Reduced dendritic spine density in auditory cortex of subjects with schizophrenia. Neuropsychopharmacology. 2009;34(2):374–389. doi: 10.1038/npp.2008.67. [DOI] [PMC free article] [PubMed] [Google Scholar]
- Taulu S., Kajola M., Simola J. Suppression of interference and artifacts by the signal space separation method. Brain Topogr. 2004;16(4):269–275. doi: 10.1023/b:brat.0000032864.93890.f9. [DOI] [PubMed] [Google Scholar]
- Teale P., Collins D., Maharajh K., Rojas D.C., Kronberg E., Reite M. Cortical source estimates of gamma band amplitude and phase are different in schizophrenia. NeuroImage. 2008;42(4):1481–1489. doi: 10.1016/j.neuroimage.2008.06.020. [DOI] [PMC free article] [PubMed] [Google Scholar]
- Turetsky B.I., Greenwood T.A., Olincy A., Radant A.D., Braff D.L., Cadenhead K.S. Abnormal auditory N100 amplitude: a heritable endophenotype in first-degree relatives of schizophrenia probands. Biol. Psychiatry. 2008;64(12):1051–1059. doi: 10.1016/j.biopsych.2008.06.018. [DOI] [PMC free article] [PubMed] [Google Scholar]
- Winkler A.M., Kochunov P., Blangero J., Almasy L., Zilles K., Fox P.T. Cortical thickness or grey matter volume? The importance of selecting the phenotype for imaging genetics studies. NeuroImage. 2010;53(3):1135–1146. doi: 10.1016/j.neuroimage.2009.12.028. [DOI] [PMC free article] [PubMed] [Google Scholar]