Abstract
The brain receives disparate retinal input owing to the separation of the eyes, yet we usually perceive a single fused world. This is because of complex interactions between sensory and oculomotor processes that quickly act to reduce excessive retinal disparity. This implies a strong link between depth perception and fusion, but it is well established that stereoscopic depth percepts are also obtained from stimuli that produce double images. Surprisingly, the nature of depth percepts from such diplopic stimuli remains poorly understood. Specifically, despite long-standing debate it is unclear whether depth under diplopia is owing to the retinal disparity (directly), or whether the brain interprets signals from fusional vergence responses to large disparities (indirectly). Here, we addressed this question using stereoscopic afterimages, for which fusional vergence cannot provide retinal feedback about depth. We showed that observers could reliably recover depth sign and magnitude from diplopic afterimages. In addition, measuring vergence responses to large disparity stimuli revealed that that the sign and magnitude of vergence responses are not systematically related to the target disparity, thus ruling out an indirect explanation of our results. Taken together, our research provides the first conclusive evidence that stereopsis is a direct process, even for diplopic targets.
Keywords: stereopsis, diplopia, vergence, fusion, disparity
1. Introduction
Our brain receives simultaneous visual input from two different viewpoints, yet we typically perceive a single fused three-dimensional world. This binocular fusion depends on the cooperation between sensory and motor processes. With stable fixation, sensory fusion occurs for a limited range of retinal disparities [1]; disparities beyond this range produce diplopia (double vision). However, in normal binocular viewing, we rarely experience diplopia owing to fusional vergence (motor fusion), in which the two eyes move in opposite directions to quickly reduce excessive retinal disparity to within the range of sensory fusion.
While vergence eye movements are useful for maintaining single vision, binocular fusion is not a necessary condition for stereoscopic depth perception. It is well known that depth can be obtained from images that are clearly diplopic [2–6]. However, it is unclear whether the percept of depth from diplopic images is a direct stereoscopic percept from retinal disparity as is the case for fused stimuli (figure 1a). Instead, if observers make an eye movement to the disparate target, they could monitor their fusional vergence to obtain the direction and magnitude of the depth offset (figure 1b). This vergence change could be signalled by either (i) the associated extra-retinal motor command (efference or proprioceptive reafference) or (ii) changes in the retinal disparity of stationary objects as they sweep across the retina (i.e. visual reafference [7]).
Figure 1.
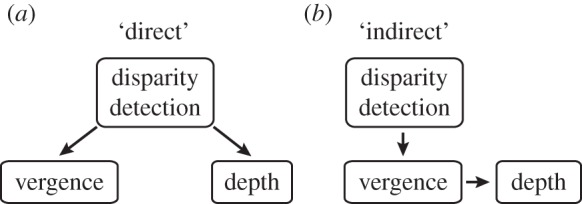
Diagram that illustrates possible mechanisms underlying stereoscopic depth perception from diplopic targets. (a) Direct hypothesis: the recovery of depth under diplopia is directly owing to the disparity detection. (b) Indirect hypothesis: rather than using the retinal disparity as a direct cue to depth, the visual system uses the detected disparity indirectly to first initiate fusional vergence. From the vergence movement, it then infers depth order and magnitude.
To prevent fusional vergence from affecting the stimulus, previous investigations have typically used exposure times shorter than the typical vergence onset latency (120–160 ms). However, this is not an ideal procedure for two reasons. First, there is evidence that vergence responses can be initiated poststimulus [8,9] and (if the eye movements were sensed) could provide a coarse depth sign signal. Second, stereoscopic acuity is degraded as exposure durations are reduced below 100 ms [10,11]. The effects of these two factors cannot be distinguished in the existing literature. Reasoning that poststimulus vergence could only signal depth of one target at a time, Ziegler & Hess [12] concluded that their observers’ ability to make depth judgements about pairs of briefly presented diplopic stimuli supported direct use of disparity. However, their discrimination task would be sensitive to fixation disparity, they reported only depth sign (not magnitude) and did not measure eye movements to confirm their assumption that observers maintained stable fixation.
In Experiment 1, we use a novel technique to investigate whether fusional vergence is essential to recover depth sign and magnitude from fused and diplopic images. We avoid the problems inherent to the use of limited exposure durations by using stereoscopic afterimages (stabilized retinal images) to assess depth percepts. This open-loop stimulus has two advantages: (i) poststimulus fusional vergence does not produce a retinal feedback signal (i.e. the reafference component of fusional vergence), but (ii) observers have ample time to inspect the stimulus. If depth is obtained under these conditions, it must arise from the diplopic retinal disparity. However, while unlikely, it is still possible that observers obtained depth sign by monitoring the motor signals emanating from poststimulus fusional vergence, rather than from the retinal disparity alone. Experiment 2 assesses this possibility by measuring vergence responses to diplopic stimuli. If fusional vergence is indeed a necessary cue to depth sign, our results should show vergence responses that follow the sign of the vergence demand.
2. Material and methods
(a). Observers
Fifteen observers (authors A.L. and L.W. and 13 naive observers) participated in Experiment 1. Nine observers from Experiment 1 participated in Experiment 2A; five observers from Experiment 1 participated in Experiment 2B. All observers had normal or corrected-to-normal vision and could reliably discriminate at least 1 arcmin of crossed and uncrossed disparity in a briefly presented (300 ms) random-dot stereogram. We measured each observer's interpupillary distance (IPD) using a Reichert Digital PD Meter. All observers gave informed consent, in accordance with a protocol approved by the York University Human Participants Review Committee.
(b). Stimuli
The stimuli in all experiments were vertical line stereograms (figure 2a). These line stimuli have been widely used in the literature as they are relatively simple and provide broadband vertical contours. Each half-image contained two thin (11 by 110 arcmin) vertical bars positioned 54 arcmin above and below a fixation point consisting of a LED (11 arcmin diameter). The upper bars had zero disparity with respect to the fixation point. The lateral positions of the lower bars were varied in equal and opposite amounts in the two half-images. The relative disparity between the upper and lower bars produced an impression of two vertical bars in the mid-sagittal plane, with the lower bar displaced in depth with respect to the upper bar. The stimuli in Experiment 1 and Experiment 2B were afterimages formed on a dark background. The computerized stimuli used in the initial diplopia measurement and in Experiment 2A were white on a mid-grey background to minimize cross-talk between the polarized half-images.
Figure 2.
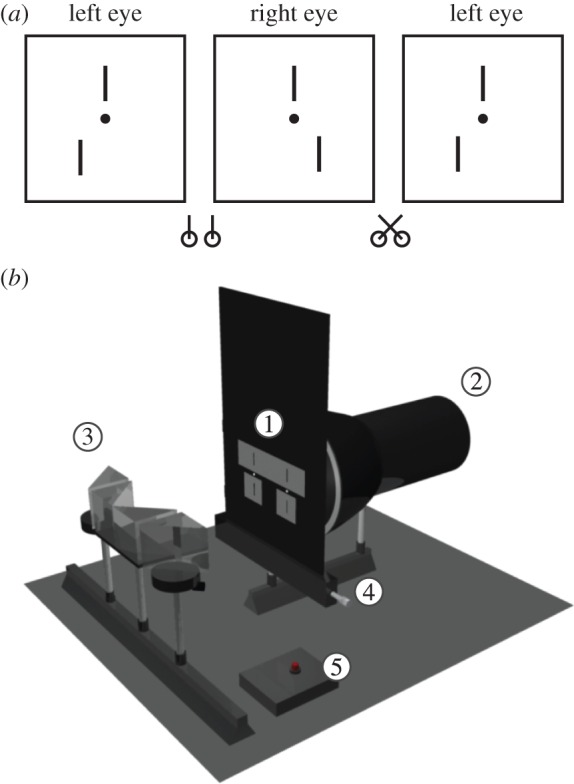
Stimuli and afterimage apparatus. (a) Stereogram of an uncrossed stimulus configuration for free-fusion (when fused, the bottom bar appears behind fixation). The left and middle half-images are for divergence fusion; the middle and right half-images are for cross-fusion. (b) A three-dimensional model of the experimental apparatus used to create stereoscopic afterimages. The numbers in the white circles correspond to the following labels (in the brackets). The stimulus consisted of line-stereograms that were precision-milled into thin aluminium plates (1) and were back-illuminated by a xenon flashgun (2). Observers viewed the stimulus through a set of mirror prisms (3), so that each eye saw one half-image of the stereogram. The bottom bars could be moved in opposite but equal directions by turning a micrometer (4). The observer discharged the flashgun by pressing a trigger button (5). (Online version in colour.)
(c). Apparatus
In Experiments 1 and 2B, stimuli were presented using a modified mirror stereoscope (figure 2b). Each eye saw one half-image of the stimulus through two mirror prisms. The vertical bars in the stimulus were slits that were precision-milled in two thin aluminium plates and illuminated by a xenon flash tube (300 W) placed behind them. When the observer fused the LEDs, the upper bars also fused so that the relative disparity between the LEDs and the upper bars was zero. The lower bars could be shifted in equal but opposite directions in the two half-images by a calibrated micrometer. The micrometer settings were carefully calibrated to correspond to our test disparities. The optical path length from the observer's eyes to the fixation LED was 38 cm. The vergence-defined distance of the fixation LED varied slightly with observers’ IPD. It was about 32 cm for an IPD of 6.2 cm. In the preliminary diplopia measurements and in Experiment 2A, the stimuli were presented on a 21′ CRT monitor (1280 × 1024 pixels at 120 Hz) mounted with a NuVision 17SX polarized display (images for each eye were presented on alternate frames at a rate of 60 Hz per eye) at a viewing distance of 57 cm, viewed by the observer through polarized glasses. We recorded binocular eye movements using an Eyelink 1000 (SR Research Ltd.). All data were analysed offline using Matlab (The MathWorks Ltd.).
(d). Procedures
(i). Preliminary measurements: fusion limits
Diplopia thresholds were measured using a one-up/one-down staircase procedure. To compensate for fusional hysteresis [13,14], we interleaved four staircases: two for crossed and two for uncrossed disparities, one of each started at 2° while the other started at zero disparity. Observers indicated whether they saw a single lower bar (fused) or two distinct lower bars (diplopic). The last 12 reversals for each of the disparity sign staircases were averaged to obtain the diplopia threshold. The average diplopia thresholds for crossed and uncrossed disparities were used to choose suitable disparity values for Experiment 1.
(ii). Experiment 1: depth judgements in afterimages
At the start of each trial, the experimenter set the target disparity and turned on the fixation LEDs. The observer then looked through the mirror prisms and, upon fusion of the LEDs, pressed a button to initiate the trial. The button turned off the LEDs and, 100 ms later, discharged the flash. The flash illuminated the stimulus slits with a brief (less than 0.1 ms) intense white light, which created an afterimage of the stereogram on each retina. Then, in the dark and with eyes closed, the observers made two judgements; first, they judged which bar was closer (depth sign). Second, they estimated the perceived depth between the bars (depth magnitude) using their index finger and thumb. The experimenter measured this separation with a digital caliper (we validated this cross-modal matching task in a separate experiment, as described in the electronic supplementary information). Each observer completed one trial at each of 15 test disparities (including zero). For all subjects, we verified that bars with crossed and uncrossed disparities of 5 and 10 arcmin appeared fused. Bars with crossed and uncrossed disparities of 30, 45, 60, 75 and 90 arcmin appeared diplopic. Trials were pseudo-randomly ordered for each observer. Trials were conducted in a fully darkened room and the observer spent at least 15 min in a normally lit room between trials to ensure that the afterimage from the previous trial had dissipated.
(iii). Experiment 2: fusional vergence measurements
We measured fusional vergence responses to the line stereograms using two methods.
In Experiment 2A, the stimuli were the same as those used in Experiment 1, but they were presented on a computer display rather than as afterimages. On each trial, a fixation point was visible for 500 ms, followed by the target for 120 ms. Trials were separated by a 1000 ms interval, during which the screen was blank. During this interval, the observer reported the depth sign of the bottom bar with respect to the top bar. Each observer completed 10 repetitions of each of 11 disparities (2.5° crossed to 2.5° uncrossed in steps of 0.5°) in a pseudo-random order. We calibrated the eye tracker every 20 trials by asking the observer to track a small (11 arcmin diameter) white dot on a mid-grey background as it jumped back and forth laterally by 1° every second.
Experiment 2A investigated whether open-loop vergence signals are required to judge depth sign, but longer exposure durations could be needed for reliable magnitude estimates (see Introduction). Experiment 2B investigated whether open-loop vergence responses could explain quantitative depth in afterimage stereograms. The procedure was identical to Experiment 1 except that we only used the +1.5° and −1.5° disparity stimuli and we briefly re-illuminated the fixation LED 550 ms after the afterimage was formed. Rather than asking observers to judge the depth sign of the bottom bar with respect to the top bar, we now asked observers to localize the re-illuminated LED in depth relative to the top bar of the afterimage (which was at zero disparity at the time of the flash). If a vergence response was elicited by the disparate afterimage, there should be a corresponding shift in the perceived depth sign and magnitude of the LED.
(e). Eye movement analysis
To analyse the eye movement data from Experiment 2A, we first calibrated raw gaze positions by manually selecting fixations in the calibration blocks and then converting these to degrees of visual angle. The gain and offset were calibrated for each eye by equating 1° of movement with the median vergence response to the 1° lateral stimulus shifts during calibration. Preprocessing removed trials in which blinks or saccades occurred during or after target presentation (8%). To obtain vergence responses from the calibrated gaze positions, we first segmented the data by trial and condition, and then subtracted the horizontal position of the left eye from that of the right eye at each sample, with each position being related to the positions when fixating the screen centre (so that negative values for vergence correspond to convergent eye movements).
Because observers had a slight tendency to make a divergent eye movement after the stimulus was presented, we normalized the data by subtracting the vergence response during the zero disparity trials from the vergence responses made during all other non-zero disparity trials. We next extracted each observer's mean vergence ‘peak’ response for each test disparity. Based on observers’ average response times (see the electronic supplementary material, figure S2) and previous reports [15,16], we anticipated that the peak vergence response would occur around 550 ms after target onset (this was confirmed by visual inspection of observers’ vergence traces). Thus, the vergence state at this point in the vergence traces was used in subsequent analyses. A bootstrapping procedure was used to calculate the 95% CIs of the mean.
3. Results
(a). Preliminary measurements: fusion limits
We found large differences in fusion limits between observers (F1,15 > 100, p < 0.001, repeated measures ANOVA). The mean fusion limits (figure 3a) across observers were slightly, but not significantly, larger for crossed than for uncrossed disparities (25.9 versus 22.1 arcmin, respectively; F1,15 = 3.5, p = 0.083).
Figure 3.
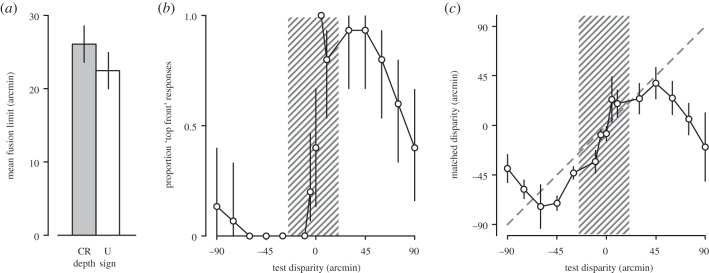
Results from Experiment 1. (a) Mean fusion limits across observers for crossed (grey bar) and uncrossed (white bar) targets, as measured in the preliminary diplopia threshold measures. These limits are represented in (b,c) as the hatched areas. (b) Depth sign judgements from afterimages (Experiment 1). The proportion of ‘top in front’ (uncrossed disparity of the bottom bar) responses is plotted as a function of disparity. Negative disparities map onto crossed (near) stimuli and positive disparities map onto uncrossed (far) stimuli. (c) Depth magnitude estimates from afterimages expressed in terms of disparity. The matched disparity (calculated from the observers’ depth estimate, their interocular distance and the viewing distance) is plotted as a function of the test disparity. The diagonal dashed line shows unity (where the matched disparity equals the test disparity). All error bars show the bootstrapped 95% CIs of the mean.
(b). Experiment 1: depth judgements in afterimages
On average, observers discriminated the depth sign of stereoscopic afterimages correctly on 86% of the trials. They reliably judged sign (significantly above chance) up to about 1° of uncrossed disparity and at least 1.5° of crossed disparity (figure 3b), which was the largest disparity tested and well beyond the fusional range of these observers for these stimuli. Quantitative depth estimates, expressed in terms of equivalent disparity based on the viewing geometry, are shown in figure 3c. Estimates closely followed the test disparity between 0.75° uncrossed and 1° crossed disparity, a range of 1.75°. The average depth estimation error within this range was 12.6 arcmin and there was a monotonic relationship between the test disparity and the matched disparity. In both directions outside this range, depth estimates gradually declined. Importantly, we show that observers can recover both depth sign and magnitude with reasonable accuracy from stabilized images at disparities beyond their fusion limit.
(c). Experiment 2: fusional vergence responses
In Experiment 2A, we measured eye movements to short duration presentations of computerized versions of the line stereograms used in Experiment 1. Individual vergence responses broadly fell into two categories, neither of which supported the proposal that sign-specific vergence responses are used to judge depth (figure 4a,b). In fact, the majority of observers did not initiate fusional vergence in any direction. Only four out of nine observers initiated significant vergence responses (figure 4b; O2, O3, O6 and O8). However, these were much smaller than the vergence demand (the physical disparity) and were only prompted by disparity of one sign, a finding consistent with previous reports [9,17]. The average vergence response across observers and vergence demands at 550 ms after stimulus onset was 3.6 arcmin (a vergence gain of 4%). Vergence responses differed between crossed and uncross disparities (F1,8 = 18.32, p < 0.01), but there was no difference between the magnitudes within each disparity sign (F4,32 = 0.68, p = 0.61). Thus, while there was some idiosyncratic evidence of direction-specific vergence, the vergence magnitude was small (if present) and did not vary systematically with the physical disparity. Regardless, all observers discriminated depth sign almost perfectly (94%) in all test conditions (see electronic supplementary material, figure S2).
Figure 4.
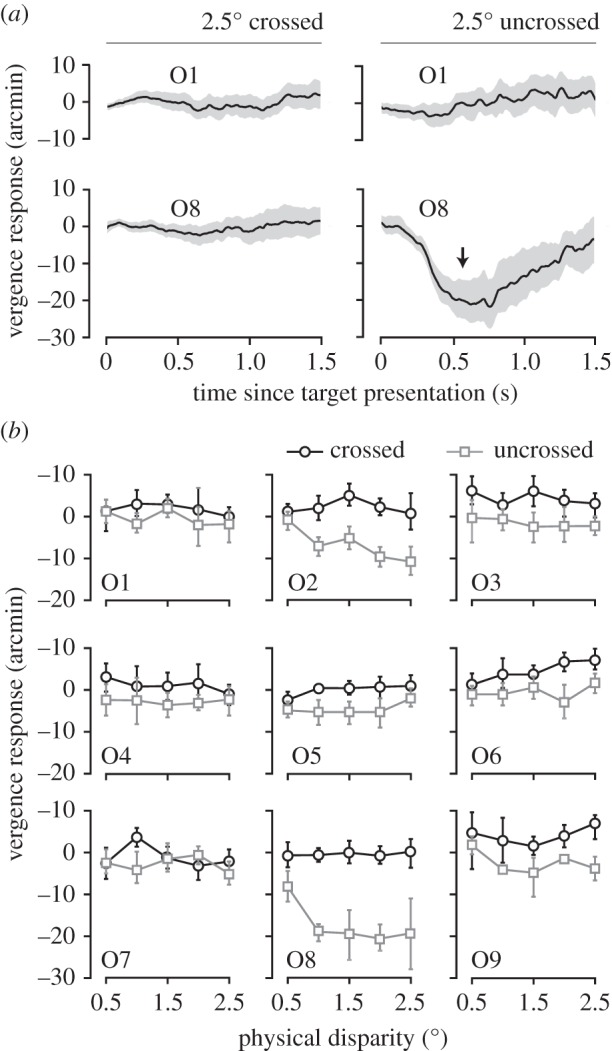
Vergence responses from Experiment 2A. (a) Mean vergence responses as a function of time (since the target was presented) for two observers (O1 and O8 in (b)). Plotted are the two largest disparities we measured: 2.5° crossed (left) and uncrossed (right). The arrow marks 550 ms, the point that we defined as the maximum vergence response (plotted in (b) for all observers and disparities). The shaded areas show the 95% CI of the mean. (b) Mean vergence responses plotted as a function of the physical disparity for nine observers. Black circles show data for crossed disparities; grey squares show data for uncrossed disparities. Negative vergence responses are consistent with the eyes converging to a farther distance and vice versa (left eye's angular change in orientation minus the right eye's angular change in orientation; note that this is opposite to the convention used for disparity in this paper). Error bars show 95% CIs of the mean (some smaller error bars are contained within the symbol). Note that some grey squares overlap black circles.
In Experiment 2B, we measured vergence responses using a subjective technique following afterimage formation. As expected based on Experiment 2A, vergence responses were very small (on average less than 1 arcmin), there was no effect of disparity on vergence direction (figure 5; F1,4 < 1, p = 0.9), and there was no correlation between the inferred eye movements and the disparity of the flashed stimuli. In fact, only one observer showed significant non-zero vergence, but only in one direction (figure 5, O5).
Figure 5.
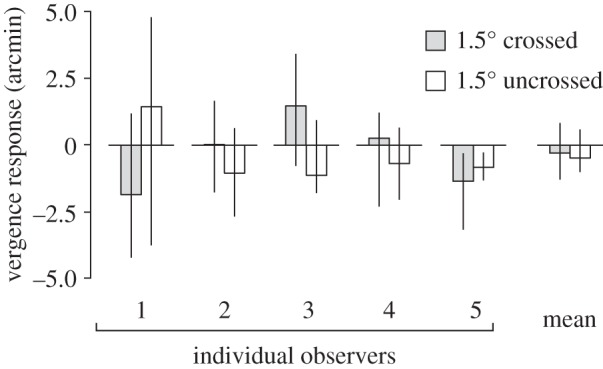
Inferred vergence responses to diplopic stereoscopic afterimages (Experiment 2B). Average (inferred) vergence responses for five observers, measured at 1.5° crossed (grey bars) and uncrossed (white bars) disparity. Each bar is the average of six trials. Error bars show bootstrapped 95% CIs of the mean.
4. Discussion
We aimed to answer a long-standing question in sensory neurophysiology: is fusional vergence essential to recover stereoscopic depth under diplopia? Our study approached this question in a unique way by using stereoscopic afterimages, which leave an unchanging pattern of disparity on the two retinas, and thereby eliminated previous confounding factors.
Our results provide two lines of evidence that stereoscopic depth can be recovered from double images without changes in vergence. First, we demonstrate that observers can reliably judge both depth sign and magnitude from diplopic afterimages (Experiment 1). Second, objective and subjective eye movement measurements show that observers can reliably recover depth from these diplopic stimuli, regardless of whether they initiate vergence eye movements that are consistent with the disparity of the stimulus. That is, most observers did not make vergence responses, yet they could still judge depth. Some observers made small idiosyncratic vergence responses, usually in only one direction but not correlated with the magnitude of the stimulus.
We considered that more robust vergence might have been elicited by the unchanging retinal disparity present in the afterimages and contributed indirectly to the ability to make depth magnitude estimates. However, in line with our eye tracking results, we found that inferred vergence eye movements were inconsistent or absent in response to diplopic afterimages. In spite of this, subjects made reliable judgements of depth magnitude as well as depth sign well beyond the range of fusion for these stimuli. Thus, both eye movement recordings to short-duration stimuli in Experiment 2A and subjective estimates of vergence responses to afterimage stimuli in Experiment 2B provided compelling evidence against the ‘indirect hypothesis’ in judgements of depth sign and magnitude.
The upper disparity limits for stereoscopic depth (the disparity value at which observers can no longer recover depth from disparity) that we found are much smaller than most previously reported values ([2,5,8], but see [4]). These discrepancies are most probably due to differences in the experimental set-up and in the stimuli that were used. For instance, the upper disparity limit is known to vary with the retinal eccentricity of the stimulus [5,18], its spatial frequency content [19] and its width [20–22]. It is therefore difficult to directly compare previous results with those presented here. Importantly, in our open-loop experiment, observers not only reliably judged depth sign, but also estimated depth magnitude accurately for disparities up to about twice the limits of fusion. Moreover, the largest accurate depth estimates from all observers were for diplopic stimuli. This stands in contrast to previous reports, which claim that depth magnitude cannot be recovered from diplopic stimuli without vergence eye movements [23]. Instead, our data suggest that these poor depth magnitude results were most probably due to the brief exposure duration, which degraded their stimuli.
Interestingly, in Experiment 1, we found an asymmetry in both the qualitative and quantitative depth estimates. That is, as disparity is increased, performance in both tasks degrades more quickly when viewing uncrossed (far) than when viewing crossed (near) disparities (figure 3b,c). This asymmetry may reflect the top-back slant of the empirical vertical horopter, caused by the so-called Helmholtz shear [24]. The Helmholtz shear averages about 2.1° [25], which should cause a shift of about 9 arcmin between corresponding points at the eccentricity of the bottom bar. Panum's fusional area is centred on the horopter and also exhibits the Helmholtz shear [10]. If the range of stereoscopic depth is also centred on the horopter [26] then the range of stereoscopic depth should be biased toward near depths in the lower visual field, as we have found.
5. Conclusion
We have examined whether depth percepts of diplopic stimuli rely on disparity alone (‘direct hypothesis’) or whether they rely on indirect inference from fusional vergence eye movements (‘indirect hypothesis’). We showed that observers could reliably recover both depth sign and magnitude from diplopic stereoscopic afterimages without vergence eye movements. Vergence eye movements can be useful and are required to bring very large disparities within the operational range of stereopsis. However, our data clearly support the ‘direct hypothesis’: fusional vergence is not essential to recover depth from diplopic stimuli that engage the stereoscopic system.
Acknowledgements
A.J.L., L.M.W. and R.S.A. designed the study; I.P.H., A.J.L. and R.S.A. built the afterimage equipment used in Experiment 1; A.J.L. collected and analysed the data and prepared figures; A.J.L., L.M.W., R.S.A. and I.P.H. wrote the paper. The authors declare no conflict of interest.
Funding statement
This project was supported by NSERC grants to L.M.W and R.S.A.
References
- 1.Panum PL. 1858. Physiologische Untersuchungen über das Sehen mit zwei Augen. Kiel, Germany: Schwerssche BuchHandlung [Google Scholar]
- 2.Westheimer G, Tanzman IJ. 1956. Qualitative depth localization with diplopic images. J. Opt. Soc. Am. 46, 116–117 (doi:10.1364/JOSA.46.000116) [DOI] [PubMed] [Google Scholar]
- 3.Wheatstone C. 1838. Contributions to the physiology of vision—part the first: on some remarkable and hitherto unobserved phenomena of binocular vision. Phil. Trans. R. Soc. Lond. 128, 371–394 (doi:10.1098/rstl.1838.0019) [Google Scholar]
- 4.Ogle KN. 1952. Disparity limits of stereopsis. Arch. Ophthalmol. 48, 50–60 (doi:10.1001/archopht.1952.00920010053008) [DOI] [PubMed] [Google Scholar]
- 5.Blakemore C. 1970. The range and scope of binocular depth discrimination in man. J. Physiol. 211, 599–622 [DOI] [PMC free article] [PubMed] [Google Scholar]
- 6.Mitchell DE. 1970. Properties of stimuli eliciting vergence eye movements and stereopsis. Vis. Res. 10, 145–162 (doi:10.1016/0042-6989(70)90112-4) [DOI] [PubMed] [Google Scholar]
- 7.Holst E, Mittelstaedt H. 1950. Das Reafferenzprinzip. Naturwissenschaften 37, 464–476 (doi:10.1007/BF00622503) [Google Scholar]
- 8.Richards W, Foley JM. 1971. Interhemispheric processing of binocular disparity. J. Opt. Soc. Am. 61, 419–421 (doi:10.1364/JOSA.61.000419) [DOI] [PubMed] [Google Scholar]
- 9.Jones R. 1977. Anomalies of disparity detection in the human visual system. J. Physiol. 264, 621–640 [DOI] [PMC free article] [PubMed] [Google Scholar]
- 10.Tyler CW. 1991. The horopter and binocular fusion. In Vision and visual dysfunction, vol. 9 (ed. Regan D.), pp. 19–37 Boca Raton, FL: CRC Press [Google Scholar]
- 11.Harwerth RS, Fredenburg PM, Smith EL., III 2003. Temporal integration for stereoscopic vision. Vis. Res. 43, 505–517 (doi:10.1016/S0042-6989(02)00653-3) [DOI] [PubMed] [Google Scholar]
- 12.Ziegler LR, Hess RF. 1997. Depth perception during diplopia is direct. Perception 26, 1225–1230 (doi:10.1068/p261225) [PubMed] [Google Scholar]
- 13.Diner DB, Fender DH. 1987. Hysteresis in human binocular fusion: temporalward and nasalward ranges. J. Opt. Soc. Am. A 4, 1814 (doi:10.1364/JOSAA.4.001814) [DOI] [PubMed] [Google Scholar]
- 14.Fender DH, Julesz B. 1967. Extension of Panum's fusional area in binocularly stabilized vision. J. Opt. Soc. Am. 57, 819–826 (doi:10.1364/JOSA.57.000819) [DOI] [PubMed] [Google Scholar]
- 15.Westheimer G, Mitchell AM. 1956. Eye movement responses to convergence stimuli. Arch. Ophthalmol. 55, 848 (doi:10.1001/archopht.1956.00930030852012) [DOI] [PubMed] [Google Scholar]
- 16.Rashbass C, Westheimer G. 1961. Disjunctive eye movements. J. Physiol. 159, 339–360 [DOI] [PMC free article] [PubMed] [Google Scholar]
- 17.Fredenburg P, Harwerth RS. 2001. The relative sensitivities of sensory and motor fusion to small binocular disparities. Vis. Res. 41, 1969–1979 (doi:10.1016/S0042-6989(01)00081-5) [DOI] [PubMed] [Google Scholar]
- 18.Ogle KN. 1953. Precision and validity of stereoscopic depth perception from double images. J. Opt. Soc. Am. 43, 906–913 (doi:10.1364/JOSA.43.000906) [DOI] [PubMed] [Google Scholar]
- 19.Schor C, Wood I, Ogawa J. 1984. Binocular sensory fusion is limited by spatial resolution. Vis. Res. 24, 661–665 (doi:10.1016/0042-6989(84)90207-4) [DOI] [PubMed] [Google Scholar]
- 20.Wilcox LM, Hess RF. 1995. Dmax for stereopsis depends on size, not spatial frequency content. Vis. Res. 35, 1061–1069 (doi:10.1016/0042-6989(94)00199-V) [DOI] [PubMed] [Google Scholar]
- 21.Richards W, Kaye MG. 1974. Local versus global stereopsis: two mechanisms? Vis. Res. 14, 1345–1347 (doi:10.1016/0042-6989(74)90008-X) [DOI] [PubMed] [Google Scholar]
- 22.Schor CM, Wood I. 1983. Disparity range for local stereopsis as a function of luminance spatial frequency. Vis. Res. 23, 1649–1654 (doi:10.1016/0042-6989(83)90179-7) [DOI] [PubMed] [Google Scholar]
- 23.Foley JM, Richards W. 1972. Effects of voluntary eye movement and convergence on the binocular appreciation of depth. Percept. Psychophys. 11, 423–427 (doi:10.3758/BF03206284) [Google Scholar]
- 24.Helmholtz von H. 1962. Treatise on physiological optics. New York, NY: Dover [Google Scholar]
- 25.Cooper EA, Burge J, Banks MS. 2011. The vertical horopter is not adaptable, but it may be adaptive. J. Vis. 11, 1–19 (doi:10.1167/11.3.20) [DOI] [PMC free article] [PubMed] [Google Scholar]
- 26.Siderov J, Harwerth RS, Bedell HE. 1999. Stereopsis, cyclovergence and the backwards tilt of the vertical horopter. Vis. Res. 39, 1347–1357 (doi:10.1016/S0042-6989(98)00252-1) [DOI] [PubMed] [Google Scholar]


