

Abstract
Ecosystems have a limited buffering capacity of multiple ecosystem functions against biodiversity loss (i.e. low multifunctional redundancy). We developed a novel theoretical approach to evaluate multifunctional redundancy in a microbial community using the microbial genome database (MBGD) for comparative analysis. In order to fully implement functional information, we defined orthologue richness in a community, each of which is a functionally conservative evolutionary unit in genomes, as an index of community multifunctionality (MF). We constructed a graph of expected orthologue richness in a community (MF) as a function of species richness (SR), fit the power function to SR (i.e. MF = cSRa), and interpreted the higher exponent a as the lower multifunctional redundancy. Through a microcosm experiment, we confirmed that MF defined by orthologue richness could predict the actual multiple functions. We simulated random and non-random community assemblages using full genomic data of 478 prokaryotic species in the MBGD, and determined that the exponent in microbial communities ranged from 0.55 to 0.75. This exponent range provided a quantitative estimate that a 6.6–8.9% loss limit in SR occurred in a microbial community for an MF reduction no greater than 5%, suggesting a non-negligible initial loss effect of microbial diversity on MF.
Keywords: ecosystem function, microbial diversity, multifunctional redundancy, accumulation curve, orthologue richness, species loss
1. Introduction
The rapid and continued development of molecular biology and genomic techniques has unveiled immense soil, freshwater and ocean microbial diversity [1–8]. However, the quantitative relationship between microbial diversity and ecosystem function remains unclear. Recent advances in our understanding of plant diversity and ecosystem function in terrestrial ecosystems, which have been achieved by large-scale field experiments [9–13] clearly demonstrate the paucity of studies in microbial communities. Instead of field experiments that manipulate natural microbial diversity levels, ecologists have applied microbial communities as a ‘model’ to test general theory in microcosm settings (see [14,15] for a review). Even in experiments considering relatively high species richness (SR), results indicated the levels of manipulated microbial richness are less than 100, much lower than levels in natural communities [16]. Furthermore, it remains unclear whether variation in ecosystem functions was attributable to differences in community composition at the species level, highly frequent horizontal functional gene exchange among species [17,18], or rapid functional trait evolution of individual species [19].
Many studies have demonstrated that the relationships between microbial diversity and ecosystem functions are weak [20 and references therein]. Microbial decomposer communities often exhibit high redundancy for a single function, such as microbial respiration and biomass production, which has been shown in more extensive plant biodiversity and ecosystem function studies in terrestrial systems [13,21]. Nielsen et al. [20] reviewed 57 studies, and concluded that the saturating relationship between microbial richness and a single ecosystem function was dominant in soil ecosystems, suggesting high functional redundancy in soil microbes. In aquatic ecosystems, linear and saturating patterns are a challenge to distinguish owing to a limited range in microbial richness. The relationship demonstrated by experiments (SR was directly manipulated or indirectly manipulated by a dilution–extinction method) was positive [22–25], negative [24] or non-significant [23–27]. A correlation between microbial richness and a function observed in environmental gradients was positive, fit by an exponential function [28], linearly negative [29] and nonlinearly negative for bacterial production and bacterial respiration [30]. It is notable that the relationship differed when focused on alternative functions [23–25,30]. Some studies indicated it was not SR, but heterogeneity in community composition that explained variability in some functions [24,25,31–36], however, a significant relationship between composition and function was not detected in other studies [32,35,37,38].
Previous studies found that functional redundancy in microbial communities was high [16,20], suggesting an initial loss in microbial diversity was unlikely to substantially affect ecosystem functions. However, this view (i.e. low effects from initial biodiversity loss on ecosystem functions) was highly sensitive to quantitative measures of microbial function. Peter et al. [24,27] and Langenheder et al. [32] demonstrated that if the focal function was more specific (e.g. ability to decompose recalcitrant carbon substrates) than general functions (e.g. respiration and biomass production), the link between SR or community composition and function was greater. More importantly, multifunctional redundancy was generally lower (the degree of multiple functional dependence on diversity was higher) than single-functional redundancy [27,39]. The functional composition associated with multiple carbon substrate utilization patterns (revealed by EcoPlate) was often linked to species composition [25,34]. Gilbert et al. [40] reported a positive correlation between transcript richness (a type of functional richness), and phylogenetic richness by the metatranscriptome approach. These lines of evidence strongly indicated the need to quantify the multifunctionality (MF) of microbial communities. In this way, the role of microbial diversity in ecosystem functioning could be thoroughly evaluated.
A growing social demand exists to better project the future magnitudes of change in decreased microbial diversity, and its consequences on ecosystem functions. Reductions in diversity and shifts in microbial species composition may occur in various ecosystems owing to anthropogenic impacts, e.g. increased nitrogen deposition [41], invasive species introduction and establishment [42], and toxic substance contamination [43]. A quantitative assessment/projection of anthropogenic impacts should be undertaken owing to potential trade-offs between ecosystem functions and services provided from natural microbial assemblages (e.g. regulating services) and ecosystem functions provided from artificial ecosystem modifications (e.g. increased crop production and enhanced bioremediation; [12]). Quantitative MF assessment of natural microbial communities prevents the underestimation of potentially important ecosystem services provided by natural microbial species.
In this study, we provided a new theoretical approach for quantitative evaluation of a microbial community by assessing the following two multifunctional indices: (i) MF and (ii) multifunctional redundancy. As much functional information as possible was incorporated into the evaluation of potential microbial functions by analysing the richness of an evolutionary unit of genetic material, i.e. an orthologue; a gene in different species derived from a common ancestor from speciational processes is an orthologue. Orthologues are generally expected to be functionally conservative; therefore, orthologous genes tend to exhibit a similar function [44]. Because common orthologues are shared by multiple species, we proposed to evaluate orthologue richness in a microbial community, which represents the potential range of functions in the community, and the MF index at the community level. For defining multifunctional redundancy, we used an orthologue accumulation curve, which is a graph of the observed orthologue number (i.e. MF) as a function of SR observed in a community. We subsequently hypothesized that the orthologue accumulation curve can be approximated by the power-law relationship, MF = cSRa. The exponent a serves as a multifunctional redundancy index, whereas c represents the average MF of single species in a community. A smaller a-value can be interpreted as larger multifunctional redundancy, indicating that a loss in SR exhibits fewer impacts on MF. These settings are a natural extension defined for redundancy of a single function [21]. This approach provides a new method to quantitatively evaluate the impact of change in microbial diversity on ecosystem functions.
In order to test the above hypotheses, we conducted community simulations by integrating genomic and ecological information from the database of microbial metagenomics (microbial genome database (MBGD) for comparative analysis, [45]). We also tested the linkage between MF index defined by the orthologue richness and MF observed in microcosm bacterial communities. This was the initial step to quantify the relationship between microbial diversity and MF of a microbial community. Genomic and ecological information enabled us to conduct extensive simulations, which demonstrated multifunctional redundancy was generally low (0.55 < a < 0.75), and therefore quantitatively supported the importance of maintaining microbial diversity.
2. Material and methods
(a). MBGD data compilation
We downloaded the default species set from the orthologue group assignment table (‘default orthologue table’) (‘default’ as of 30 August 2011) from MBGD (http://mbgd.genome.ad.jp/, [45]), which comprised 58 Archaea and 420 Bacteria species; the total orthologue group number was 197 061 (we excluded eukaryotic species and orthologues from the dataset). The single genome can have multiple copies from the identical orthologue group; therefore, we converted the orthologue cluster table into a matrix with binary values (0, 1) by classifying the presence (1) or absence (0) of each orthologue group in each species. The converted table was a simple 478 × 197 061 matrix, which specified the orthologue group present or absent in each species genome. Each of the 478 prokaryotic species in the default species set was derived from different genera (one representative genome from each genus, except for two Archaea species from Methanococcus, [45]); therefore, phylogenetic bias was small in the species list. For each species, we first identified genome size, operationally defined as total sequence size of chromosomes + plasmids, based on MGBD data. We also classified each species into 16 habitat, and three oxygen-requirement types (aerobic, anaerobic or facultative) [46,47] (summarized in the electronic supplementary material, table S1). We included orthologue groups with known functions, and groups without specific functional assignments (orthologues predicted as hypothetical proteins or proteins with unknown function, which occupied more than half of the orthologue groups) in the following analyses, to avoid underestimating microbial MF (based on precautionary principle).
(b). Setting for community simulations
Our objective was to test the power-law relationship between microbial SR, and microbial MF in a community, MF = cSRa, by producing a community orthologue accumulation curve. The list of 478 species was used as the species pool, and we generated several types of ‘pseudo-communities’ from the species pool using four assembly rules. First, we generated domain-specific communities, including Bacterial, Archaeal and prokaryotic communities, which consisted respectively of 420 Bacteria, 58 Archaea and 478 prokaryotes, the latter collectively representing the Bacteria and Archaea taxa. Second, we generated 16 habitat-specific (pseudo-)communities (see the electronic supplementary material, table S1 and appendix S1). Third, we compiled aerobic, anaerobic and facultative communities, based on species oxygen requirements (see the electronic supplementary material, table S1). Forth, with random resamplings from all 478 species, we generated randomly assembled communities with SR from 10 to 470 using an interval of 10. For each SR level, we executed 1000 permutations. The fourth procedure was necessary to assess the influence of an overall community SR on the shape of an orthologue accumulation curve, which acted as a null model.
To evaluate the robustness of the power-law relationship between SR and MF in the pseudo-communities from the default MBGD species pool (which does not ensure the co-occurrence of species in natural environments), five species sets were also prepared: tree holes [16], lake [2], marine [48,49] and our own set from a freshwater pond (see also §2c). Each operational taxonomic unit (OTU) was assigned to the most genetically related MBGD strain, and then species sets were constructed for community simulations, which included both of the default and non-default species from MBGD and multiple species from a single genus (see the electronic supplementary material, tables S2–S5 and appendix S1 for detailed methods).
A smooth orthologue accumulation curve was established using the same methods as those applied to generate a species accumulation curve and its rarefaction [50,51]. We estimated the expected orthologue number observed for any smaller number of species in a community under the assumption of random species sampling. The analytical formulae [51] provided the capacity to directly estimate the expected orthologue number, depending on species number. Subsequently, to test the power-law relationship between SR and MF, we used a log–log linear regression of SR versus MF (i.e. ln[MF] = lnc + aln[SR]) (see also the electronic supplementary material, appendix S2).
(c). Microcosm experiment
A microcosm experiment was designed to test the ecological relevance of the orthologue-based approach for quantifying the MF. A water sample was taken from a eutrophicated pond (33.869° N, 132.771° E, Matsuyama, Japan) and spread onto a low-nutrient medium, R2A agar (Becton–Dickinson, Franklin Lakes, NJ, USA) plate. After 5 days incubation at 25°C, a total 60 of colonies were separately picked up and re-streaked onto R2A agar for isolation. Twenty-four isolates were obtained from 60 colonies, and 20 of 24 isolates were used for microcosm experiments as coexistence species in the natural pond water. The selected 20 strains were identified based on 16S rRNA gene sequencing (see the electronic supplementary material, table S6 and appendix S3).
Each isolated strain was pre-cultured for 4 days at 25°C in R2A medium (Wako Pure Chemical Industries Ltd, Japan) and then inoculated into 100 ml R2A medium in 200 ml glass flasks at 1.0 × 10⁴ cells ml−1. Inoculation volume of each isolates was adjusted based on their cell abundance determined under a fluorescent microscope [52]. Twenty species microcosm was composed of all the 20 species, whereas 5% reduction of SR was simulated by community microcosms that were composed of 19 species from 20 species (all of 20 combinations [20C19] were prepared). The experiments were repeated four times on different dates. One experiment composed of the 20 different combination of 19 species microcosms and four to six of 20 species microcosms. Total four replicates of each 19 of 20 species microcosms and 26 replicates of 20 species microcosms were constructed for functional analysis.
We used Biolog EcoPlate (Biolog, Hayward, CA, USA), which is generally used as a measure of substrate usage ability of a bacterial community [25], as the index of community-level MF. An EcoPlate was composed with 31 response wells with different sole carbon sources. The utilization of each carbon source was measured by the colour development of each well (see also the electronic supplementary material, appendix S3). The colour from each carbon source represented the potential functional rate and the pattern of the functional rates from 31 carbon sources represented the multifunctional potential of the assemblage. The MF was measured as the number of substrates that exceeded discrete functional thresholds (T). Functional thresholds were set at nine quantiles from 0.1 to 0.9 with an interval of 0.1 based on the minimum and maximum observed functioning (relative absorbance) for each substrate [53,54]. The minimum and maximum were calculated across all experimental compositions in each of four experimental dates because the growth condition was variable depending on experimental dates.
3. Results
We initially detected a positive relationship between each species operational genome size (sequence size) and species orthologue richness for Bacteria and Archaea (figure 1a). The positive relationship was maintained between community genome size and community orthologue richness at the prokaryotic community level (figure 1b). After we fit the power-law relationship, the species genome slope fit for Bacteria and Archaea species was greater than the fit for the prokaryotic community (figure 1b); the exponent a expected mean value [95% CI] was 0.8319 [0.8155–0.8482] for the species genome, and 0.6886 [0.6884–0.6889] for the community genome.
Figure 1.

Relationship between genome size and orthologue richness. (a) Species sequence size versus orthologue number. Bacteria and Archaea are represented by black dots and open rectangles, respectively. Species regression line is log (orthologue number) = −4.618 + 0.832 × log (species sequence size) (r2 = 0.955, p < 0.001). (b) Community sequence size versus orthologue number. Community sequence size was calculated for communities generated by resampling methods (see the electronic supplementary material, appendix S2 for more detail) for the orthologue accumulation curve of a prokaryotic community (results are shown as small dots). Community regression line (solid line) is log (orthologue) = −2.475 + 0.689 × log (community sequence size) (r2 = 0.998, p < 0.001). The regression line for species is also shown as a dashed line.
Second, we compared the power-law relationships among domain, habitat-type and oxygen-requirement-specific pseudo-communities that were simulated from the default species set in MBGD as well as five communities from natural environments (figure 2). When communities were constructed from the default species set in MBGD, large variation among communities was observed for the exponent (figure 2a) and intercept (figure 2b). Results from randomly assembled communities indicated that the estimated parameters depended on community SR. The estimated exponents from some communities (e.g. marine (Mr) and deep sea (Ds)) fell into the 95% middle range from 1000 permutations of randomly assembled communities (figure 2a), whereas the values from other communities (e.g. sediment community (Sd_t) and extreme community (Ex_t)) deviated from randomly assembled communities. These results indicated multifunctional redundancy can be habitat-dependent. We found similar differences among communities for the estimated intercept that represented the expected MF in a single species (figure 2b). For communities that were reconstructed from natural assemblages, the estimated exponents are 0.621 for tree holes (TrH, SR = 43 [16]), 0.602 for the freshwater pond in this study (pond, SR = 17), 0.689 for the freshwater lake (lake, SR = 16 [2]), 0.658 and 0.660 for marine (ocean1, SR = 14 [49] and ocean2, SR = 53 [48], respectively; figure 2a), whereas the estimated intercepts are 8.241, 8.303, 8.062, 8.110 and 8.088, respectively (figure 2b).
Figure 2.

(a) Group-dependent exponent and (b) intercept from the log–log regression and comparison with randomly assembled communities. OTU classification into groups is shown in the electronic supplementary material, table S1. B, Bacteria; A, Archaea; B_A, B + A; Tr, terrestrial; Aq, aquatic; Tr_Aq, terrestrial and aquatic; Fw, freshwater; Mr, marine; Ds, deep sea; Sd, aquatic sediment; Sd_M, marine sediment; Sd_F, freshwater sediment; Pc, plant commensalism; Ac, animal commensalism; Pp, plant parasitism; Ap, animal parasitism; Ht, high temperature; Lt, low temperature; Hp, halophilic; An, anaerobic; Aer, aerobic; Facl, facultative; T_t, Tr_Aq + Tr; Aq_t, Tr_Aq + Fw + Mr + Aq + Ds; Sd_t, Sd + Sd_M + Sd_F; Syt. Pc + Ac + Pp + Ap; Ex_t, Ht + Lt + Hp. The upper and lower lines represent middle 95% CI ranges from 1000 permutations of randomly assembled communities. TrH, ocean1, ocean2, lake and pond are the results from the microbial communities described in the electronic supplementary material, tables S2–S6, respectively.
Next, we investigated the dependence of multifunctional redundancy on the total number of orthologue groups included in the analysis (to estimate the exponent of power function, which is an index of multifunctional redundancy). MF was defined by community orthologue richness under our framework. The orthologue accumulation curve, log–log linear regression fit and the exponent estimate were generated using the reduced number of orthologues; we randomly chose 10–99% of orthologues among 197 061 orthologue groups. The randomization simulation demonstrated that orthologue reduction considered in the orthologue accumulation curve resulted in a substantial decrease in the estimated exponent (the slope of log–log linear regression), indicating higher multifunctional redundancy (figure 3).
Figure 3.
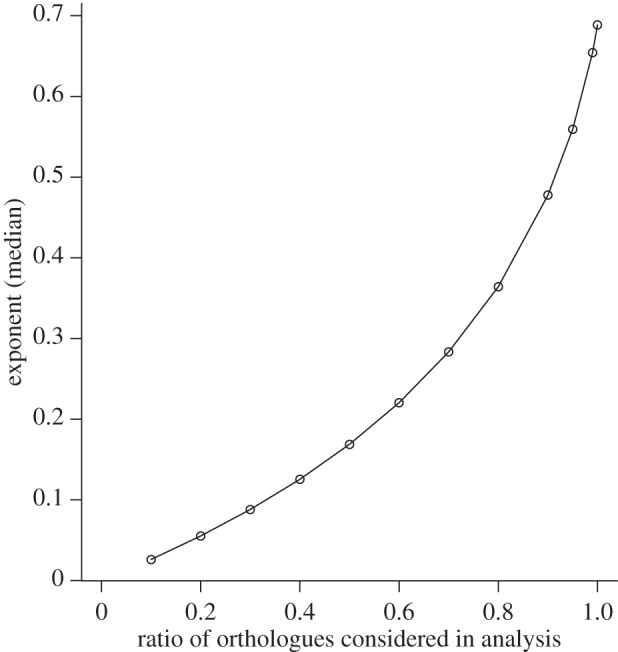
Multifunctional redundancy (exponent a) dependence of the prokaryotic community (SR = 478) on the orthologue ratio randomly chosen in simulations from 197 061 orthologues. In 10–99% of cases, the median values from 200 permutations of randomly chosen orthologues are shown. Only median values are indicated because variation among the 200 permutations was very small. The maximum and minimum values among 200 permutations were very close to the median value (i.e. approx. 0.1% from the median).
In addition, we investigated whether the MF directly measured in microcosm bacterial communities was predicted by the orthologue richness. The total number of orthologues in the control community that was composed of 20 isolates (which are allocated to 17 distinct strains based on MBGD) was 22 007. The maximum reduction of orthologue in the reduced communities that was composed of 19 isolates was 1272, which is about 5.8% from the control community. The number of functions that exceeded the functional thresholds (T), which was the experimental measure of MF, significantly decreased with the reduction of orthologue richness in the experimental assemblages (with T = 0.1, 0.2, 0.3, 0.4, 0.5, 0.6; figure 4).
Figure 4.
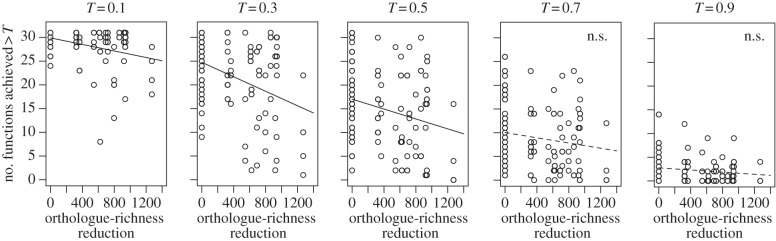
Multifunctionality predicted by orthologue-richness reduction. The effect of orthologue richness reduction on the average number of functions achieved above thresholds (T), where T is the quantile-based ranking of each function across all treatments in each experiment date. Results where T were based on the average functioning were qualitatively similar (see the electronic supplementary material, figure S2). p-values from simple linear least-squares regression are < 0.01 (T = 0.5), < 0.05 (T = 0.6), < 0.001 (T = 0.1, 0.2, 0.4), < 10−4 (T = 0.3), 0.087 (T = 0.7), 0.12 (T = 0.9) and 0.21 (T = 0.8), respectively. n.s., non-significant (p > 0.05).
Finally, we proposed a viable means to estimate acceptable levels of a reduction in microbial SR in a community, which did not result in a severe decrease in community MF. Let x and y denote the reduction (%) in SR, and MF, respectively. From the power-law relationship (MF = cSRa), we easily obtained the following formulae:
| 3.1 |
Equation (3.1) shows that more sever reduction (x) in SR is acceptable with a larger 1/a (i.e. larger multifunctional redundancy) under fixed MF reduction levels (y). The exponent (a) exhibited large variation among communities (figure 3a), therefore a relatively wide range of a (0.55 ≤ a ≤ 0.75) was used for the following analysis. If we ascertained acceptable MF reduction levels (y) based on any ecological or economical conditions and constraints (e.g. less than 1%, 5% or 10%), then we estimated acceptable SR reduction levels (x) using equation (3.1) (table 1). For example, if we accepted a 5% reduction in MF (y = 5), and adopted the most optimistic case (i.e. the lowest exponent value = the highest multifunctional redundancy: a = 0.55 here) or safest case (i.e. a = 0.75), the reduction of SR was less than 8.9% or 6.6%, respectively (table 1). Similarly, if we accepted only a 1% reduction in MF, then the decrease in SR was less than 1.33–1.82%.
Table 1.
Reduction level estimates for no. sp. (%), which is equivalent to reduction in no. orthologue (y) 1%, 5% and 10%. (Exponent (a) values cover a broader range than those shown in the figure 2 for precautionary purposes. Note that most exponent values shown in figure 2 are greater than 0.60.)
| reduction of no. orthologue (%) |
reduction of no. sp. (%) exponent a |
||||
|---|---|---|---|---|---|
| 0.55 | 0.60 | 0.65 | 0.70 | 0.75 | |
| 1 | 1.8174 | 1.6611 | 1.53431 | 1.4255 | 1.33111 |
| 5 | 8.90439 | 8.19366 | 7.58795 | 7.06558 | 6.61048 |
| 10 | 17.4334 | 16.1047 | 14.9638 | 13.9735 | 13.106 |
4. Discussion
(a). The relationship between biodiversity and multifunctionality
The importance of SR for maintaining ecosystem MF has been demonstrated in plant [39,55] and microbial communities [27,39,56]. In this study, we proposed a new method for quantifying MF in a microbial community, which uses accumulating metagenomic information. We defined orthologue richness in the community as MF. We also defined multifunctional redundancy by the exponent of power function estimated by fitting the power function to the orthologue accumulation curve; the larger the exponent, the lower the multifunctional redundancy. Our community simulations demonstrated that multifunctional redundancy is generally low. Reich et al. [21] showed that monofunctional redundancy became lower through time using two datasets derived from grassland biodiversity experiments; the largest exponent values were 0.42 and 0.51 in each dataset. Our simulations generated exponents ranging from 0.57 to 0.71 (figure 2a), which suggests lower multifunctional redundancy rather than monofunctional redundancy, as reported in Gamfeldt et al. [39]. Deep sea benthic metazoan communities also show low multifunctional redundancy; the functional diversity (trait diversity) is the power function of SR with the exponent 0.59 [57]. These results imply the consistency of limited multifunctional redundancy in terrestrial plant, metazoan and prokaryotic communities.
In our study, the estimated exponent (0.832), which was less than unity, derived from the relationship between species genome size and orthologue richness (figure 1a) suggested a certain degree of multifunctional redundancy within an individual genome. It might be argued that orthologue richness in a community can be predicted (extrapolated) by community genome size using the power-law relationship fit within a genome (figure 1a). However, community simulations demonstrated that orthologue richness in a community was much smaller than predicted by the relationship within a genome (figure 1b). In addition, estimated multifunctional redundancy was higher (i.e. estimated exponent 0.689 was lower) than within an individual genome (exponent 0.832). These results indicated the community cannot be regarded as a single superspecies with a very large genome. Instead, sharing common orthologues among species is a key mechanism, responsible for multifunctional redundancy (figures 1b, 2 and 3).
Randomization simulations indicated that multifunctional redundancy (exponent a) was influenced by the degree of data coverage: SR (figure 2a) and orthologue richness (figure 3). However, concurrently multifunctional redundancy differed among domains, habitats and oxygen requirements (figure 2a), suggesting multifunctional redundancy was dependent on habitats and environmental conditions in natural systems. Furthermore, when the estimated exponent in a specific community was outside the 95% CI from randomly assembled communities, the exponent was mostly less than the lower 95% CI limit (figure 2a). These results indicated that genome orthologue composition similarities among species in a specific community can be significantly higher than in randomly assembled communities, suggesting environmental selection (environmental filtering [11]) on orthologue composition. Between domains, multifunctional redundancy was higher in Archaea (A, SR = 58) than Bacteria (B, SR = 420). When the redundancy was separately calculated for each domain in extreme environment community (Ex_t), the exponents were 0.589 and 0.625 for Archaea (SR = 30) and Bacteria (SR = 54), respectively, indicating the higher redundancy in Archaea. It might imply the stronger environmental selection on Archaea community and/or phylogenetically more aggregated choice of species from MBGD for Archaea. Between habitats, an interesting pattern from pseudo-communities is that the marine environment (Mr) showed lower redundancy than the freshwater environment (Fw). Between oxygen requirements, it is worth noting that the facultative groups (Facl) had higher redundancy than anaerobic (An) and aerobic (Aer) groups. Although there are only five examples, results from natural assemblages (TrH, pond, lake, ocean1, ocean2) may imply that the synthesized communities of isolated strains from the identical media (pond and TrH) show functionally more redundant than communities described by non-cultured methods (lake and ocean1, ocean2; the exponent from TrH and pond are much smaller than lake and oceans).
(b). Theoretical implications of community simulations and future directions
Many gene functions remain elusive despite sequence analyses. For example, in the MBGD database, more than 180 000 orthologues are classified simply as hypothetical proteins. Characterizing the physiological traits of prokaryotes is challenging, even for isolated species. Orthologues (genes that presumably share functions) are an effective unit of distinct function, and a cautious approach to avoid underestimating microbial functions, assuming higher orthologue richness implies higher functional diversity or MF. Our simulations found that removing orthologous genome segments from the analysis overestimated multifunctional redundancy (figure 3). In general, species functions are linked to ecosystem functions, which are characterized by functional traits. These traits determine how organisms respond to environmental changes or effect the environment [11]. Ecological functions are characterized by ecological traits, which are responsible for ecological interactions between the focal species and other species. Therefore, it is reasonable to assume that all functional genes are potentially related to ecosystem and/or ecological functions, which, in turn, participate in the diverse array of ecosystem services [12].
Orthologous genes in different species have diverged from a single gene in a common ancestor. Therefore, increased richness of orthologue groups in a community suggests the maintenance of diversification processes during prokaryotic evolution. In other words, MF, which is defined as community orthologue richness, can be characterized as functional diversity, but also evolutionary diversity. Therefore, our approach provides a means to incorporate an evolutionary perspective into biodiversity science (cf. [58] a phylogenetic diversity measure [59]).
Owing to the limited availability of ecological information in genome databases (e.g. only 16 habitat types) [46,47], MBGD pseudo-communities may include species that do not co-occur in natural environments. Therefore, additional examples of a natural microbial community are valuable to evaluate the robustness of the patterns discovered from MBGD pseudo-communities. These data will provide the concrete SR–MF relationship in a specific environment as is shown in our five examples (figure 2). Multifunctional redundancy comparisons between/among different environments generate a more robust depiction of regional variation in the vulnerability of a microbial community. In addition, species versus orthologue richness can be plotted using data from many regions, which provides biodiversity–MF relationships at larger spatial scales. From methodological point of view, it is also notable that the similarity of naturally occurring species found by a culture-independent method to the most genetically related strain in a genome database can be lower (e.g. lower than 90%; see the electronic supplementary material, table S4) than species found by a culture-dependent method (greater than 97%; see the electronic supplementary material, table S6), owing to the dominance of unculturable species in natural assemblages. Under the limited availability of information of uncultured species in a genome database, the combination of culture-independent and culture-dependent approaches would lead to better understanding of the link between microbial SR and genetic (orthologue) richness in natural environments.
Our microcosm experiment was the first step to ascertain the relationship between orthologue richness and microbial processes. Although the degree of manipulation of SR and orthologue richness was small (about 5% reduction from the control), we found that the reduction of the MF directly measured by carbon substrates usage ability could be predicted by the reduction of orthologue richness (figure 4). This result strongly implied the link from potential MF to the actual expression of multiple functions. At the same time, the predictability was generally low (e.g. adjusted r2 = 0.14 when T = 0.3 in figure 4) probably, because we count all of the orthologues equally independently of whether or not their functions are already predicted in MBGD. More detailed analysis on genes with ecological functions will improve the reliability of MF index predicted from genomic data. More interestingly, the low predictability would imply that the community-level functions cannot be fully predicted just by the sum of genetic functions of each species; inter-specific ecological interactions might also matter. Larger scale experiments with larger variations of microbial SR and orthologue richness than our settings will also elucidate the effectiveness of community orthologue richness as the index of ecosystem processes and MF.
(c). Importance of quantitative information for conservation and sustainable biodiversity use
Former studies that focus on a single ecosystem function or service (e.g. productivity, nutrient retention and resistance to species invasion) indicated that direct supporting evidence of the importance of species number was limited by the small number of species present (10 or fewer) [60]. Therefore, Diaz et al. [60] reported the possibility that ‘a reduction in the number of species may initially have small effects’ was difficult to exclude. However, applying a new community MF measure (using a prokaryotic community as a model), our theoretical result demonstrated that even an initial small loss of SR had proportional effects on community (multi)functionality (equation (3.1) and table 1) as well as our experimental result from the microcosms (figure 4). In other words, the levels of reduction in SR required to avoid substantial declines in ecosystem services must be very low (e.g. less than 10%). It is also worth noting that our simulations confirmed a general hypothesis generated in other studies that multifunctional redundancy increases as functional diversity decreases (figure 3) [27,39,55,56].
A contemporary concern for biodiversity conservation is that decision makers require quantitative biodiversity evaluations as part of science-based negotiations and communications. The Convention on Biological Diversity (CBD), Article 14 addresses the importance of appropriate assessment to minimize adverse effects of anthropogenic impacts on biological diversity [61]. For example, the introduction of living modified organisms (LMOs), including crops and microorganisms to natural environments is suspected to result in unfavourable changes to microbial communities supported by soils and watersheds, leading to a loss in microbial diversity and ecosystem function. The Cartagena Protocol on biosafety (a supplement to CBD) requests decision-making based on scientifically sound risk assessments to identify and evaluate the potential adverse effects of LMOs on the conservation and sustainable use of biological diversity [62]. However, the quantitative methods to assess the relationship between biological diversity and ecosystem MF remain underexplored, which prevents any quantitative assessment of LMOs adverse effects, leading to biological diversity and ecosystem services decline. This is the case not only for LMOs. In general, enhancement of one ecosystem service in agro- (such as crop production) and natural ecosystems is accompanied by changes in community structure and SR, which in turn degrades other ecosystem services (e.g. water purification) [12]. Under such trade-offs among different ecosystem service components, and increasing public demands for sustainable biodiversity use that balances costs and benefits, quantitative evaluation of the impacts of biodiversity loss on MF will have greater future importance. The approach proposed in this study serves as a foundation for additional risk assessment developmental procedures to facilitate scientifically sound international decision-making.
Acknowledgements
We thank Chih-hao Hsieh for an early stage of the study design and two anonymous reviewers for valuable comments on the earlier version of the manuscript.
Funding statement
T.M. was supported by National Taiwan University and National Science Council (NSC101-2621-B-002-004-MY3, NSC100-2621-M-002-027-MY3), Taiwan. K.M. was supported by the research fellowship of Kinki University SR-03 and RK20-041.
References
- 1.Torsvik V, Daee FL, Sandaa R-A, Øvreås L. 1998. Novel techniques for analysing microbial diversity in natural and perturbed environments. J. Biotechnol. 64, 53–62 (doi:10.1016/S0168-1656(98)00103-5) [DOI] [PubMed] [Google Scholar]
- 2.Riemann L, Winding A. 2001. Community dynamics of free-living and partile-associated bacterial assemblages during a freshwater phytoplankton bloom. Microb. Ecol. 42, 274–285 (doi:10.1007/s00248-001-0018-8) [DOI] [PubMed] [Google Scholar]
- 3.Moeseneder MM, Winter C, Herndl GJ. 2001. Horizontal and vertical complexity of attached and free-living bacteria of the eastern Mediterranean Sea, determined by 16S rDNA and 16S rRNA fingerprints. Limnol. Oceanogr. 46, 95–107 (doi:10.4319/lo.2001.46.1.0095) [Google Scholar]
- 4.Torsvik V, Øvreås L. 2002. Microbial diversity and function in soil: from genes to ecosystems. Curr. Opin. Microbiol. 5, 240–245 (doi:10.1016/S1369-5274(02)00324-7) [DOI] [PubMed] [Google Scholar]
- 5.Venter JC, et al. 2004. Environmental genome shotgun sequencing of the Sargasso Sea. Science 304, 66–74 (doi:10.1126/science.1093857) [DOI] [PubMed] [Google Scholar]
- 6.Delong EF, et al. 2006. Community genomics among stratified microbial assemblages in the ocean's interior. Science 311, 496–503 (doi:10.1126/science.1120250) [DOI] [PubMed] [Google Scholar]
- 7.Sogin ML, Morrison HG, Huber JH, Welch DM, Huse SM, Neal PR, Arrieta JM, Herndl GJ. 2006. Microbial diversity in the deep sea and the underexplored ‘rare biosphere’. Proc. Natl Acad. Sci. USA 103, 12 115–12 120 (doi:10.1073/pnas.0605127103) [DOI] [PMC free article] [PubMed] [Google Scholar]
- 8.Fuhrman JA, Steele JA, Hewson I, Schwalbach MS, Brown MV, Green JL, Brown JH. 2008. A latitudinal diversity gradient in planktonic marine bacteria. Proc. Natl Acad. Sci. USA 105, 7774–7778 (doi:10.1073/pnas.0803070105) [DOI] [PMC free article] [PubMed] [Google Scholar]
- 9.Hector A, Loreau M, Schmid B, The BIOGEPTH Project 2001. Biodiversity manipulation experiments: studies replicated at multiple sites. In Biodiversity and ecosystem functioning: synthesis and perspectives (eds Loreau M, Naeem S, Inchausti P.), pp. 36–46 Oxford, UK: Oxford University Press [Google Scholar]
- 10.Tilman D, Knops J, Wedin D, Reich P. 2001. Experimental and observational studies of diversity, productivity, and stability. In The functional consequences of biodiversity: empirical progress and theoretical extensions (eds Kinzig AP, Pacala SW, Tilman D.), pp. 42–70 Princeton, NJ: Princeton University Press [Google Scholar]
- 11.Hooper DU, et al. 2005. Effects of biodiversity on ecosystem functioning: a consensus of current knowledge. Ecol. Monogr. 75, 3–35 (doi:10.1890/04-0922) [Google Scholar]
- 12.Millennium Ecosystem Assessment (MA) 2005. Ecosystem and human well-being: synthesis. Washington, DC: Island Press [Google Scholar]
- 13.Schmid B, Balvanera P, Cardinale BJ, Godbold J, Pfisterer AB, Raffaelli D, Solan M, Srivastava DS. 2009. Consequences of species loss for ecosystem functioning: meta-analyses of data from biodiversity experiments. In Biodiversity, ecosystem functioning, and human wellbeing (eds Naeem S, Bunker DE, Hector A, Loreau M, Perrings C.), pp. 14–29 Oxford, UK: Oxford University Press [Google Scholar]
- 14.Naeem S, Hahn DR, Schuurman G. 2000. Producer-decomposer co-dependency influences biodiversity effects. Nature 403, 762–764 (doi:10.1038/35001568) [DOI] [PubMed] [Google Scholar]
- 15.Petchey OL, Morin PJ, Hulot FD, Loreau M, McGrandy-Steed J, Naeem S. 2001. Contribution of aquatic model systems to our understanding of biodiversity and ecosystem functioning. In Biodiversity and ecosystem functioning: synthesis and perspectives (eds Loreau M, Naeem S, Inchausti P.), pp. 127–138 Oxford, UK: Oxford University Press [Google Scholar]
- 16.Bell T, Newman JA, Silverman BW, Turner SL, Lilley AK. 2005. The contribution of species richness and composition to bacterial services. Nature 436, 1157–1160 (doi:10.1038/nature03891) [DOI] [PubMed] [Google Scholar]
- 17.OECD 2010. Guidance document on horizontal gene transfer between bacteria. OECD Series on Harmonisation of Regulatory Oversight in Biotechnology 50, ENV/JM/MONO(2010)40, pp. 1.–: Paris, France: OECD [Google Scholar]
- 18.Wiedenbeck J, Cohan FM. 2011. Origins of bacterial diversity through horizontal genetic transfer and adaptation to new ecological niches. FEMS Microbiol. Rev. 35, 957–976 (doi:10.1111/j.1574-6976.2011.00292.x) [DOI] [PubMed] [Google Scholar]
- 19.Gravel D, Bell T, Barbera C, Bouvier T, Pommier T, Venail P, Mouquet N. 2011. Experimental niche evolution alters the strength of the diversity–productivity relationship. Nature 469, 89–92 (doi:10.1038/nature09592) [DOI] [PubMed] [Google Scholar]
- 20.Nielsen UN, Ayres E, Wall DH, Bardgett RD. 2011. Soil biodiversity and carbon cycling: a review and synthesis of studies examining diversity–function relationships. Eur. J. Soil Sci. 62, 105–116 (doi:10.1111/j.1365-2389.2010.01314.x) [Google Scholar]
- 21.Reich PB, Tilman D, Isbell F, Mueller K, Hobbie SE, Flynn DFB, Eisenhauer N. 2012. Impacts of biodiversity loss escalate through time as redundancy fades. Science 336, 589–592 (doi:10.1126/science.1217909) [DOI] [PubMed] [Google Scholar]
- 22.Wohl DL, Arora S, Gladstone JR. 2004. Functional redundancy supports biodiversity and ecosystem function in a closed and constant environment. Ecology 85, 1534–1540 (doi:10.1890/03-3050) [Google Scholar]
- 23.Jiang L. 2007. Negative selection effects suppress relationships between bacterial diversity and ecosystem functioning. Ecology 88, 1075–1085 (doi:10.1890/06-1556) [DOI] [PubMed] [Google Scholar]
- 24.Peter H, Beier S, Bertilsson S, Lindström ES, Langenheder S, Tranvik LJ. 2011. Function-specific response to depletion of microbial diversity. ISME J. 5, 351–361 (doi:10.1038/ismej.2010.119) [DOI] [PMC free article] [PubMed] [Google Scholar]
- 25.Lyons MM, Dobbs FC. 2012. Differential utilization of carbon substrates by aggregate-associated and water-associated heterotrophic bacterial communities. Hydrobiologia 686, 181–193 (doi:10.1007/s10750-012-1010-7) [Google Scholar]
- 26.Szabó KÉ, Itor POB, Bertilsson S, Tranvik L, Eiler A. 2007. Importance of rare and abundant populations for the structure and functional potential of freshwater bacterial communities. Aquat. Microb. Ecol. 47, 1–10 [Google Scholar]
- 27.Peter H, Ylla I, Gudasz C, Romani AM, Sabater S, Tranvik LJ. 2011. Multifunctionality and diversity in bacterial biofilms. PLoS ONE 6, e23225 (doi:10.1371/journal.pone.0023225) [DOI] [PMC free article] [PubMed] [Google Scholar]
- 28.Danovaro R, Pusceddu A. 2007. Biodiversity and ecosystem functioning in coastal lagoons: does microbial diversity play any role? Estuar. Coast. Shelf Sci. 75, 4–12 (doi:10.1016/j.ecss.2007.02.030) [Google Scholar]
- 29.Obernosterer I, Lami R, Larcher M, Batailler N, Catala P, Lebaron P. 2010. Linkage between bacterial carbon processing and the structure of the active bacterial community at a coastal site in the NW Mediterranean Sea. Microb. Ecol. 59, 428–435 (doi:10.1007/s00248-009-9588-7) [DOI] [PubMed] [Google Scholar]
- 30.Reinthaler T, Winter C, Herndl GJ. 2005. Relationship between bacterioplankton richness, respiration, and production in southern North Sea. Appl. Environ. Microbiol. 71, 2260–2266 (doi:10.1128/AEM.71.5.2260-2266.2005) [DOI] [PMC free article] [PubMed] [Google Scholar]
- 31.Kritzberg ES, Langenheder S, Lindström ES. 2006. Influence of dissolved organic matter source on lake bacterioplankton structure and function-implications for seasonal dynamics of community composition. FEMS Microbiol. Ecol. 56, 406–417 (doi:10.1111/j.1574-6941.2006.00084.x) [DOI] [PubMed] [Google Scholar]
- 32.Langenheder S, Lindström ES, Tranvik LJ. 2006. Structure and function of bacterial communities emerging from different sources under identical conditions. Appl. Environ. Microbiol. 72, 212–220 (doi:10.1128/AEM.72.1.212-220.2006) [DOI] [PMC free article] [PubMed] [Google Scholar]
- 33.Bertilsson S, Eiler A, Nordqvist A, Jørgensen NIG. 2007. Links between bacterial production, amino-acid utilization and community composition in productive lakes. ISME J. 1, 532–544 (doi:10.1038/ismej.2007.64) [DOI] [PubMed] [Google Scholar]
- 34.Leflaive J, Danger M, Lacroix G, Lyautey E, Oumarou C, Ten-Hage L. 2008. Nutrient effects on the genetic and functional diversity of aquatic bacterial communities. FEMS Microbiol. Ecol. 66, 379–390 (doi:10.1111/j.1574-6941.2008.00593.x) [DOI] [PubMed] [Google Scholar]
- 35.Lindström ES, Feng XM, Granéli W, Kritzberg ES. 2010. The interplay between bacterial community composition and the environment determining function of inland water bacteria. Limnol. Oceanogr. 55, 2052–2060 (doi:10.4319/lo.2010.55.5.2052) [Google Scholar]
- 36.Lindström ES, Östman Ö. 2011. The importance of dispersal for bacterial community composition and functioning. PLoS ONE 6, e25883 (doi:10.1371/journal.pone.0025883) [DOI] [PMC free article] [PubMed] [Google Scholar]
- 37.Judd KE, Crump BC, Kling GW. 2006. Variation in dissolved organic matter controls bacterial production and community composition. Ecology 87, 2068–2079 (doi:10.1890/0012-9658(2006)87[2068:VIDOMC]2.0.CO;20) [DOI] [PubMed] [Google Scholar]
- 38.Comte J, del Giorgio PA. 2010. Linking the patterns of change in composition and function in bacterioplankton successions along environmental gradients. Ecology 91, 1466–1476 (doi:10.1890/09-0848.1) [DOI] [PubMed] [Google Scholar]
- 39.Gamfeldt L, Hillebrand H, Jonsson PR. 2008. Multiple functions increase the importance of biodiversity for overall ecosystem functioning. Ecology 89, 1223–1231 [DOI] [PubMed] [Google Scholar]
- 40.Gilbert JA, et al. 2010. The taxonomic and functional diversity of microbes at a temperate coastal site: a ‘multi-omic’ study of seasonal and diel temporal variation. PLoS ONE 5, e15545 (doi:10.1371/journal.pone.0015545) [DOI] [PMC free article] [PubMed] [Google Scholar]
- 41.Allison SD, Hanson CA, Treseder KK. 2007. Nitrogen fertilization reduces diversity and alters community structure of active fungi in boreal ecosystems. Soil Biol. Biochem. 39, 1878–1887 (doi:10.1016/j.soilbio.2007.02.001) [Google Scholar]
- 42.Litchman E. 2010. Invisible invaders: non-pathogenic invasive microbes in aquatic and terrestrial ecosystems. Ecol. Lett. 13, 1560–1572 (doi:10.1111/j.1461-0248.2010.01544.x) [DOI] [PubMed] [Google Scholar]
- 43.Smit E, Leeflang P, Wernars K. 1997. Detection of shifts in microbial community structure and diversity in soil caused by copper contamination using amplified ribosomal DNA restriction analysis. FEMS Microbiol. Ecol. 23, 249–261 (doi:10.1111/j.1574-6941.1997.tb00407.x) [Google Scholar]
- 44.Fang G, Bhardwaj N, Robilotto R, Gerstein MB. 2010. Getting started in gene orthology and functional analysis. PLoS Comput. Biol. 6, e1000703 (doi:10.1371/journal.pcbi.1000703) [DOI] [PMC free article] [PubMed] [Google Scholar]
- 45.Uchiyama I, Higuchi T, Kawai M. 2010. MBGD update 2010: toward a comprehensive resource for exploring microbial genome diversity. Nucleic Acids Res. 38, D361–D365 (doi:10.1093/nar/gkp948) [DOI] [PMC free article] [PubMed] [Google Scholar]
- 46.Lima T, et al. 2009. HAMAP: a database of completely sequenced microbial proteome sets and manually curated microbial protein families in UniProtKB/Swiss-Prot. Nucleic Acids Res. 37, D471–D478 (doi:10.1093/nar/gkn661) [DOI] [PMC free article] [PubMed] [Google Scholar]
- 47.Schneider KL, Pollard KS, Baertsch R, Pohl A, Lowe TM. 2006. The USCS Archaeal genome browser. Nucleic Acids Res. 34, D407–D410 (doi:10.1093/nar/gkj134) [DOI] [PMC free article] [PubMed] [Google Scholar]
- 48.Moeseneder MM, Arrieta JM, Herndl GJ. 2005. A comparison of DNA- and RNA-based clone libraries from the same marine bacterioplankton community. FEMS Microbiol. Ecol. 51, 341–352 (doi:10.1016/j.femsec.2004.09.012) [DOI] [PubMed] [Google Scholar]
- 49.Riemann L, Steward GF, Azam F. 2000. Dynamics of bacterial community composition and activity during a mesocosm diatom bloom. Appl. Environ. Microbiol. 66, 578–587 (doi:10.1128/AEM.66.2.578-587.2000) [DOI] [PMC free article] [PubMed] [Google Scholar]
- 50.Gotelli N, Colwell RK. 2001. Quantifying biodiversity: procedures and pitfalls in the measurement and comparison of species richness. Ecol. Lett. 4, 379–391 (doi:10.1046/j.1461-0248.2001.00230.x0) [Google Scholar]
- 51.Colwell RK, Mao CX, Chang J. 2004. Interpolating, extrapolating, and comparing incidence-based species accumulation curves. Ecology 85, 2717–2727 [Google Scholar]
- 52.Sherr BE, Sherr E, del Giorgio P. 2001. Enumeration of total and highly active bacteria. In Methods in microviology, marine microbiology, vol. 30 (ed. Paul JH.), pp. 130–159 San Diego, CA: Academic Press [Google Scholar]
- 53.Zavaleta ES, Pasari JR, Hulvey KB, Tilman D. 2010. Sustaining multiple ecosystem functions in grassland communities requires higher biodiversity. Proc. Natl Acad. Sci. USA 107, 1443–1446 (doi:10.1073/pnas.0906829107) [DOI] [PMC free article] [PubMed] [Google Scholar]
- 54.Pasari JR, Levi T, Zavaleta ES, Tilman D. 2013. Several scales of biodiversity affect ecosystem multifunctionality. Proc. Natl Acad. Sci. USA 110, 10 219–10 222 (doi:10.1073/pnas.1220333110) [DOI] [PMC free article] [PubMed] [Google Scholar]
- 55.Hector A, Bagchi R. 2007. Biodiversity and ecosystem multifunctionality. Nature 448, 188–191 (doi:10.1038/nature05947) [DOI] [PubMed] [Google Scholar]
- 56.He J-Z, Ge Y, Xu Z, Chen C. 2009. Linking soil bacterial diversity to ecosystem multifunctionality using backward-elimination boosted trees analysis. J. Soils Sedim. 9, 547–544 (doi:10.1007/s11368-009-0120-y) [Google Scholar]
- 57.Danovaro R, Gambi C, Dell'Anno A, Corinaldesi C, Fraschetti S, Vanreusel A, Vincx M, Gooday AJ. 2008. Exponential decline of deep-sea ecosystem functioning linked to benthic biodiversity loss. Curr. Biol. 18, 1–8 (doi:10.1016/j.cub.2007.11.056) [DOI] [PubMed] [Google Scholar]
- 58.Hendry AP, et al. 2010. Evolutionary biology in biodiversity science, conservation, and policy: a call to action. Evolution 64, 1517–1528 (doi:10.1111/j.1558-5646.2010.00947.x) [DOI] [PubMed] [Google Scholar]
- 59.Faith DP. 1992. Conservation evaluation and phylogenetic diversity. Biol. Conserv. 61, 1–10 (doi:10.1016/0006-3207(92)91201-3) [Google Scholar]
- 60.Díaz S, et al. 2005. Biodiversity regulation of ecosystem services. In Ecosystems and human well-being: current state and trends: findings of the condition and trends working group (eds Hassan R, Scholes R, Ash N.), pp. 297–329 Washington, DC: Island Press [Google Scholar]
- 61.United Nations 1992. Convention on Biological Diversity, Article 14. Impact assessment and minimizing adverse impacts. Available at: http://www.cbd.int/doc/legal/cbd-en.pdf.
- 62.United Nations 2000. Cartagena Protocol on biosafety to the Convention on Biological Diversity. Annex III. Risk assessment. Available at: http://bch.cbd.int/protocol/text/.