

Abstract
The evolutionary role of transposable elements (TEs) is still highly controversial. Two key parameters, the transposition rate (u and w, for replicative and non-replicative transposition) and the excision rate (e) are fundamental to understanding their evolution and maintenance in populations. We have estimated u, w and e for six families of TEs (including eight members: IS1, IS2, IS3, IS4, IS5, IS30, IS150 and IS186) in Escherichia coli, using a mutation accumulation (MA) experiment. In this experiment, mutations accumulate essentially at the rate at which they appear, during a period of 80 500 (1610 generations × 50 lines) generations, and spontaneous transposition events can be detected. This differs from other experiments in which insertions accumulated under strong selective pressure or over a limited genomic target. We therefore provide new estimates for the spontaneous rates of transposition and excision in E. coli. We observed 25 transposition and three excision events in 50 MA lines, leading to overall rate estimates of u ∼ 1.15 × 10⁻⁵, w ∼ 4 × 10⁻⁸ and e ∼ 1.08 × 10⁻⁶ (per element, per generation). Furthermore, extensive variation between elements was found, consistent with previous knowledge of the mechanisms and regulation of transposition for the different elements.
Keywords: transposable elements, insertion sequences, rate of transposition, Escherichia coli, mutation accumulation
1. Introduction
Transposable elements (TEs) are thought to be major players in genome organization and evolution. In prokaryotes, the simplest autonomous TEs are called insertion sequences (ISs). Usually, these elements encode no other function than their own mobility: a transposase flanked by short inverted repeats. IS elements are very common in bacterial genomes [1] and show an outstanding ability to mobilize within the host genome [2]. The outcome of such invasion is sometimes unexpected, with cases where transposition was responsible for direct fitness increases [3] or played a major role in adaptation to specific environments [4]. However, most spontaneous transposition events lead to a reduction in the growth rate of bacteria [5]. Consistent with the selfish DNA hypothesis, TEs can nevertheless be maintained because of their high transposition rate despite the deleterious effects they may cause. Theory [6] suggests that, in prokaryotes, TEs can be maintained if there is horizontal transfer and the rate of transposition and excision decreases with copy number [7]. Knowledge about transposition and excision rates is therefore crucial for understanding TE abundance in natural populations [8].
Estimates of the transposition and excision rates of IS elements vary widely, ranging from 10−3 to 10−7 for transposition [9,10] and about 10−9 to 10−10 for excision [11,12]. These estimates were typically obtained by ‘mating-out’ assays [9], papillation assays [13] and fluctuation tests. Estimates obtained by direct observation are rare [14]. Notably, all approaches except direct observation manipulate the system in order to detect events that are very infrequent.
Here, we estimate the spontaneous rates of copy-and-paste (u), cut-and-paste (w) and excision (e) per element, per generation for eight different IS elements, using mutation accumulation (MA) in a mutator strain of Escherichia coli. In our experiment, natural selection is kept at a minimum long enough that a significant number of transposition events, even if deleterious, accumulate. This approach specifically aims at an unbiased estimation of the transposition rate, excluding lethal events.
2. Material and methods
(a). Bacterial strains and growth conditions
The strain used in this study was E. coli K12 MG1655 srl::Tn10 mutS (ancestor of the MA). The 50 lines for which we determined new transposition events were derived from a previous MA experiment which we prolonged for an extra 20 passages following the same protocol. All cultures were grown on Luria–Bertani medium supplemented with agar at 37°C.
(b). DNA extraction and detection of transposition events
DNA isolation from the 50 MA lines at the 70th passage, as well as from the ancestor, was done following a previously described protocol [15]. To determine the number of IS copies in the genome of the ancestor and in the MA lines, we used the vectorette PCR (vPCR) method described in [16]. To reduce the probability of missing transposition events, we performed the vPCR method with two different enzymes (RsaI and BstUI). As shown in [16], this procedure allows a reliable determination of the number of copies of ISs in E. coli's genome. However, because we used a mutator strain, all events were individually confirmed by target sequencing (see the electronic supplementary material for details). The vPCR method revealed 41 events of transposition (including excisions), from which 28 events were confirmed. Half of the non-confirmed events were due to another IS element (IS10), which was present in the ancestor, but was not targeted in this study (its transposition rate approx. 10−4 [14] is too high to be accurately estimated by this methodology). Insertions of IS10, either close to or within the targeted ISs, largely explain the mismatch. One third of the non-confirmed events (excisions) were caused by the deletion of a DNA fragment close to the element but not the element itself. Finally, the remainder of the non-confirmed events resulted from point mutations that presumably affected the restriction site or annealing of a primer.
(c). Estimating the rate of excision and transposition
We used a multi-type branching process [17] to estimate the rates u, w and e independently for each IS. Briefly, we model types (a,b,c) in which a copy-and-paste events, b excisions and c cut-and-paste events have occurred, with respect to the ancestral genotype. Type (a,b,c) thus carries m = m0 + a − b copies of the IS, where m0 is the ancestral copy number for that IS. We assume that type (a,b,c) produces an individual in the next generation of type (a + 1,b,c), type (a,b + 1,c) or type (a,b,c + 1) with probabilities mu, me and mw, respectively; the probability of double events per generation is neglected because the rates are expected to be low. For particular values of u, w and e, we constructed a Markov chain to describe this process over 70 passages, recovering a predicted distribution of types. We then used nonlinear minimization (Nelder–Mead) to find values of u, w and e that minimize the sum of squared error between observed and predicted frequencies of each type.
3. Results
(a). Accumulation of spontaneous transpositions
We determined the transposition and excision events that occurred in 50 MA lines (table 1). In 58% of the lines no events were detected, the remaining lines exhibited between one and three events and more than one event involving the same IS type was detected in only two lines. We observed a significant correlation between the number of initial copies of each IS type and the number of events observed after 80 thinsp;500 generations (figure 1; Spearman's coefficient = 0.78, p = 0.022). This is expected under the conditions used in this study where selection is minimized and the number of observed events should reflect the spontaneous rate of transposition and be proportional to the initial number of copies. It is commonly thought that many TEs are auto-regulated, i.e. their rate of transposition decreases as the copy number increases [10]. Our data do not lend support to this expectation (see electronic supplementary material, figure S1), though the sample size was not sufficient to make definitive conclusions.
Table 1.
Transpositions events confirmed by sequencing per line (from the 70th passage) per IS element type. In the first line, the copy number of each IS element in the reference genome (NC_000913) and in the ancestor is indicated. Each new event is represented as follows: copy-and-paste (+1), cut-and-paste (+1−1) and excision (−1). 29 lines registered no detectable new events. ISs 4, 30 and 150 are not in the table because no transposition events were detected for these elements.
 |
Figure 1.
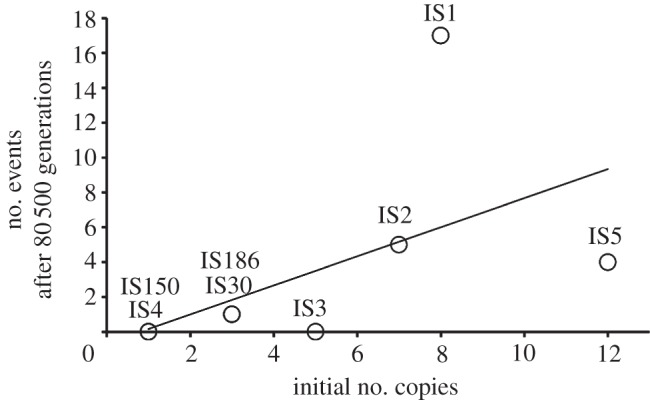
Number of transposition events as a function of initial copy number (for a given IS element). The regression equation is y = 0.83x – 0.67, r2 = 0.30, p = 0.04.
(b). Inferring the ‘effective’ rates of transposition and excision
We estimate the ‘effective’ rates of transposition and excision, that is, the end result of the spontaneous process in terms of keeping, increasing or decreasing the IS copy number. For example, we score all events of IS loss as excisions (or cuts), irrespective of whether they occurred through the classic excision mechanism or were the result of deletions involving a particular IS. Among the IS elements studied, the ‘effective’ preferential mode of transposition is by far the copy-and-paste mechanism. Another clear result is the excess of events including IS1, which represent about 60% of all events. The highest rate of transposition (u = 2.67 × 10⁻⁵ ± 7.89 × 10⁻⁶) was estimated for IS1, followed by IS2 (u = 7.72 × 10⁻⁶ ± 3.29 × 10⁻⁶). Overall, u varied between 2.67 × 10⁻⁵ and 1.38 × 10⁻⁶ ± 1.18 × 10⁻⁶ (IS5). When pooling all the IS elements present in this strain of E. coli, excision events were rare: e estimates are 10 times lower than u. This implies that a reduction in IS copy number by spontaneous mutation alone is unlikely. However, we also found that for some elements (IS2 and IS5), e can be almost as high as u.
Over the 80 500 generations, no events were detected for IS3, IS4 and IS150. In the case of IS4 and IS150, the elements were present in the ancestral genome as a single copy; thus, even if they were to transpose at a rate as high as 10−5, for example, we would need more than 100 000 generations to detect one event (a timescale larger than in our experiment). As for IS3, it is possible that its transposition rate is in fact lower than that of all the others, because all five copies of this element were functional in the ancestral genome, as determined by sequencing.
4. Discussion
Previous estimates of transposition rates in bacteria span several orders of magnitude, from 10−3 to 10−7 [9,10]. Here, we estimate a range of u and w from 2.67 × 10⁻⁵ to 1.16 × 10⁻⁶. Our estimates are less biased than previous estimates, because selection was minimized and transposition was assessed across the whole genome. Furthermore, we include a sufficient number of different IS elements to account for differences between transposition modes.
It has been reported that the spontaneous transposition of IS1 occurs at the relatively low rate of about 10−7 in a standard mating-out assay [18]. These assays involve both conjugation and transposition and are therefore likely to underestimate the transposition rate. Other strategies have also been used. Saito et al. [13] used a papillation assay to estimate the transposition rate of IS1 from a donor plasmid to the chromosome. Briefly, this assay scores a transposition of the IS element (which carries a gene lacking transcription and translational start signals) when it inserts in some position of the genome that restores the gene's expression. This approach only scores as transposition events the ones that restore the gene's function; moreover, it employs a greatly increased expression level of the transposase in order to observe such events. For these reasons, the estimated transposition rate of the order of 10−3 obtained with this method is difficult to interpret. Our estimates for this element, about 10−5 for u and 10−6 for w, somewhat reconcile these extremely disparate previous estimates. Conditions such as non-optimal temperature [19], starvation [20] and other potential stressors can also affect the rate and spectrum of transposition. For example, contrary to our observations (figure 2), Naas et al. [20] detected a rate of transposition for IS5 higher than that for IS1 during storage. Our estimates relate to a period during which E. coli is actively growing (daily transfers), which may explain the differences in the estimates.
Figure 2.

Estimates of transposition rates per element, per generation. Standard deviations are given between brackets. These estimates are based on data reported in table 1. See §2 for details of the analysis. Black and grey dots represent u and w, respectively. Open circles represent rates of excision. n.d. means non determined. Please note that the minimum estimate of u for IS186 and e for IS30 cover zero, therefore these cannot be represented in a logarithmic scale.
The estimated rate of transposition averaged for all the elements of E. coli studied (u ∼ 1.15×10⁻⁵) is higher than the average excision rate (approx. 1.08×10⁻⁶), which suggests that in addition to excision, selection against new insertions helps keeping element numbers low.
A similar procedure from an MA experiment in Drosophila melanogaster produced mean estimates of u and e of 1×10⁻⁴ and 4 × 10⁻⁶ [21]. Understanding why these are about one order of magnitude higher than those in E. coli is an important question, which might be related to the remarkable difference in genome complexity between E. coli and D. melanogaster.
Acknowledgements
We acknowledge S. Trindade for performing the MA.
Funding statement
The research leading to these results received financial support from the European Research Council under the European Community's Seventh Framework Programme (FP7/2007-2013)/ERC grant agreement no. 260421-ECOADAPT, from the Natural Sciences and Engineering Research Council of Canada and from Fundação para a Ciência e Tecnologia (PTDC/BIA-EVF/3247/2012). I.G. acknowledges salary support of LAO/ITQB & FCT.
References
- 1.Mahillon J, Chandler M. 1998. Insertion sequences. Microbiol. Mol. Biol. Rev. 62, 725–774 [DOI] [PMC free article] [PubMed] [Google Scholar]
- 2.Parkhill J, et al. 2003. Comparative analysis of the genome sequences of Bordetella pertussis, Bordetella parapertussis and Bordetella bronchiseptica. Nat. Genet. 35, 32–40 (doi:10.1038/ng1227) [DOI] [PubMed] [Google Scholar]
- 3.Hartl DL, Dykhuizen DE, Miller RD, Green L, de Framond J. 1983. Transposable element IS50 improves growth rate of E. coli cells without transposition. Cell 35, 503–510 (doi:10.1016/0092-8674(83)90184-8) [DOI] [PubMed] [Google Scholar]
- 4.Casacuberta E, González J. 2013. The impact of transposable elements in environmental adaptation. Mol. Ecol. 22, 1503–1517 (doi:10.1111/mec.12170) [DOI] [PubMed] [Google Scholar]
- 5.Elena SF, Ekunwe L, Hajela N, Oden SA, Lenski RE. 1998. Distribution of fitness effects caused by random insertion mutations in Escherichia coli. Genetica 102–103, 349–358 (doi:10.1023/A:1017031008316) [PubMed] [Google Scholar]
- 6.Sawyer SA, Dykhuizen DE, DuBose RF, Green L, Mutangadura-Mhlanga T, Wolczyk DF, Hartl DL. 1987. Distribution and abundance of insertion sequences among natural isolates of Escherichia coli. Genetics 115, 51–63 [DOI] [PMC free article] [PubMed] [Google Scholar]
- 7.Bichsel M, Barbour AD, Wagner A. 2010. The early phase of a bacterial insertion sequence infection. Theor. Popul. Biol. 78, 278–288 (doi:10.1016/j.tpb.2010.08.003) [DOI] [PubMed] [Google Scholar]
- 8.Touchon M, Rocha EPC. 2007. Causes of insertion sequences abundance in prokaryotic genomes. Mol. Biol. Evol. 24, 969–981 (doi:10.1093/molbev/msm014) [DOI] [PubMed] [Google Scholar]
- 9.Craig NL. 1996. Transposition. In EcoSal—Escherichia coli and Salmonella: cellular and molecular biology (ed. Neidhardt F.), pp. 2239–2362 Washington, DC: ASM Press [Google Scholar]
- 10.Craig NL, American Society for Microbiology 2002. Mobile DNA II. Washington, DC: ASM Press [Google Scholar]
- 11.Kleckner N. 1989. Transposon Tn10. In Mobile DNA (eds Berg DE, Howe MM.), pp. 227–268 Washington, DC: ASM Press [Google Scholar]
- 12.Berg DE, Egner C, Hirschel BJ, Howard J, Johnsrud L, Jorgensen RA, Tlsty TD. 1981. Insertion, excision, and inversion of Tn5. Cold Spring Harb. Symp. Quant. Biol. 45, 115–123 (doi:10.1101/SQB.1981.045.01.020) [DOI] [PubMed] [Google Scholar]
- 13.Saito T, Chibazakura T, Takahashi K, Yoshikawa H, Sekine Y. 2010. Measurements of transposition frequency of insertion sequence IS1 by GFP hop-on assay. J. Gen. Appl. Microbiol. 56, 187–192 (doi:10.2323/jgam.56.187) [DOI] [PubMed] [Google Scholar]
- 14.Shen MM, Raleigh EA, Kleckner N. 1987. Physical analysis of Tn10- and IS10-promoted transpositions and rearrangements. Genetics 116, 359–369 [DOI] [PMC free article] [PubMed] [Google Scholar]
- 15.Wilson K. 2001. Preparation of genomic DNA from bacteria. In Current protocols in molecular biology (eds Ausubel FM, Brent R, Kingston RE, Moore DD, Seidman JG, Smith JA, Struhl K.), pp. 00:2.4.1–2.4.5 Hoboken, NJ: John Wiley & Sons, Inc; [DOI] [PubMed] [Google Scholar]
- 16.Zhong S, Dean A. 2004. Rapid identification and mapping of insertion sequences in Escherichia coli genomes using vectorette PCR. BMC Microbiol. 4, 26 (doi:10.1186/1471-2180-4-26) [DOI] [PMC free article] [PubMed] [Google Scholar]
- 17.Linda J, Allan S. 2003. An introduction to stochastic processes with applications to biology. Upper Saddle River, NJ: Pearson Prentice Hall [Google Scholar]
- 18.Siguier P, Perochon J, Lestrade L, Mahillon J, Chandler M. 2006. ISfinder: the reference centre for bacterial insertion sequences. Nucleic Acids Res. 34, D32–D36 (doi:10.1093/nar/gkj014) [DOI] [PMC free article] [PubMed] [Google Scholar]
- 19.Ohtsubo Y, Genka H, Komatsu H, Nagata Y, Tsuda M. 2005. High-temperature-induced transposition of insertion elements in Burkholderia multivorans ATCC 17616. Appl. Environ. Microbiol. 71, 1822–1828 (doi:10.1128/AEM.71.4.1822-1828.2005) [DOI] [PMC free article] [PubMed] [Google Scholar]
- 20.Naas T, Blot M, Fitch WM, Arber W. 1994. Insertion sequence-related genetic variation in resting Escherichia coli K-12. Genetics 136, 721–730 [DOI] [PMC free article] [PubMed] [Google Scholar]
- 21.Maside X, Assimacopoulos S, Charlesworth B. 2000. Rates of movement of transposable elements on the second chromosome of Drosophila melanogaster. Genet. Res. 75, 275–284 (doi:10.1017/S0016672399004474) [DOI] [PubMed] [Google Scholar]