
FIGURE 1.
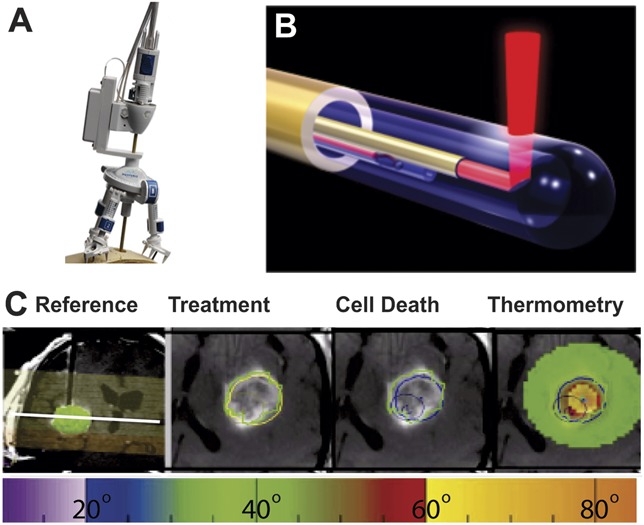
Magnetic resonance imaging (MRI)–guided Neuroblate focused laser interstitial thermal therapy. A, tripod base affixed to surface with laser probe visible. B, rendering of Neuroblate probe with laser emerging orthogonally to tip. C, trajectory strategy, treatment, and cell death areas, and thermometry measurements. The target region was defined preoperatively based on MRI (green sphere, on left and green lines). Intraoperative axial images show enhancing lesion within target region (green line), 45°C thermal dose line (yellow), and 52°C thermal dosage line (blue). Thermometry measurements (right) in degrees Celsius are plotted in space relative to the MRI within the region of thermometry monitoring (light green). A thermometry temperature color key is shown at bottom.