

Abstract
Background
The cotton aphid, Aphis gossypii Glover, is a destructive insect pest worldwide; it directly or indirectly damages (virus transmission) 300 species of host plants. Knowledge of their ecologically adaptive mechanisms at the molecular level may provide an essential and urgent method to effectively control this pest. However, no transcriptome information is available for the cotton aphid and sequence data are scarce. Therefore, we obtained transcriptome data.
Results
To facilitate such a study, two cotton aphid transcriptomes at different growth stages of cotton, seedling and summer, were sequenced. A total of 161,396 and 66,668 contigs were obtained and assembled into 83,671 and 42,438 transcripts, respectively. After combining the raw date for both transcriptomes, the sequences were reassembled into 66,695 transcripts, and 52,160 were annotated based on BLASTX analyses. Comparison of the transcriptomes revealed that summer presented less challenges for the cotton aphids than the seedling stage of cotton. In total, 58 putative heat shock protein genes and 66 candidate cytochrome p450 genes were identified with BLASTX.
Conclusions
Our results form a basis for exploring the molecular mechanisms of ecological adaption in the cotton aphid. Our study also provides a baseline for the exploration of abiotic stress responses. In addition, it provides large-scale sequence information for further studies on this species.
Introduction
Aside from direct damage, Aphis gossypii Glover is an important vector of many viral diseases in the early cotton season [1]. Moreover, high aphid densities later in the cotton season also present risks because they produce copious amounts of honeydew, which blackens the leaf, decreases photosynthetic activity, and contaminates the lint resulting in severely reduced lint quality [2]. In general, there are two cotton aphid breakouts each year, during the seedling of cotton andsummer, and exhibit phenotypic differences due to environmental heterogeneity in China. Morph I, with a larger body size and darker color (usually dark green or black) is found on seedlings and young cotton plants, where they reproduce parthenogenetically and cause direct feeding damage. Morph II are again asexual but are smaller and light green in colour and are found on older plants during the summer where they resist high temperatures and have a high fecundity resulting in high levels of feeding damage [3].
The evolutionary direction of environmental responses varies in phytophagous insects. Some species evolve towards dormancy [4] and diapause [5], and others towards migration [6]. Heat shock proteins (Hsps) play a vital role in dealing with environmental stress [7]. These proteins function as molecular chaperones that maintain or return proteins to their functional state, prevent the indiscriminate aggregation of denatured proteins, and target unfolded or aggregated proteins for degradation or removal [8]. Another important protein is the cytochrome P450 enzyme (P450), which metabolizes a wide range of endogenous and exogenous deleterious substances to protect live cells [9], [10]. P450 is involved in essential physiological functions in insects, e.g., signal molecule metabolism, adaptation to host plants, xenobiotic metabolism, insecticide resistance, and odorant processing in the antennae [11]–[13]. Several P450s are inducible by phenobarbital, pesticides, and natural compounds [14]. Therefore, we are interested in studying the molecular pathways involved in cotton aphid thermotolerance and elucidating the phenotypic plasticity that allows them to occupy a wide variety of environments. Knowledge of insect ecological adaptability is also of practical importance in potential applications for pest control.
Cotton aphid control has relied largely on the use of chemical insecticides resulting in the development of high levels of resistance [15]. Aphids can very quickly become a major problem when chemical controls fail because of resistance; developing a method to effectively control this pest is essential and urgent. Deep sequencing data can provide extensive information on genomes and gene expression profiles. Such data could serve as a valuable resource ultimately leading to more effective pest control methods. Transcriptome sequencing has been successfully used in many insects [16]–[23], but no such information has been reported for cotton aphids. Therefore, studies on the ecological adaptation mechanisms at the molecular level using comparative transcriptome analysis in this species will be of great value to researchers and growers.
In this study, we constructed two whole-body cDNA libraries, from Morph I and Morph II, and obtained 83,671 and 42,438 distinct transcripts by Illumina RNA sequencing and sequence assembly, respectively. In total, 58 putative Hsps and 66 candidate P450s were identified with BLASTX. In addition, 40 Hsp gene expression profiles were compared among different morphological and developmental stages. Disruption of Hsp and P450 gene products could potentially be exploited in a novel control strategy.
Results and Discussion
Transcriptome sequencing and sequence assembly
Two libraries from MorphI and MorphII were constructed. A total of 26,107,304, and 29,230,678 raw reads were obtained from the two transcriptomes (Table 1), respectively. After cleaning and quality checks, the clean reads were assembled into 161,396 and 66,668 contigs with a N50 length of 1180 and 446 nt. The size distributions of the contigs are shown in Figure S1. The contigs were further assembly by connecting the contigs based on the paired-end reads for gap filling between each two contigs to build transcripts sequence with the least Ns. Finally 83,671 and 42,438 transcripts were obtained, with mean lengths of 953 and 561, respectively (Table 1). The length distributions of the transcripts are given in Figure S2A. After combining the transcriptomes, 66,695 transcripts were abtained, with a mean length of 860 and N50 1492 (Table 1). Of these assembled transcripts, 31,704 (47.54%) were >500 bp in length. The size distributions of the combined transcripts are given in Figure S2B. The clean reads obtained in this study have been submitted and available from the NCBI/SRA database (SRA experiment accession number: SRX286372).
Table 1. Summary statistics of the Aphis gossypii transcriptomes.
| Morph I | MorphII | Combined | |
| Total raw reads | 26,107,304 | 29,230,678 | 55,337,982 |
| Total clean reads | 21,602,996 | 23,947,206 | 45,550,202 |
| Total clean nucleotides (nt) | 2,160,299,600 | 2,394,720,600 | 4,555,020,200 |
| Q20 percentage | 96.74% | 96.94% | — |
| N percentage | 0.00% | 0.00% | — |
| GC percentage | 33.51% | 34.80% | — |
| Contigs | 161,393 | 66,668 | — |
| Total length of contigs | 46,081,473 | 28,405,764 | — |
| Mean length of contigs | 286 | 426 | — |
| N50 of contigs | 446 | 1180 | — |
| Transcripts | 83,671 | 42,438 | 66,695 |
| Total length of transcripts | 46,931,901 | 40,429,861 | 57,364,802 |
| Mean length of transcripts | 561 | 953 | 860 |
| N50 of transcripts | 982 | 1914 | 1492 |
| Total consensus sequences | 83,671 | 42,438 | 66,695 |
| Distinct clusters | 21,280 | 11,981 | 21,272 |
| Distinct singletons | 62,391 | 30,457 | 45,423 |
Gene identification and annotation
To annotate these transcripts, all distinct sequences longer than 200 bp were searched against the NR, Swiss-prot, and KEGG protein databases by BLASTX with a cut-off E-value of 10−5 (Table S1). According to this method, a total of 46,137 (69.18% of all distinct sequences), 34,877 (52.29%), and 31,677 (47.50%) transcripts were annotated by NR, Swiss-prot, and KEGG, respectively (Figure 1). A much higher cut-off E-value of 10−20 was also used to search against NR, Swiss-prot, and KEGG, and 36,951, 24,187, and 23,100 transcripts were returned in the BLASTX results, respectively. In total, 58 putative Hsps and 66 candidate P450s were identified with BLASTX (Table S2 and File S1). The E-value distribution of the transcripts annotated by the NR database are shown in Figure 2A, and the similarity distribution varied from 14% to 100% (Figure 2B). Overall, about 68% of the annotated transcripts had an E-value <10−30 and 18,494 sequences had a similarity >80%.
Figure 1. Distribution of similarity search results illustrated by Venn diagrams.
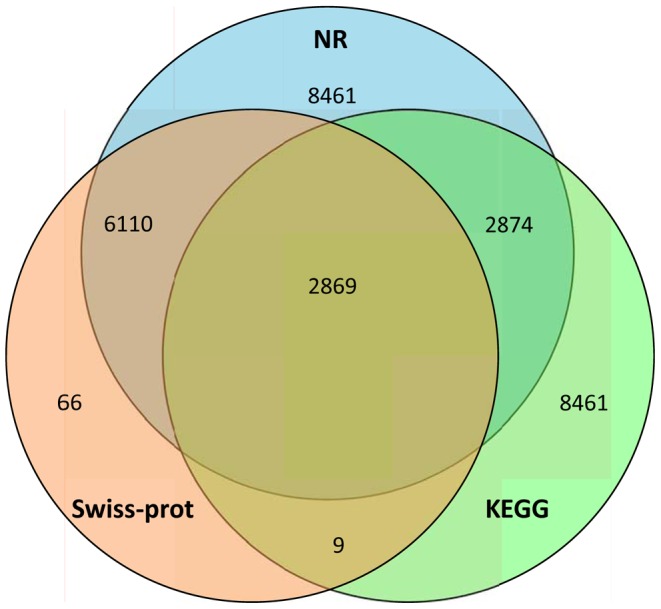
The numbers are the sum of transcripts annotated by NR, Swiss-prot, and KEGG. The overlap regions among the three circles contain the number of transcripts that share BLASTX similarity with respective databases.
Figure 2. Characteristics of homology search of sequences against the Nr database.

(A) E-value distribution of BLAST hits for each distinct sequence with a cut-off E-value of 10−5. (B) Similarity distribution of BLAST hits for each unique sequence. (C) Transcripts were searched against the NR protein database using BLASTX with a cutoff E-value <10−5 and the proportions of each species (represented by different colors) graphed. Species with proportions of >3% are shown.
The species distribution of the transcripts was annotated with the NR database. The cotton aphid sequences exhibited substantial matches with Acyrthosiphon pisum (51.84%) followed by Megachile rotundata (7.08%), Nasonia vitripennis (6.61%), Harpegnathos saltator (3.91%), Camponotus floridanus (3.85%), Bombus impatiens (3.71%), and Acromyrmex echinatior (3.25%) (Figure 2C). These percentages mean that the cotton aphid transcripts identified are most similar to A. pisum and reveal a high degree of sequence homology between hemiptera and hymenoptera.
In addition, all of the 58 putative Hsp genes were used to confirm the transcriptome assemblies by sequencing their polymerase chain reaction (PCR) products. The sequences had ≥99% identities at the nucleic acid level with corresponding sequences from the combined transcriptome, indicating that the algorithm has worked as expected.
Phylogenetic analysis
Hsp genes
Of the Hsps identified, 43, along with 50 sequences from other insects, were used to construct a phylogenetic tree. Of the 43 transcripts used in the phylogenetic analysis, 39 contained complete open reading frames (ORFs) with putative start and stop codons and four corresponded to partial sequences based on sequence analysis. According to the phylogenetic analysis, the cotton aphid Hsps segregated into six families: Hsp90, Hsp70, Hsp60, Hsp40, sHsp, and Hsp10 (Figure 3).
Figure 3. Phylogenetic tree of candidate Hsps from cotton aphids and other species.

The cotton aphid transcripts are labeled CL (clusters) and U (transcripts). CL-X: CL-contigX. Values at the nodes indicate bootstrap percentages based on 1000 replicates and branches with bootstrap values above 50% are indicated.
Of the 43 Hsps, seven candidate Hsp60 and three Hsp10 genes were identified. Hsp10 is analogous to the bacterial GroES subunit that co-chaperones Hsp60 for protein folding (Figure 3) [24], [25]. In addition, Hsp10 plays an important role in protecting cells from stress caused by infection and inflammation [26]. The diverse physiological functions are associated with its changeable location in cellular compartments [27]–[30]. Hsp60s are the most universal molecular chaperones being present in all kingdoms, e.g., eubacteria, eukaryotic organelles (group I), archaea, and the eukaryotic cytosol (group II). They all share a common structure and basic functional mechanism preventing the indiscriminant aggregation of unfolding proteins by oligomerizing in two rings placed back-to-back [31], [32]. Most research on Hsp10 and HSP60 has focused on humans [33]. Their roles in insects have not yet been clearly defined. The cotton aphid transcriptome analysis gives an overview of Hsp10 compared with other insects and provides sequence and phylogenetic information for future studies.
The sHsps are small molecular mass heat shock proteins (12–43 kDa) that function as molecular chaperones by forming a folding-competent state that helps the cell to withstand stresses from the indiscriminate aggregation of denatured proteins in an ATP-independent manner [7], [34]. Recently, some sHsps have been identified from Bombyx mori (16), Drosophila melanogaster (11), Apis mellifera (10), Tribolium castaneum (10), and Anopheles gambiae (7) by genome sequencing [35]–[37]. In our study, eight sHsp homologous sequences were identified (Figure 3). Six of these transcripts have complete ORFs. To characterize these genes, functional and structural studies are needed to provide insights on the detailed mechanisms of their function and role in development.
Hsp40/DnaJ, which are important for protein translation, folding, unfolding, translocation, and degradation, are Hsp70-mediated ATPase activity co-factor/co-chaperones [7]. Hsp/DnaJ can bind to Hsp70 and be categorized into three groups by the J domain [38], [39]. In our study, five putative Hsp40 genes were identified, and four of them had complete cDNA lengths (Figure 3).
The Hsp70 family is the most structurally and functionally conserved group [40]. Under normal physiological conditions, Hsp70s function in the routine de novo folding of proteins. Yet, under stress they prevent the aggregation of indiscriminate proteins by tightly binding unfolding proteins and can even refold aggregated proteins [41]. Some studies have revealed that Hsp70 may contribute to mosquito dehydration tolerance [42] and respond to ultraviolet A (UVA) exposure [43]. Eleven putative Hsp70 genes were identified (Figure 3). The function of these candidate genes requires further study.
Hsp90s are special proteins present at very high concentrations under normal physiological conditions and are up-regulated by stress [7], [44]. Under heat shock, they act as a sequestration unit with other co-chaperones and play a more basic holding role preventing the aggregation of unfolded proteins [7], [45]. We identified six putative Hsp90 genes from the cotton aphid transcriptome (Figure 3). The function of Hsp90 under normal and stress conditions in cotton aphids requires further study.
P450 genes
Of the 66 putative P450 genes, 45 genes (containing 23 full-length sequences) >230 amino acids in length were used to construct a phylogenetic tree along with 49 A. pisum P450s (Figure 4). The phylogenetic analysis results revealed that these 45 predicted P450s belonged to four major clades [14], namely the CYP2, CYP3, CYP4, and mitochondrial clades. CYP3 were the most numerous of the P450 genes.
Figure 4. Phylogenetic tree of candidate cytochrome P450s from cotton aphids and A. pisum.

The cotton aphid transcripts are labeled CL (clusters) and U (transcripts). Apis: A. pisum. CL-X: CL-contigX. Values at the nodes indicate bootstrap percentages based on 1000 replicates and branches with bootstrap values above 50% are indicated.
Nine of the putative P450 genes belong to the CYP2 family; these may be involved in essential physiological functions. Eighteen candidate P450 genes were identified as CYP3 members, which are involved in xenobiotic metabolism and insecticide resistance, several are inducible by phenobarbital, pesticides, and natural products [14]. Eleven sequences were putative members of the CYP4 family, some of these clade members are clearly inducible by xenobiotics and are linked to odorant or pheromone metabolism [14]. Seven putative mitochondrial P450 members were also identified in our study (Figure 4).
Transcriptome changes in different life stages
In this study, comparative analysis of two transcriptomes in different life stages was used to determine gene expression. Although more raw reads were sequenced from the MorpII than the MorpI transcriptome, there were 42,438 transcripts assembled in MorpII which was far fewer than in MorpI (83,671 about 50%) (Table 1). This observation suggests that, to develop an energy-efficient mode of life, genes unnecessary for cotton aphid survival might be silenced or expressed at low levels. In contrast, genes involved in reproduction and metabolism are likely expressed at higher levels.
To evaluate gene expression abundances, the absolute value of the log2 ratio of FPKM (Fragments Per Kilobase per Million mapped reads) ≥1 and false discovery rate (FDR) were used as the threshold to judge the significance of gene expression differences. In the comparative analysis, 20,679 transcripts were noticeably up-regulated in MorpI and 7393 MorpII transcripts were expressed at significantly higher levels (Figure 5). Thus, more genes were necessary for cotton aphids to cope with environmental impacts during the seedling stage of cotton than summer. In other words, environmental variables are more harmful to aphids in the seedling stage of cotton than to those in the summer. The ambient environment experienced during the summer might be less stressful for cotton aphids.
Figure 5. Differentially expressed transcripts in different cotton aphid life stages.
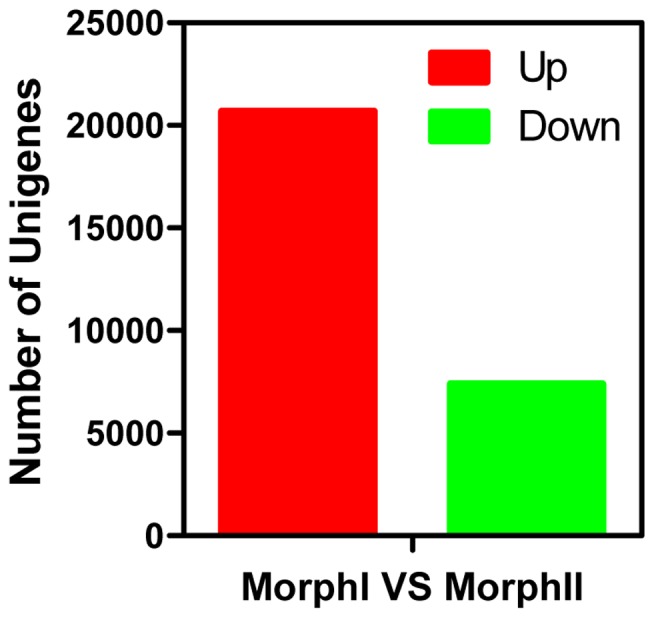
Numbers of up- and down-regulated transcripts compared between the MorphI and MorohII.
To further compare the two transcriptomes, we give insights into 100 of the most differentially up-regulated MorpI and MorpII transcripts (Table S3 and S4). Of the top 100 up-regulated MorpI transcripts, 42 ribosomal proteins, 5 metabolic enzymes, 4 Hsps, and 4 cytoplasmic oxidases were annotated. However, no ribosomal proteins, Hsps, or cytoplasmic oxidases were identified from the top 100 up-regulated MorpII transcripts. In contrast, 15 metabolic enzymes, including maltase, glucose dehydrogenase, and aspartate aminotransferase, were annotated in the top 100 up-regulated MorpII transcripts. The enrichment of cytoplasmic oxidases may inhibit metabolic enzymes. This could explain why many metabolic enzymes were down-regulated in seeding stage, as in the aphid Macrosiphum euphorbiae [46]. The up-regulated of Hsps and cytoplasmic oxidases, which deal with hostile environmental factors, may indicate an uncomfortable eco-environment during this period. However, the up-regulation of metabolic enzymes and the absence of ribosomal proteins, Hsps, and cytoplasmic oxidases in the top 100 revealed that metabolism increases and many genes are either translated into proteins at low levels or not at all. Compared with MorpI genes, the up- and down-regulation of MorpII genes may indicate an energy-efficient mode of life has been developed in adaptation to the comfortable summer environment. This is consistent with our conjecture that summer is more comfortable for cotton aphids than the seedling stage of cotton.
Quantitative real-time PCR validation of Hsps
To elucidate the function of the Hsp genes identified, we focused on their expressions in different developmental stages. Overall, 14 Hsp genes exhibited obvious MorphI-biased expression; one was specifically expressed in the MorphI. However, 4 Hsp genes were expressed more in the MorphII, and one was MorphII specific. All of the Hsp genes were in fact genes and not transcripts or alternative splicing isoforms, any redundant sequences were removed following BLASTX against the NCBI Nr database and alignment with ClustalX 1.83. The other genes were expressed at similar levels in both stages (Figure 6 and Table S5). These results reveal that cotton aphids require more Hsps to resist the hostile environmental factors experienced during the seedling stage of cotton, which is in accordance with our hypothesis. The specifically expressed Hsp genes may play important roles in dealing with the special hostile environmental factors of that stage. In addition, different Hsp gene expression profiles suggest that they are assigned distinct biological tasks.
Figure 6. Verification of 48 Hsp genes in different morphological and developmental stages.

(A) Hsp10 family gene expression analysis. (B) Hsp40 family gene expression analysis. (C) Hsp60 family gene expression analysis. (D) Hsp70 family gene expression analysis. (E) Hsp90 family gene expression analysis. (F) sHsp family gene expression analysis. 1: unwinged adults of MorphI; 2: unwinged nymphs of MorphI; 3: winged adults of MorphI; 4: winged nymphs of MorphI; 5: unwinged adults of MorphII; 6: unwinged nymphs MorphII; 7: winged adults of MorphII; 8: winged nymphs of MorphII.
Conclusions
Using next-generation sequencing technology, we have sequenced two transcriptomes and provided large-scale sequence information for the cotton aphid and identified 58 putative Hsps and 66 candidate P450s with BLASTX. Understanding how structure, function, and gene expression interact in the abiotic stress responses of this species will improve biological control in sustainable agriculture. Comparison of the transcriptomes at different life stages revealed that summer was more favorable for cotton aphids than the seedling stage of cotton. Further investigation is required to elucidate the ecological adaptation mechanism.
Materials and Methods
Insect samples
Cotton aphids were collected on June 3 (MorphI) and August 5 (MorphII) from cotton field of the Institute of Cotton Research of CAAS. Those that had not been parasitized by parasitic wasps were selected and reared for 2 days in incubators using cotton plants. After 2 days, any parasitized aphids were identified and excluded from the experiment. MorphI were reared in 22±1°C, 65±5% relative humidity (RH), and a 14-h light: 10-h dark photoperiod. MorphII were reared in 28±1°C, 65±5% RH, and a 14-h light: 10-h dark photoperiod. The rearing temperatures were set according to the environmental conditions under which the aphids were collected. One hundred each of MorphI and MorphII were used for transcriptome sequencing. One hundred unwinged nymphs, unwinged adults, winged nymphs, and winged MorphI and MorphII adults, were collected and stored at −80°C until required in three replicates for expression profiling by real-time-PCR. There are no replicates for the RNA-seq samples.
cDNA library construction and Illumina sequencing
Total RNA was extracted with the SV Total RNA Isolation System (Promega, Madison, WI, USA) following the manufacturer's protocol. cDNA library construction and Illumina sequencing of the samples were performed at the Beijing Genomics Institute, Shenzhen, China [47]. Poly-adenylated RNAs were isolated from 20 µg of pooled total RNA using oligo (dT) magnetic beads and fragmented into short fragments in the presence of divalent cations in fragmentation buffer at 94°C for 5 min. Using these cleaved, short fragments as templates, random hexamer primers were used to synthesize first-strand cDNA. Second-strand cDNA was generated using buffer, dNTPs, RNAseH, and DNA polymerase I. Following end repair and adaptor ligation, short sequences were amplified by PCR and purified with a QIAquick® PCR extraction kit (Qiagen, Venlo, The Netherlands), and sequenced on a HisSeq™ 2000 platform (San Diego, CA, USA). The reaction conditions of the first- and second-strand cDNA synthesis and end repair and adaptor ligation are given in File S2.
Assembly and function annotation
Transcriptome de novo assembly was carried out with the short read assembly program Trinity (version 20120608, the assembly process is shown in File S3) [48], which generated two classes of transcripts: clusters (prefix CL) and singletons (prefix U). Transcripts larger than 150 bp were aligned by BLASTX to the Nr (release-20121005) (ftp://ftp.ncbi.nih.gov/blast/db/), Swiss-Prot (release-2012_08) (ftp://ftp.uniprot.org/pub/databases/uniprot/previous_releases/), KEGG (release 63.0) (http://www.genome.jp/) [49], and COG (release-20090331) (http://www.ncbi.nlm.nih.gov/COG/) (E-value <10−5) databases, retrieving proteins with the highest sequence similarity with the given transcripts along with their protein functional annotations based on different databases. We then used the Blast2GO program [50] for GO annotation of the transcripts and WEGO software [51] to plot the GO annotation results. In addition, to confirm transcriptome assemblies, all of the 58 putative Hsp genes were used by sequencing their polymerase chain reaction (PCR) products. Gene specific primers (Table S6) were designed using Primer Premier 5.0 and synthesized by Sangon Biotech Co., Ltd (Shanghai, China).
Phylogenetic analysis
The 43 Hsp and 45 P450 conceptually translated sequences from the cotton aphid transcriptome annotation from the Nr database, along with sequences from other insect species (Table S7 and S8), were used to construct three phylogenetic trees based on the amino sequences. The Hsp data set contained 58 Hsps from other species, and the P450 data set contained 49 P450s from A. pisum. Amino acid sequences for each protein family were aligned using ClustalX 1.83 at default settings [52]. The phylogenetic trees were constructed using the maximum parsimony method implemented in MEGA5 [53] at default settings, and 1000 bootstrap replicates.
Analysis of transcript expression differences between the two transcriptomes
The transcript expression abundances were calculated by the FPKM (Fragments Per Kilobase per Million mapped reads) method [54], which can eliminate the influence of different gene lengths and sequencing discrepancy on the calculation of expression abundance [54]. The formula is:
FPKM (A) is the expression of gene A; C the number of reads that uniquely aligned to gene A; N is the total number of fragments that uniquely aligned to all transcripts; and L is the number of bases on gene A.
In our analysis, FDR≤0.001 and the absolute value of the log2 ratio ≥1 were used as thresholds to judge the significance of gene expression differences [55].
Quantitative real time PCR and data analysis
The quantitative real time PCR was performed using the Mastercycler® ep realplex (Eppendorf, Germany). Gene specific primers (Table S9) were designed using Beacon Designer 7.6 and synthesized by Sangon Biotech Co., Ltd (Shanghai, China). Dimethyladenosine transferase [GenBank: KF018923] and peptidyl-prolyl cis-trans isomerase [GenBank: KF018924] were used as endogenous controls. The reaction was performed as follows: 2 min at 95°C, followed by 40 cycles at 95°C for 15 s, 55°C for 30 s, and 72°C for 30 s. A melting curve was used to detect a single gene-specific peak and the absence of primer dimer peaks. GoTaq® qPCR Master Mix (Promega, Madison, WI, USA) was used to measure the mRNA levels according to the manufacturer's instructions. A five-fold dilution series was used to construct a relative standard curve to determine the PCR efficiencies and for quantification analysis. Each reaction was run in triplicate (technical repeat) with three independent biological replicates. Relative quantification of Hsp and P450 genes were calculated by the comparative 2−ΔΔCT method [56] to identify the relative mRNA levels of the samples from different life stages.
Supporting Information
Length distribution of cotton aphid contigs. Length distributions of transcripts in the MorphI are highlighted in red and those of the MorphII in blue. All contig sizes were calculated. Transcript lengths (nt) are given on the X-axis and transcripts numbers on the Y-axis.
(TIFF)
Length distribution of cotton aphid unigenes. (A) Transcript length distributions in the MorphI are highlighted in red and those in the MorphII in blue. (B) Transcript length distributions in the combined transcriptomes. All contig sizes were calculated. Transcript lengths (nt) are given on the X-axis and transcripts numbers on the Y-axis.
(TIFF)
Statistics of annotation results.
(DOCX)
The BLASTX results and digital gene expression profiles of candidate cotton aphid Hsps and P450s. Information includes gene ID in this transcriptome, open reading frame length, gene name, accession number, species, E-value, identity to other proteins, FPKM, and FPKM fold-change.
(XLSX)
The top 100 up-regulated MorphI transcripts, including gene name, FPKM, FDR, E-value, and Nr annotation result.
(XLSX)
The top 100 up-regulated MorphII transcripts, including gene name, FPKM, FDR, E-value, and Nr annotation result.
(XLSX)
Relative mRNA level of 40 Hsp genes in different morphs.
(XLSX)
Primers and transcripts used in the transcriptome assembly validation, including transcript names and primer sequences.
(XLSX)
Hsps used in phylogenetic tree construction.
(DOCX)
A. pisum cytochrome P450s used in phylogenetic tree construction.
(DOCX)
Primers and transcripts used in qRT-PCR validation, including transcript names and primer sequences.
(XLSX)
Nucleic acid sequences of putative Hsps and P450s genes.
(DOCX)
The reaction conditions for first- and second-strand cDNA synthesis, end repair, and adaptor ligation.
(DOCX)
Trinity assemble process.
(DOCX)
Acknowledgments
We thank Na Li and Su-Ping Xu (Institute of Cotton Research, Chinese Academy of Agricultural Sciences) for help with sample collection.
Funding Statement
This work was supported by grants from the Ministry of Agricultural (2011ZX08011-002), the Ministry of Science and Technology (2012BAD19B05), and the National Natural Science Foundation of China (31071978). The funders had no role in study design, data collection and analysis, decision to publish, or preparation of the manuscript.
References
- 1. Fereres A, Moreno A (2009) Behavioural aspects influencing plant virus transmission by homopteran insects. Virus Res 141: 158–168. [DOI] [PubMed] [Google Scholar]
- 2. Slosser JE, Parajulee MN, Hendrix DL, Henneberry TJ, Rummel DR (2002) Relationship between Aphis gossypii (Homoptera: Aphididae) and sticky lint in cotton. J Econ Entomol 95: 299–306. [DOI] [PubMed] [Google Scholar]
- 3. Gu SH, Wu KM, Guo YY, Field LM, Pickett JA, et al. (2013) Identification and Expression Profiling of Odorant Binding Proteins and Chemosensory Proteins between Two Wingless Morphs and a Winged Morph of the Cotton Aphid Aphis gossypii Glover. PLoS One 8: e73524. [DOI] [PMC free article] [PubMed] [Google Scholar]
- 4. Tauber MJ, Tauber CA, Nechols JR, Helgesen RG (1982) A new role for temperature in insect dormancy: cold maintains diapause in temperate zone Diptera. Science 218: 690–691. [DOI] [PubMed] [Google Scholar]
- 5. Kostal V (2006) Eco-physiological phases of insect diapause. J Insect Physiol 52: 113–127. [DOI] [PubMed] [Google Scholar]
- 6.Dingle H (1986) Evolution and Genetics of Insect Migration. In: Danthanarayana W, editor. Insect Flight: Springer Berlin Heidelberg. pp. 11–26. [Google Scholar]
- 7. Richter K, Haslbeck M, Buchner J (2010) The heat shock response: life on the verge of death. Mol Cell 40: 253–266. [DOI] [PubMed] [Google Scholar]
- 8. Parsell DA, Lindquist S (1993) The function of heat-shock proteins in stress tolerance: degradation and reactivation of damaged proteins. Annu Rev Genet 27: 437–496. [DOI] [PubMed] [Google Scholar]
- 9. Feder ME, Hofmann GE (1999) Heat-shock proteins, molecular chaperones, and the stress response: evolutionary and ecological physiology. Annu Rev Physiol 61: 243–282. [DOI] [PubMed] [Google Scholar]
- 10. Feyereisen R (2011) Arthropod CYPomes illustrate the tempo and mode in P450 evolution. Biochim Biophys Acta 1814: 19–28. [DOI] [PubMed] [Google Scholar]
- 11. Wojtasek H, Leal WS (1999) Degradation of an alkaloid pheromone from the pale-brown chafer, Phyllopertha diversa (Coleoptera: Scarabaeidae), by an insect olfactory cytochrome P450. FEBS Lett 458: 333–336. [DOI] [PubMed] [Google Scholar]
- 12. Maïbèche-Coisne M, Merlin C, Francois MC, Queguiner I, Porcheron P, et al. (2004) Putative odorant-degrading esterase cDNA from the moth Mamestra brassicae: cloning and expression patterns in male and female antennae. Chem Senses 29: 381–390. [DOI] [PubMed] [Google Scholar]
- 13. Ai J, Zhu Y, Duan J, Yu Q, Zhang G, et al. (2011) Genome-wide analysis of cytochrome P450 monooxygenase genes in the silkworm, Bombyx mori . Gene 480: 42–50. [DOI] [PubMed] [Google Scholar]
- 14. Feyereisen R (2006) Evolution of insect P450. Biochem Soc Trans 34: 1252–1255. [DOI] [PubMed] [Google Scholar]
- 15. Nauen R, Elbert A (2003) European monitoring of resistance to insecticides in Myzus persicae and Aphis gossypii (Hemiptera: Aphididae) with special reference to imidacloprid. Bull Entomol Res 93: 47–54. [DOI] [PubMed] [Google Scholar]
- 16. Xu Y, Zhou W, Zhou Y, Wu J, Zhou X (2012) Transcriptome and comparative gene expression analysis of Sogatella furcifera (Horvath) in response to southern rice black-streaked dwarf virus. PLoS One 7: e36238. [DOI] [PMC free article] [PubMed] [Google Scholar]
- 17. Wang ZL, Liu TT, Huang ZY, Wu XB, Yan WY, et al. (2012) Transcriptome Analysis of the Asian Honey Bee Apis cerana cerana. PLoS One 7: e47954. [DOI] [PMC free article] [PubMed] [Google Scholar]
- 18. Liu R, He X, Lehane S, Lehane M, Hertz-Fowler C, et al. (2012) Expression of chemosensory proteins in the tsetse fly Glossina morsitans morsitans is related to female host-seeking behaviour. Insect Molecular Biology 21: 41–48. [DOI] [PMC free article] [PubMed] [Google Scholar]
- 19. Ferreiro MJ, Rodriguez-Ezpeleta N, Perez C, Hackenberg M, Aransay AM, et al. (2012) Whole transcriptome analysis of a reversible neurodegenerative process in Drosophila reveals potential neuroprotective genes. BMC Genomics 13: 483. [DOI] [PMC free article] [PubMed] [Google Scholar]
- 20. Doroszuk A, Jonker MJ, Pul N, Breit TM, Zwaan BJ (2012) Transcriptome analysis of a long-lived natural Drosophila variant: a prominent role of stress- and reproduction-genes in lifespan extension. BMC Genomics 13: 167. [DOI] [PMC free article] [PubMed] [Google Scholar]
- 21. Xue J, Bao YY, Li BL, Cheng YB, Peng ZY, et al. (2010) Transcriptome analysis of the brown planthopper Nilaparvata lugens . PLoS One 5: e14233. [DOI] [PMC free article] [PubMed] [Google Scholar]
- 22. Li SW, Yang H, Liu YF, Liao QR, Du J, et al. (2012) Transcriptome and Gene Expression Analysis of the Rice Leaf Folder, Cnaphalocrosis medinalis . PLoS One 7: e47401. [DOI] [PMC free article] [PubMed] [Google Scholar]
- 23. Huang Q, Sun P, Zhou X, Lei C (2012) Characterization of head transcriptome and analysis of gene expression involved in caste differentiation and aggression in Odontotermes formosanus (Shiraki). PLoS One 7: e50383. [DOI] [PMC free article] [PubMed] [Google Scholar]
- 24. Benjamin IJ, McMillan DR (1998) Stress (heat shock) proteins: molecular chaperones in cardiovascular biology and disease. Circ Res 83: 117–132. [DOI] [PubMed] [Google Scholar]
- 25. Hartl FU (1996) Molecular chaperones in cellular protein folding. Nature 381: 571–579. [DOI] [PubMed] [Google Scholar]
- 26. Johnson BJ, Le TT, Dobbin CA, Banovic T, Howard CB, et al. (2005) Heat shock protein 10 inhibits lipopolysaccharide-induced inflammatory mediator production. J Biol Chem 280: 4037–4047. [DOI] [PubMed] [Google Scholar]
- 27. Cappello F, David S, Rappa F, Bucchieri F, Marasa L, et al. (2005) The expression of HSP60 and HSP10 in large bowel carcinomas with lymph node metastase. BMC Cancer 5: 139. [DOI] [PMC free article] [PubMed] [Google Scholar]
- 28. Walsh A, Whelan D, Bielanowicz A, Skinner B, Aitken RJ, et al. (2008) Identification of the molecular chaperone, heat shock protein 1 (chaperonin 10), in the reproductive tract and in capacitating spermatozoa in the male mouse. Biol Reprod 78: 983–993. [DOI] [PubMed] [Google Scholar]
- 29. Shamaei-Tousi A, D'Aiuto F, Nibali L, Steptoe A, Coates AR, et al. (2007) Differential regulation of circulating levels of molecular chaperones in patients undergoing treatment for periodontal disease. PLoS One 2: e1198. [DOI] [PMC free article] [PubMed] [Google Scholar]
- 30. Sadacharan SK, Cavanagh AC, Gupta RS (2001) Immunoelectron microscopy provides evidence for the presence of mitochondrial heat shock 10-kDa protein (chaperonin 10) in red blood cells and a variety of secretory granules. Histochem Cell Biol 116: 507–517. [DOI] [PubMed] [Google Scholar]
- 31. Horwich AL, Fenton WA, Chapman E, Farr GW (2007) Two families of chaperonin: physiology and mechanism. Annu Rev Cell Dev Biol 23: 115–145. [DOI] [PubMed] [Google Scholar]
- 32. Yebenes H, Mesa P, Munoz IG, Montoya G, Valpuesta JM (2011) Chaperonins: two rings for folding. Trends Biochem Sci 36: 424–432. [DOI] [PubMed] [Google Scholar]
- 33. Jia H, Halilou AI, Hu L, Cai W, Liu J, et al. (2011) Heat shock protein 10 (Hsp10) in immune-related diseases: one coin, two sides. Int J Biochem Mol Biol 2: 47–57. [PMC free article] [PubMed] [Google Scholar]
- 34. Nakamoto H, Vigh L (2007) The small heat shock proteins and their clients. Cell Mol Life Sci 64: 294–306. [DOI] [PMC free article] [PubMed] [Google Scholar]
- 35. Frydenberg J, Hoffmann AA, Loeschcke V (2003) DNA sequence variation and latitudinal associations in hsp23, hsp26 and hsp27 from natural populations of Drosophila melanogaster . Mol Ecol 12: 2025–2032. [DOI] [PubMed] [Google Scholar]
- 36. Graham AM, Merrill JD, McGaugh SE, Noor MA (2012) Geographic selection in the small heat shock gene complex differentiating populations of Drosophila pseudoobscura . J Hered 103: 400–407. [DOI] [PMC free article] [PubMed] [Google Scholar]
- 37. Li ZW, Li X, Yu QY, Xiang ZH, Kishino H, et al. (2009) The small heat shock protein (sHSP) genes in the silkworm, Bombyx mori, and comparative analysis with other insect sHSP genes. BMC Evol Biol 9: 215. [DOI] [PMC free article] [PubMed] [Google Scholar]
- 38. Szyperski T, Pellecchia M, Wall D, Georgopoulos C, Wuthrich K (1994) NMR structure determination of the Escherichia coli DnaJ molecular chaperone: secondary structure and backbone fold of the N-terminal region (residues 2-108) containing the highly conserved J domain. Proc Natl Acad Sci U S A 91: 11343–11347. [DOI] [PMC free article] [PubMed] [Google Scholar]
- 39. Corsi AK, Schekman R (1997) The lumenal domain of Sec63p stimulates the ATPase activity of BiP and mediates BiP recruitment to the translocon in Saccharomyces cerevisiae . J Cell Biol 137: 1483–1493. [DOI] [PMC free article] [PubMed] [Google Scholar]
- 40. Gupta RS, Singh B (1994) Phylogenetic analysis of 70 kD heat shock protein sequences suggests a chimeric origin for the eukaryotic cell nucleus. Curr Biol 4: 1104–1114. [DOI] [PubMed] [Google Scholar]
- 41. Mayer MP, Bukau B (2005) Hsp70 chaperones: cellular functions and molecular mechanism. Cell Mol Life Sci 62: 670–684. [DOI] [PMC free article] [PubMed] [Google Scholar]
- 42. Benoit JB, Lopez-Martinez G, Phillips ZP, Patrick KR, Denlinger DL (2010) Heat shock proteins contribute to mosquito dehydration tolerance. J Insect Physiol 56: 151–156. [DOI] [PMC free article] [PubMed] [Google Scholar]
- 43. Sang W, Ma WH, Qiu L, Zhu ZH, Lei CL (2012) The involvement of heat shock protein and cytochrome P450 genes in response to UV-A exposure in the beetle Tribolium castaneum . J Insect Physiol 58: 830–836. [DOI] [PubMed] [Google Scholar]
- 44. Welch WJ, Feramisco JR (1982) Purification of the major mammalian heat shock proteins. J Biol Chem 257: 14949–14959. [PubMed] [Google Scholar]
- 45. Picard D (2002) Heat-shock protein 90, a chaperone for folding and regulation. Cell Mol Life Sci 59: 1640–1648. [DOI] [PMC free article] [PubMed] [Google Scholar]
- 46. Nguyen TT, Michaud D, Cloutier C (2009) A proteomic analysis of the aphid Macrosiphum euphorbiae under heat and radiation stress. Insect Biochem Mol Biol 39: 20–30. [DOI] [PubMed] [Google Scholar]
- 47. Zhang GJ, Guo GW, Hu XD, Zhang Y, Li QY, et al. (2010) Deep RNA sequencing at single base-pair resolution reveals high complexity of the rice transcriptome. Genome Research 20: 646–654. [DOI] [PMC free article] [PubMed] [Google Scholar]
- 48. Grabherr MG, Haas BJ, Yassour M, Levin JZ, Thompson DA, et al. (2011) Full-length transcriptome assembly from RNA-Seq data without a reference genome. Nature Biotechnology 29: 644–U130. [DOI] [PMC free article] [PubMed] [Google Scholar]
- 49. Kanehisa M, Araki M, Goto S, Hattori M, Hirakawa M, et al. (2008) KEGG for linking genomes to life and the environment. Nucleic Acids Res 36: D480–484. [DOI] [PMC free article] [PubMed] [Google Scholar]
- 50. Conesa A, Gotz S, Garcia-Gomez JM, Terol J, Talon M, et al. (2005) Blast2GO: a universal tool for annotation, visualization and analysis in functional genomics research. Bioinformatics 21: 3674–3676. [DOI] [PubMed] [Google Scholar]
- 51. Ye J, Fang L, Zheng H, Zhang Y, Chen J, et al. (2006) WEGO: a web tool for plotting GO annotations. Nucleic Acids Res 34: W293–297. [DOI] [PMC free article] [PubMed] [Google Scholar]
- 52. Thompson JD, Gibson TJ, Plewniak F, Jeanmougin F, Higgins DG (1997) The CLUSTAL_X windows interface: flexible strategies for multiple sequence alignment aided by quality analysis tools. Nucleic Acids Res 25: 4876–4882. [DOI] [PMC free article] [PubMed] [Google Scholar]
- 53. Tamura K, Peterson D, Peterson N, Stecher G, Nei M, et al. (2011) MEGA5: molecular evolutionary genetics analysis using maximum likelihood, evolutionary distance, and maximum parsimony methods. Mol Biol Evol 28: 2731–2739. [DOI] [PMC free article] [PubMed] [Google Scholar]
- 54. Mortazavi A, Williams BA, McCue K, Schaeffer L, Wold B (2008) Mapping and quantifying mammalian transcriptomes by RNA-Seq. Nat Methods 5: 621–628. [DOI] [PubMed] [Google Scholar]
- 55. Benjamini Y, Drai D, Elmer G, Kafkafi N, Golani I (2001) Controlling the false discovery rate in behavior genetics research. Behav Brain Res 125: 279–284. [DOI] [PubMed] [Google Scholar]
- 56. Pfaffl MW (2001) A new mathematical model for relative quantification in real-time RT-PCR. Nucleic Acids Research 29: e45. [DOI] [PMC free article] [PubMed] [Google Scholar]
Associated Data
This section collects any data citations, data availability statements, or supplementary materials included in this article.
Supplementary Materials
Length distribution of cotton aphid contigs. Length distributions of transcripts in the MorphI are highlighted in red and those of the MorphII in blue. All contig sizes were calculated. Transcript lengths (nt) are given on the X-axis and transcripts numbers on the Y-axis.
(TIFF)
Length distribution of cotton aphid unigenes. (A) Transcript length distributions in the MorphI are highlighted in red and those in the MorphII in blue. (B) Transcript length distributions in the combined transcriptomes. All contig sizes were calculated. Transcript lengths (nt) are given on the X-axis and transcripts numbers on the Y-axis.
(TIFF)
Statistics of annotation results.
(DOCX)
The BLASTX results and digital gene expression profiles of candidate cotton aphid Hsps and P450s. Information includes gene ID in this transcriptome, open reading frame length, gene name, accession number, species, E-value, identity to other proteins, FPKM, and FPKM fold-change.
(XLSX)
The top 100 up-regulated MorphI transcripts, including gene name, FPKM, FDR, E-value, and Nr annotation result.
(XLSX)
The top 100 up-regulated MorphII transcripts, including gene name, FPKM, FDR, E-value, and Nr annotation result.
(XLSX)
Relative mRNA level of 40 Hsp genes in different morphs.
(XLSX)
Primers and transcripts used in the transcriptome assembly validation, including transcript names and primer sequences.
(XLSX)
Hsps used in phylogenetic tree construction.
(DOCX)
A. pisum cytochrome P450s used in phylogenetic tree construction.
(DOCX)
Primers and transcripts used in qRT-PCR validation, including transcript names and primer sequences.
(XLSX)
Nucleic acid sequences of putative Hsps and P450s genes.
(DOCX)
The reaction conditions for first- and second-strand cDNA synthesis, end repair, and adaptor ligation.
(DOCX)
Trinity assemble process.
(DOCX)