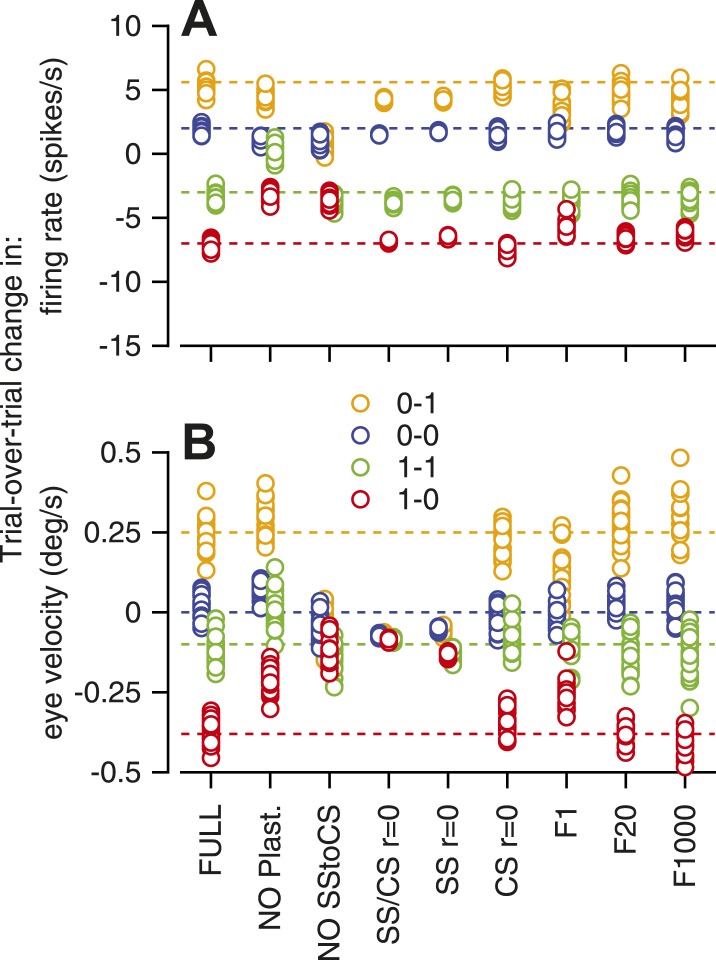
Figure 6. Sensitivity of the computer model to removal of different features.
Different symbols show the amplitude predicted by the 20 runs of a given architecture of the model; different colors indicate different combinations of CS responses in successive instruction and test trials. Abbreviations for different architectures are: FULL, full model; NO plast, no trial-over-trial plasticity; NO SStoCS, no connection from DCN to IO; SS/CS r = 0; no neuron–neuron correlations in simple-spike or CS responses; SS r = 0; no neuron–neuron correlations in simple-spike responses; CS r = 0, no neuron–neuron correlations in CS responses; F1, F20, F1000, IO neurons receive inputs from 1, 20, or 1000 model Purkinje cells.

