

Abstract
Background
Participation and performance trends have been investigated in ultramarathons and ultratriathlons but not in ultracycling. The aim of the present study was to investigate (1) participation and performance trends in ultraendurance cyclists, (2) changes in cycling speed over the years, and (3) the age of the fastest male and female ultraendurance cyclists.
Methods
Participation and performance trends in the 5000 km Race Across America (RAAM) and in two RAAM-qualifier races – the 818 km Furnace Creek 508 in the United States and the 715 km Swiss Cycling Marathon in Europe – were investigated using linear regression analyses and analyses of variance.
Results
On average, ~41% of participants did not finish either the RAAM or the Furnace Creek 508, whereas ~26% did not finish the Swiss Cycling Marathon. Female finishers accounted for ~11% in both the RAAM and the Furnace Creek 508 but only ~3% in the Swiss Cycling Marathon. The mean cycling speed of all finishers remained unchanged during the studied periods. The winner’s average speed was faster for men than for women in the RAAM (22.6 ± 1.1 km · h−1 versus 18.4 ± 1.7 km · h−1, respectively; average speed difference between male and female winners, 25.0% ± 11.9%), the Swiss Cycling Marathon (30.8 ± 0.8 km · h−1 versus 24.4 ± 1.9 km · h−1, respectively; average speed difference between male and female winners, 27.8% ± 9.4%), and the Furnace Creek 508 (27.4 ± 1.6 km · h−1 versus 23.4 ± 3.0 km · h−1, respectively; average speed difference between male and female winners, 18.4% ± 13.9%). In both the Furnace Creek 508 and the Swiss Cycling Marathon, ~46% of the finishers were aged between 35 and 49 years. The mean age of winners, both male and female, across the years in the Furnace Creek 508 and in the Swiss Cycling Marathon was 37 ± 10 years.
Conclusion
These findings in ultracycling races showed that (1) ~26%–40% of starters were unable to finish, (2) the percentage of female finishers was ~3%–11%, (3) the gender difference in performance was ~18%–28%, and (4) ~46% of the successful finishers were master athletes. Future studies need to investigate the reasons for the low female participation and focus on the age-related performance decline in other ultraendurance events in order to confirm that master athletes are predisposed to ultraendurance performances.
Keywords: ultraendurance, finisher, speed, gender difference, master athlete, cycling
Introduction
In recent years there have been several studies that have investigated participation and performance trends in ultraendurance events,1–6 with an ultraendurance event defined as a sport activity lasting more than 6 hours.7 These various studies have investigated ultramarathoners in 100 and 161 km ultramarathons,1–3,5,8 Ironman triathletes,6,9 and ultratriathletes competing in distances longer than an Ironman triathlon.4,10–12 Regarding both the participation and the ratio between starters and finishers in ultraendurance events, nonfinishers were found to account for ~40% in 161 km ultramarathons.1 For 161 km ultramarathoners, an exponential increase in the number of finishers was reported.1 This increase was due to an increase in the participation of athletes over 40 years of age,8 an increased percentage of female finishers, and an increased mean number of finishes by single participants, as one athlete participated annually in several ultraendurance races.1–3 There seemed to be differences between finishers and nonfinishers regarding race preparation10 and prerace body composition.12–14 Successful finishers in ultraendurance races were found to have invested more time in training10,13,14 and to have had a lower percentage of body fat13 than nonfinishers.
Regarding the relative participation of each sex, results of the aforementioned studies showed that ~20% of all participants in 161 km ultramarathons were women,1–3 while the percentage of women in ultratriathlons was found to be lower, at ~10%.4 The age of peak ultraendurance performance has been investigated in ultrarunners15 and ultratriathletes.16,17 Generally, results showed that these ultraendurance athletes were master athletes older than 35 years.18 In 161 km ultra-marathons, ~65%–70% of the finishers were found to be 40 years old and over, and the mean age of the participants was 43–45 years.2,3 The fastest race times in 161 km ultramarathons were achieved at the age of 40–49 years for women and 30–39 years for men.1–3 In 100 km ultramarathoners, women could achieve a high level of performance up to the age of 54 years.5 In both Ironman triathletes16 and triathletes competing in a Triple Iron ultratriathlon and a Deca Iron ultratriathlon,17 the age of peak performance was at ~35 years.
Not only participation increased in master athletes, but also the best performances have been achieved by master athletes in ultraendurance races where master athletes are defined as athletes aged > 35 years.9,15,17,18 It appears that the age of peak performance is higher for ultraendurance events15–17 than for shorter events such as 42 km marathons, where peak performance was still achieved at ~25–35 years19–21 – this is still older than the age of peak performance found in other sports disciplines such as baseball (28 years), tennis (24 years), and golf (31 years).20 However, master marathoners have been found to improve their running times at a faster rate than younger athletes,22 and it is hypothesized that both male and female master marathoners have probably not yet reached their performance limits.23
There have been several studies that have investigated the performance trends in ultraendurance races.1,4,6 Knechtle et al4 compared female and male performances in a Deca Iron ultratriathlon, where athletes performed a 3.8 km swim, 180 km cycle, and a 42.2 km run ten times. Men were ~19% faster than women in the cycle split, and ~30% faster for the total Deca Iron ultratriathlon. Lepers6 reported no significant improvements in performance in the Ironman Hawaii, apart from an initial increase in speed in the early 1980s. This enhancement of performance was probably due to important technological improvements in bicycles that occurred at that time.24
While participation and performance trends were investigated in ultramarathoners and ultratriathletes, participation and performance trends in ultraendurance cycling remain unclear, although this discipline is well identified.25 Until now, no study has investigated participation and performance trends in ultraendurance cycle races. It has been reported that between 2008 and 2010, ~49% of the participants in the 715 km Swiss Cycling Marathon did not finish the race.13 However, the premier ultraendurance cycle race is the 5000 km Race Across America (RAAM).26
The aim of the present study was to investigate (1) participation and performance trends in ultraendurance cyclists, (2) changes in cycling speed over the years, and (3) the age of the fastest male and female ultraendurance cyclists. Based upon existing literature on ultrarunning and ultratriathlon, the authors hypothesized (1) an increase in female participation, (2) a gender difference in performance of ~20%–30%, and (3) an age of peak ultracycling performance of ~35 years. To test these hypotheses, the authors investigated participation and performance trends in two RAAM-qualifier races and in the RAAM itself. Because the age of the participants was not available in the results of the RAAM, the authors considered the two ultracycling qualifying races, the Furnace Creek 508 and the Swiss Cycling Marathon, in order to investigate the age-related decline in performance.
Materials and methods
The Institutional Review Board of St Gallen, Switzerland, approved this study with a waiver for the requirement of an informed consent, given that the study involved the analysis of publicly available data. The cycling performances and the ages of both male and female finishers in three different ultraendurance cycle races were chosen and analyzed.
Races and data sampling
The data sets for this study were obtained from the individual race websites and from the race directors. The authors investigated the RAAM data available from 1982 to 2011.26 The RAAM spans a distance of ~5000 km and has a total elevation of ~30,500 m. It is the longest, and considered the hardest, cycling endurance event in the world, starting at the Pacific coast and ending at the Atlantic coast in the United States. Solo riders have to complete the race within 12 days, so a mean speed of 17 km · h−1 is demanded, including noncycling times. Winning solo riders have completed the race in 8 days and a few hours, corresponding to a mean speed of ~25 km · h−1. To participate in the RAAM as a solo rider, ultraendurance athletes have to pass the requirements of qualifying races. The authors considered two of these qualifying races in order to obtain data about ages that were not available for the RAAM. The authors investigated the Furnace Creek 508 data available from 1989 to 2011 – the Furnace Creek 508 is a US RAAM-qualifier race that is 818 km long, with an elevation gain of over ~11,000 m.27 The authors also analyzed the Swiss Cycling Marathon data available from 2001 to 2011 – the Swiss Cycling Marathon is the oldest and largest RAAM-qualifier race in Europe, where the participants have to cover a distance of 715 km with an overall elevation gain of ~5580 m.28
Age of the participants and their cycling performances
The changes over time in the ages of all participants, together with the average cycling speed in kilometers per hour for the male and female winners and all male finishers, were analyzed for both the Furnace Creek 508 (data from 1989 to 2011) and the Swiss Cycling Marathon (data from 2001 to 2011). Because the age of the participants was not available for the RAAM, the authors only considered the average cycling speed of the male and female winners and all male finishers of the RAAM (data from 1982 to 2011). Because of the small percentage of female finishers in the three races, less than 11% of the total finishers over the studied periods (Figure 1), the authors focused on male finishers only. The magnitudes of the gender difference were examined by calculating, as a percentage, the difference in cycling speed between male and female winners.
Figure 1.
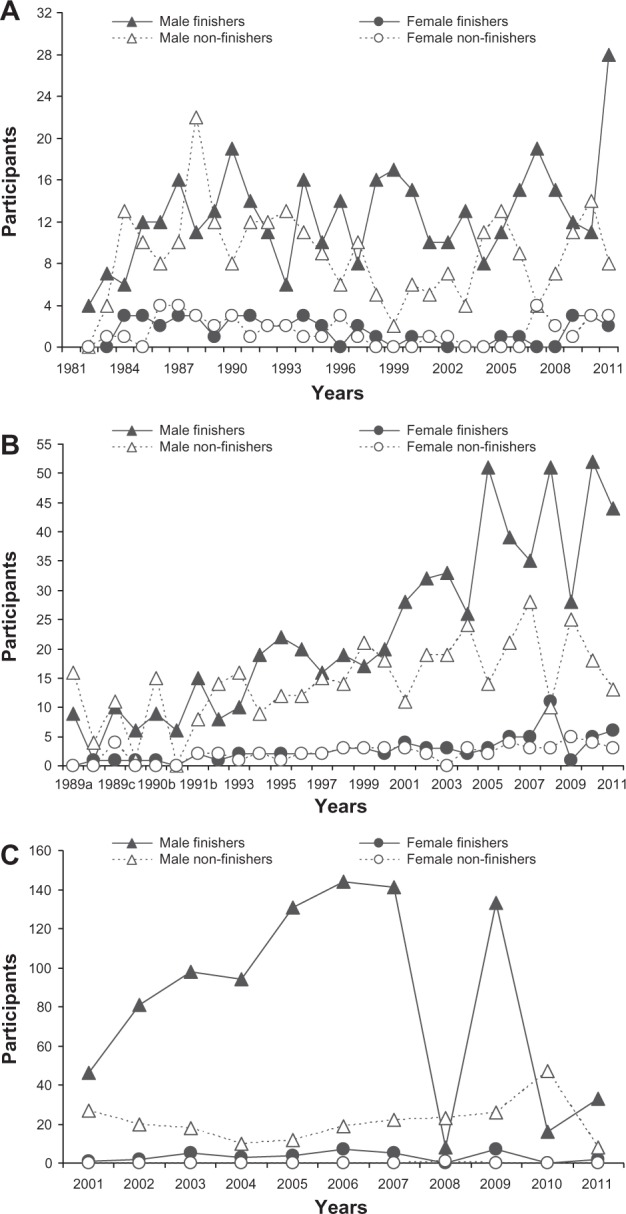
Number of male and female finishers and nonfinishers in three different ultraendurance cycle races, from the first year of the event through to 2011: (A) the Race Across America (United States), (B) the Furnace Creek 508 (United States), and (C) the Swiss Cycling Marathon (Switzerland).
Note: (B) From 1989 to 1991 there was more than one race per year.
Age-related changes in performance
In order to analyze the age-related change in ultracycling performances, the authors pooled the data of the male finishers of the Furnace Creek 508 from 1989 to 2011 and the male finishers of the Swiss Cycling Marathon from 2001 to 2011. The authors identified the following age groups: 18–24, 25–29, 30–34, 35–39, 40–44, 45–49, 50–54, 55–59, and ≥60 years. In order to limit the influence of environmental conditions over the years, the cycling performances were expressed as a percentage of the winner’s speed in each year. Finally, the authors considered the performances of the best ten male cyclists per age group over time.
Statistical analysis
Data are reported as the mean plus or minus the standard deviation. Linear regressions were used for estimating the changes in the selected variables for each year of the races. Pearson’s correlation coefficients were used to assess the association between various variables (Statistica, v 6.1; Stat-Soft, Inc, Tulsa, OK, USA). An unpaired Student’s t-test was used to compare the ages of the female and the male winners. One-way analysis of variance was used to compare the cycling performances of the different age groups for male cyclists. Tukey’s post hoc analyses were used to test differences within the one-way analysis of variance when appropriate. Statistical significance was accepted at P < 0.05.
Results
Participation trends
The annual number of male and female finishers and non-finishers over time are shown in Figure 1. From 1982 to 2011 there were 424 finishers (45 women and 379 men) and 310 nonfinishers (44 women and 266 men) in the RAAM (Figure 1A). Nonfinishers represented, on average, 41% ± 15% of the total starters, and women accounted, on average, for 11% ± 9% of the total finishers over the 29-year period. From 1989 to 2011 there were 703 finishers (77 women and 626 men) and 445 nonfinishers (57 women and 388 men) in the Furnace Creek 508 (Figure 1B). Nonfinishers represented, on average, 41% ± 15% of the total starters, and women accounted, on average, for 11% ± 9% of the total finishers over the 22-year period. The percentage of male finishers in each age group over the studied period was 1.6%, 4.5%, 8.9%, 17.4%, 24.6%, 20.9%, 13.3%, 5.7%, and 3.0% for the age groups 18–24, 25–29, 30–34, 35–39, 40–44, 45–49, 50–54, 55–59, and ≥60 years, respectively. From 2001 to 2011 there were 961 finishers (36 women and 925 men) and 233 nonfinishers (one woman and 232 men) in the Swiss Cycling Marathon (Figure 1C). Nonfinishers represented, on average, 26% ± 20% of the total starters, and women accounted, on average, for 3% ± 2% of the total finishers over the 10-year period. The percentage of male finishers in each age group was 1.9%, 6.6%, 13.1%, 18.2%, 19.0%, 18.8%, 12.7%, 4.8%, and 4.9% for the age groups 18–24, 25–29, 30–34, 35–39, 40–44, 45–49, 50–54, 55–59, and ≥60 years, respectively.
Performance trends for winners
Figure 2 shows the historical performance trends of the male and female winners for the three ultraendurance cycling races. In the RAAM, the mean winner’s cycling speed was 22.6 ± 1.1 km · h−1 for men and 18.4 ± 1.7 km · h−1 for women (Figure 2A), and this did not change over time for either sex. The average speed difference between the male and female winners was equal to 25.0% ± 11.9%. In the Furnace Creek 508, the mean winner’s cycling speed was 27.4 ± 1.6 km · h−1 for men and 23.4 ± 3.0 km · h−1 for women (Figure 2B). The gradient of the regression line demonstrates that male cycling speed increased significantly by 0.14 km · h−1 per year from 1989 to 2011. In contrast, the female winner’s speed did not significantly change over the years. The average speed difference between the male and female winners was equal to 18.4% ± 13.9%. In the Swiss Cycling Marathon, the mean winner’s cycling speed was 30.8 ± 0.8 km · h−1 for men and 24.4 ± 1.9 km · h−1 for women (Figure 2C). The gradient of the regression line demonstrates that female cycling speed increased significantly by 0.48 km · h−1 per year from 2001 to 2011. In contrast, the male winner’s speed did not significantly change over the years. The average speed difference between the male and female winners was equal to 27.8% ± 9.4%.
Figure 2.
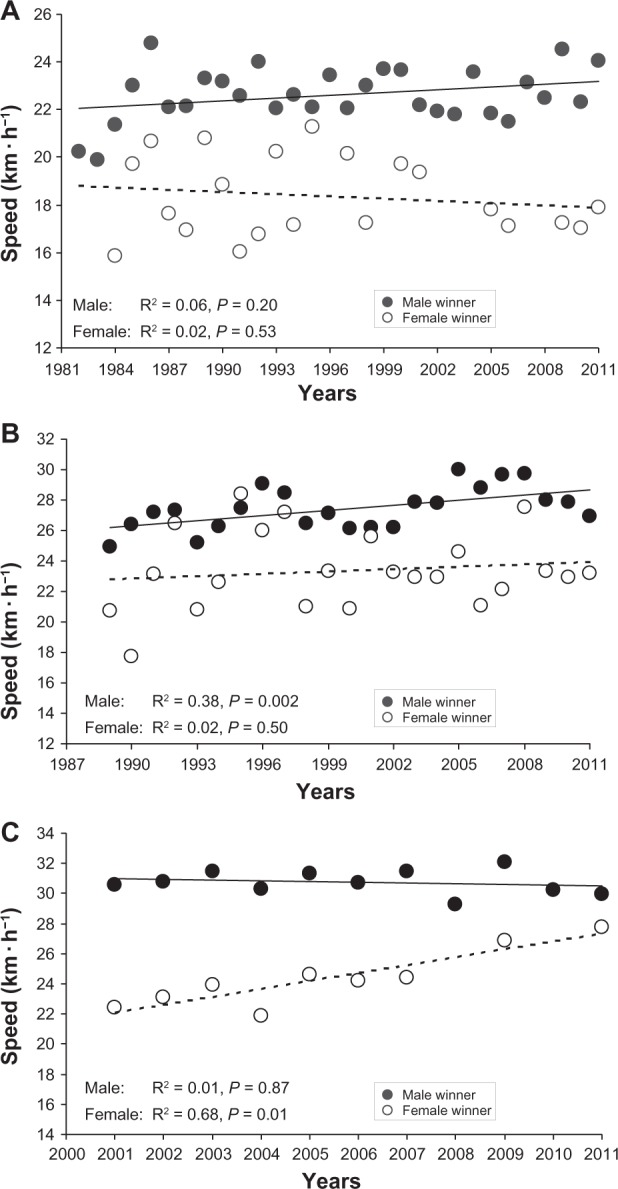
Mean speed of male and female winners in three different ultraendurance cycle races, from the first year of the event through to 2011: (A) the Race Across America (United States), (B) the Furnace Creek 508 (United States), and (C) the Swiss Cycling Marathon (Switzerland).
Note: The solid line represents the linear regressions for men and the dotted line represents the linear regressions for women.
Performance trends for finishers
Figure 3 shows the historical performance trends of the male finishers in the three ultra-endurance cycle races. In the RAAM, the mean finishers’ cycling speed was 19.4 ± 0.7 km · h−1 (Figure 3A), and the speed did not significantly change over the years. In the Furnace Creek 508, the mean finishers’ cycling speed was 21.8 ± 0.9 km · h−1 (Figure 3B) and did not significantly change over the years. In the Swiss Cycling Marathon, the mean finishers’ cycling speed was 22.2 ± 1.6 km · h−1 (Figure 3C); the gradient of the regression line demonstrates that the finishers’ cycling speed increased significantly, by 0.32 km · h−1 per year, from 2001 to 2011.
Figure 3.
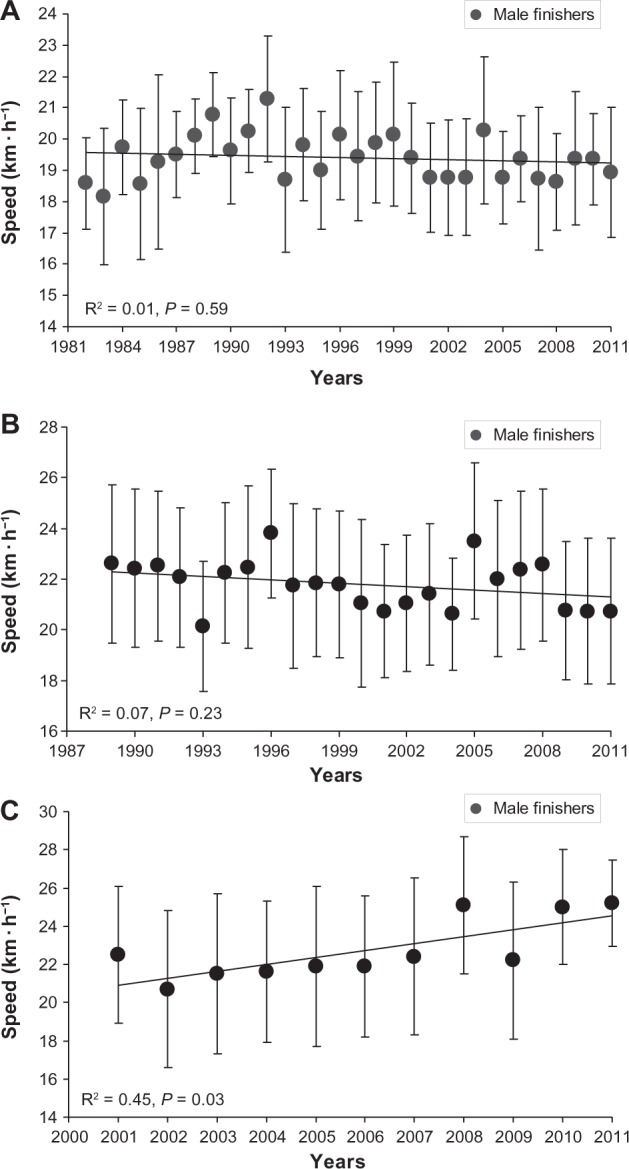
Mean speed of all male finishers in three different ultraendurance cycle races, from the first year of the event through to 2011: (A) the Race Across America (United States), (B) the Furnace Creek 508 (United States), and (C) the Swiss Cycling Marathon (Switzerland).
Age of winners
Figure 4 shows the historical age trends of the male and female winners in the Furnace Creek 508 and the Swiss Cycling Marathon. In the Furnace Creek 508, the mean age of winners was the same for men (36 ± 7 years) and women (37 ± 7 years) over time (Figure 4A). The winner’s age did not significantly change over the years for men, but the gradient of the regression line demonstrates that the female winner’s age increased significantly, by 0.6 years per year, from 1989 to 2011. In the Swiss Cycling Marathon there was no difference in the mean age of winners between men (38 ± 4 years) and women (36 ± 9 years) during the studied period (Figure 4B), and this did not change significantly over the years for either sex.
Figure 4.
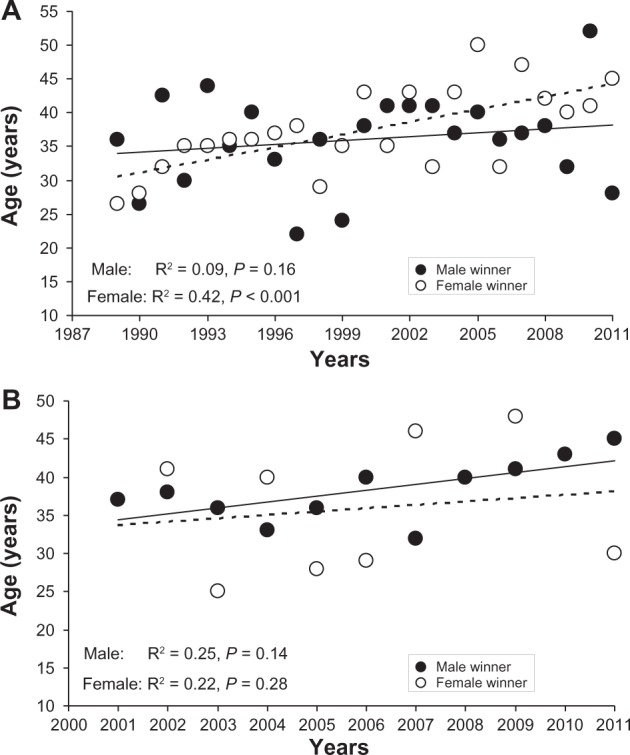
Ages of male and female winners in two different ultraendurance cycle races, from the first year of the event through to 2011: (A) the Furnace Creek 508 (United States) and (B) the Swiss Cycling Marathon (Switzerland).
Note: The solid line represents the linear regressions for men and the dotted line represents the linear regressions for women.
Age of finishers
Figure 5 shows the historical age trends of the male finishers in the Furnace Creek 508 and the Swiss Cycling Marathon. In the Furnace Creek 508, the mean age of finishers was 41 ± 4 years during the studied period (Figure 5A). The gradient of the regression line demonstrates that the age of male finishers increased significantly, by 0.47 years per year, from 1989 to 2011. In the Swiss Cycling Marathon, the mean age of finishers was 43 ± 1 year during the studied period (Figure 5B), and this did not change significantly over the years.
Figure 5.
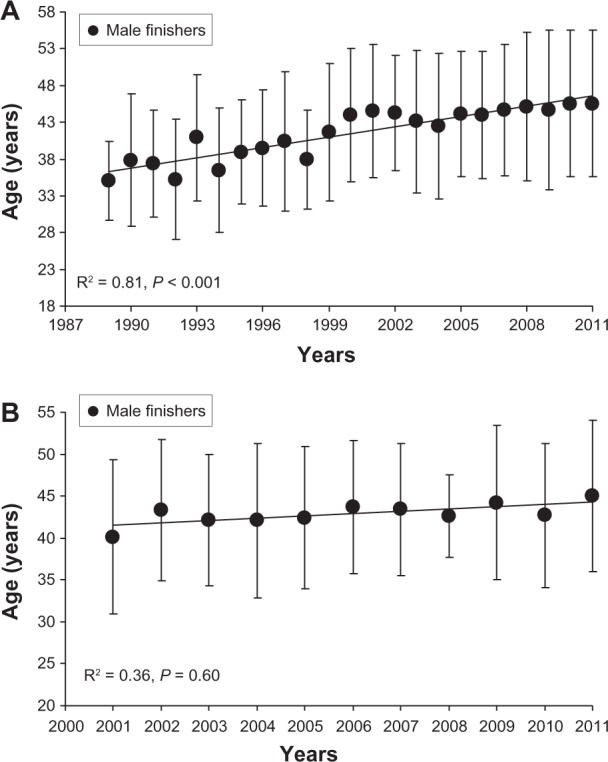
Ages of all male finishers in two different ultraendurance cycle races, from the first year of the event through to 2011: (A) the Furnace Creek 508 (United States) and (B) the Swiss Cycling Marathon (Switzerland).
Age-related changes in performances
The mean age-related changes in male cycling speed in the Furnace Creek 508 and the Swiss Cycling Marathon are shown in Figure 6. The cycling speed increased in a curvilinear manner with advancing age. There was a significant age effect in cycling performance (Furnace Creek 508, F = 24.6, P < 0.001; Swiss Cycling Marathon, F = 31.2, P < 0.001). For both races, no significant difference in cycling performance was observed in the five age groups between the 25- and 49-year marks, but cycling speed was significantly (P < 0.01) slower in the 18- to 24-year age group and the age groups over the 50-year mark than in the age groups between the 25- and 49-year marks.
Figure 6.
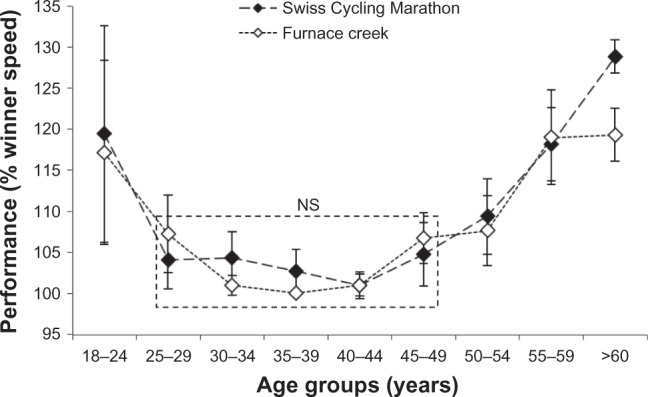
Age-related changes in male cycling performance expressed as a percentage of the winner’s speed (% winner speed) in two ultraendurance cycle races: the Swiss Cycling Marathon (Switzerland) and the Furnace Creek 508 (United States).
Notes: Data were pooled from the first year of each event through to 2011. In both races the cycling speed was significantly (P < 0.01) slower for athletes in the 18- to 24-year age group and those over 50 years of age than for those athletes between 25 and 49 years of age.
Abbreviation: NS, nonsignificant.
Discussion
The present study investigated participation and performance trends in ultraendurance cycling races, the changes in cycling speed over time, and the age of the fastest male and female ultraendurance cyclists. The authors hypothesized that female participation would increase, the gender difference in ultracycling performance would be at ~20%–30%, and the age of peak ultracycling performance would be at ~35 years.
Participation trends
An interesting finding was that ~41% of the starters did not finish the RAAM. The same percentage did not finish the Furnace Creek 508, while ~26% did not finish the Swiss Cycling Marathon. In the RAAM, covering a distance of ~5000 km, the percentage of nonfinishers remained the same as in the Furnace Creek 508, which is 818 km long. The percentage of nonfinishers in the RAAM might be relatively low when looking at its distance, because the athletes have to qualify for the RAAM, as opposed to the Furnace Creek 508 or the Swiss Cycling Marathon, and so athletes participating in the RAAM might be better prepared because of successful completion of previous races.10–14,29 Further explanations in favor of the relatively low percentage of nonfinishers in the RAAM could be more cycling training hours,10–13,30 a higher cycling speed in training,13,30 or a more adequate nutrition13 than those racing in the Furnace Creek 508, so, consequently, the percentage of nonfinishers did not increase with the longer distance in the RAAM as the authors hypothesized.
A further important finding was the low overall number of women in all the investigated ultracycling races. In the RAAM, women accounted, on average, for ~11% of participants, the same as in the Furnace Creek 508. In the Swiss Cycling Marathon, the percentage of women was very low, at ~3%. The percentage of female participants was higher, at ~27%, than for other ultraendurance races such as the Iron-man Hawaii.6,9 In races longer than the marathon distance, the percentage of female participation decreased as the race distance increased. In 161 km ultramarathons ~20% of participants were women,1–3 and in ultratriathlons no more than 10% of women participated.4 The low number of female finishers might be explained by differences in motivation between female and male ultraendurance athletes. Physically active men seemed to have a different motivation to compete in races than women. Krouse et al31 described female ultrarunners as task-oriented, internally motivated, health conscious, and financially conscious individuals. Male endurance athletes seem to rather prefer sports requiring skills needed for success in male-to-male physical competition,32 and men seem to have a greater training motivation than women.33,34
Performance trends
An important finding in the present study was that the difference in the mean cycling speed of the male and female winners was ~24%. It has been speculated that the difference between female and male performances could disappear over longer distances.35 A potential reason why men were faster than women might be their greater muscle mass and their greater aerobic capacity.36,37 Hoffman1 observed, in 161 km ultramarathons, that the relative improvement in performance was greater in women than in men in the early 1980s. Hoffman8 also showed that by matching women and men in performances at 42.2 or 56 km and comparing them later at 80 and 161 km distances, the female performance was not relatively better. Coast et al38 noticed that the mean male performance in a 200 km ultrarun was better than the mean female performance, and Hoffman1 confirmed the same result in 161 km ultramarathons. Knechtle et al4 demonstrated – in a Double Iron ultratriathlon, a Triple Iron ultratriathlon, and a Deca Iron ultratriathlon, where athletes have to compete twice, three times, or ten times the Ironman distance (a 3.8 km swim, a 180 km cycle, and a 42.2 km run) – that the gender difference increased with increasing race distance. In the cycling split in a Double Iron ultratriathlon, a Triple Iron ultratriathlon, and a Deca Iron ultratriathlon, the gender difference was ~21%, which was closer to the present findings.4 However, these studies could not confirm the assumption that the gender difference in performance would disappear with longer distances.35
The average speed in ultraendurance cycling showed no change over the years for either winners or finishers. The winner’s speed increased in the Furnace Creek 508 for men by 0.14 km · h−1 per year and in the Swiss Cycling Marathon for women by 0.48 km · h−1 per year. The speeds of male finishers in the Swiss Cycling Marathon changed by 0.32 km · h−1 per year. In the RAAM, only an initial increase in performance in the early 1980s was obvious. A previous study showed that even an increase in participation in 161 km ultramarathons was not associated with a growth in competition and performance – the limited financial incentive was assumed to be the reason.1 An initial increase in speed was also reported in Ironman Hawaii in the early 1980s,6 at the same time as important technological improvements in bicycles were made.24 These technological improvements concerned the factor of aerodynamics, so the mean velocity increased because the primary force inhibiting forward motion is air resistance.24
Age trends
Interestingly, 72.9% of the male finishers in the Furnace Creek 508 and 56% in the Swiss Cycling Marathon were master athletes in the age groups between 35 and 49 years. In the Furnace Creek 508, the mean age of male finishers increased significantly, by 10 years since 1989, or 0.47 years per year. The reason why master athletes up to the age of 49 years participate and successfully finish in such numbers in ultracycling events could be optimal conditions in physiology, biomechanics, psychology, tactics and health/lifestyle,7 more training hours than other participants,10,12 and an increased prerace experience.10–13,29 The aforementioned studies have already highlighted that participants may successfully finish ultraendurance events when they fulfill these aspects. In 161 km ultramarathons a large increase in the number of finishers was due to an increased participation of master athletes over 40 years of age.1–3 Half of the runners were aged between 37 and 49 years, corresponding to an increase of 10 years in mean age since the late 1970s. Actually, the mean age in peak running speed is at around 43–45 years.1–3 Master athletes might be predisposed to successfully finish an ultraendurance event.
Based upon previous studies describing the age of peak performance in both 161 and 100 km ultramarathoners, the authors hypothesized an age of peak ultracycling performance of ~35 years.18 In both the Furnace Creek 508 and the Swiss Cycling Marathon, the athletes achieved their peak ultracycling performance at the age of ~37 years. The cycling speed was fastest in the age groups between the 25-and 49-year marks. No significant difference was observed within these age groups, although most finishers were in the age groups between the 35- and 49-year marks. The decrease in performance after the age of 49 years could be because of declining capacities – mainly a loss in lung capacity,39 a loss of cardiac output,40 a loss in skeletal muscle mass,41 and an increase in frailty.42 The decrease in endurance performance seemed to be primarily due to the cardiopulmonary system and its age-related decrease in peak oxygen uptake.18
In other sports, the age of peak performance was reached at a younger age than in ultracycling events: 25–35 years in marathons, 28 years in baseball, 24 years in tennis, and 31 years in golf.20 In 161 km ultramarathons, the maximal performance was achieved at 30–39 years in men and at 40–49 years in women.1–3 In a 100 km ultramarathon, the best times for women were observed at 30–54 years,5 so, consequently, even older athletes were able to achieve outstanding performances in ultraendurance events. In marathons, master athletes improved their running times at a greater rate than younger athletes22 and have probably not yet reached their limits.23 Table 1 presents the age groups of the fastest swim performances and the age of peak swim performance for distances from 50 m to ~38 km. The age of the athlete with the fastest swim performance increased as the swim distance increased. The same findings were made for running (Table 2) and triathlon (Table 3), where the age of peak endurance performance increased as the race distance increased.
Table 1.
Age group in which, and age at which, fastest swim performance achieved for male athletes
| Swim type | Mean age group in which fastest performance achieved (years) | Mean age when peak performance achieved (years) | References |
|---|---|---|---|
| 50 m | 20–30 | – | Tanaka and Seals43 |
| 50 m | – | 23.1 | Berthelot et al44 |
| 50 m | – | 26–27 | Rüst et al45 |
| 100 m | – | 21.4 ± 3.1a | Schulz and Curnow20 |
| 400 m | – | 19.9 ± 2.2a | Schulz and Curnow20 |
| 1500 m | 20–45 | – | Tanaka and Seals43 |
| 1500 m | – | 18.4 | Berthelot et al44 |
| 1500 m | – | 20.3 ± 3.5a | Schulz and Curnow20 |
| 1500 m | – | 26–27 | Rüst et al45 |
| 26.4 km, open water | – | 26.8 ± 0.5a | Eichenberger et al46 |
| 12-hour swim | 30–49 | – | Eichenberger et al47 |
Note:
Data presented as mean plus or minus standard deviation.
Table 2.
Age group in which, and age at which, fastest run performance achieved for male athletes
| Distance | Mean age group in which fastest performance achieved (years) | Mean age when peak performance achieved (years) | References |
|---|---|---|---|
| 100 m | – | 22.8 ± 2.3a | Schulz and Curnow20 |
| 200 m | – | 23.5 ± 2.1a | Schulz and Curnow20 |
| 800 m | – | 23.7 ± 2.7a | Schulz and Curnow20 |
| 1500 m | – | 24.8 ± 2.9a | Schulz and Curnow20 |
| 5000 m | – | 27.2 ± 3.9a | Schulz and Curnow20 |
| 10,000 m | – | 23.3 | Berthelot et al44 |
| 10,000 m | – | 27.5 ± 4.1a | Schulz and Curnow20 |
| Marathon | – | 27.8 ± 4.5a | Schulz and Curnow20 |
| Marathon | – | 28.9 ± 3.8a | Hunter et al21 |
| Marathon | – | 31.6 | Berthelot et al44 |
| 78 km ultramarathon | – | 33.9 ± 4.2a | Eichenberger et al15 |
| 100 km ultramarathon | 30–49 | – | Knechtle et al17 |
| 161 km ultramarathon | 30–39 | – | Hoffman1 |
| 161 km ultramarathon | 30–49 | – | Hoffman and Wegelin3 |
| 250 km ultramarathon | – | 37 ± 8a | Knoth et al48 |
Note:
Data presented as mean plus or minus standard deviation.
Table 3.
Age group in which, and age at which, fastest triathlon performance achieved for male athletes
| Distance | Mean age group in which fastest performance achieved (years) | Mean age when peak performance achieved (years)a | References |
|---|---|---|---|
| 1.5, 40, 10 km | 18–34 | Etter et al49 | |
| 1.9, 90, 21.1 km | 18–39 | Knechtle et al50 | |
| 3.8, 180, 42.2 km | 30–39 | Lepers and Maffiuletti9 | |
| 3.8, 180, 42.2 km | 33 ± 3 | Rüst et al16 | |
| 3.8, 180, 42.2 km | 34 ± 3 | Rüst et al51 | |
| 11.4, 540, 126.6 km | 25–44 | Knechtle et al17 | |
| 11.4, 540, 126.6 km | 38.5 ± 3.3 | Knechtle et al17 | |
| 38, 1800, 422 km | 25–44 | Knechtle et al17 | |
| 38, 1800, 422 km | 41.3 ± 3.1 | Knechtle et al17 |
Notes:
Data presented as mean plus or minus standard deviation. The distance column shows the split distances for swimming, cycling and running.
The advantages of master athletes leading to a successful participation in ultraendurance races, such as increased prerace experience10–13,29 and more training hours than other participants,10,12–14 seemed to compensate for the age-related changes in performance. The performance of those over 50 years of age had much less to do with this biological deterioration. Huonker et al41 showed that the aerobic muscular energy metabolism begins to decrease in the fourth or fifth decade of life. These energy reserves are needed for an extremely exhausting and challenging ultracycle, particularly the RAAM. A previous case report showed the energy expenditure of a solo rider in the RAAM where he burned off 17,965 kcal a day,52 and Hulton et al53 showed that this was three times the energy intake.
Limitations and implications for future studies
Several variables with an influence on performance in an ultraendurance sport are known, such as weather influences54–56 and adequate nutrition.13,52,53,57,58 Unfortunately, these aspects were not considered in the present study. The most important limitation was that the age of athletes was not recorded in the RAAM data, so the authors had to consider two RAAM-qualifier races in order to investigate the age of peak performance. Other limitations were missing data regarding training10–14 and prerace experience.10,12,14,29 Consequently, the authors could not investigate whether increased prerace experience also leads to a better performance in ultracycling races as it has been shown to do, for instance, in a Triple Iron ultratriathlon,10 and whether this is an important reason why the mean age of winners in ultra-endurance sports is older than the mean age of winners in non-ultraendurance sports.
Conclusion
The results of this study show that (1) 30%–40% of starters in ultracycling races were unable to finish, (2) the percentage of female finishers was 3%–11%, (3) the gender difference in performance was 18%–28%, and (4) ~50% of the successful finishers were master athletes. Future studies should investigate the reason for the low percentage of female participation and should focus on the age-related decline in other ultraendurance events in order to confirm that master athletes are predisposed to ultraendurance performances.
Acknowledgments
The authors thank Mary Miller for her help in translation.
Footnotes
Disclosure
The authors report no conflicts of interest in this work.
References
- 1.Hoffman MD. Performance trends in 161-km ultramarathons. Int J Sports Med. 2010;31(1):31–37. doi: 10.1055/s-0029-1239561. [DOI] [PubMed] [Google Scholar]
- 2.Hoffman MD, Ong JC, Wang G. Historical analysis of participation in 161 km ultramarathons in North America. Int J Hist Sport. 2010;27(11):1877–1891. doi: 10.1080/09523367.2010.494385. [DOI] [PubMed] [Google Scholar]
- 3.Hoffman MD, Wegelin JA. The Western States 100-Mile Endurance Run: participation and performance trends. Med Sci Sports Exerc. 2009;41(12):2191–2198. doi: 10.1249/MSS.0b013e3181a8d553. [DOI] [PMC free article] [PubMed] [Google Scholar]
- 4.Knechtle B, Knechtle P, Lepers R. Participation and performance trends in ultra-triathlons from 1985 to 2009. Scand J Med Sci Sports. 2011;21(6):E82–E90. doi: 10.1111/j.1600-0838.2010.01160.x. [DOI] [PubMed] [Google Scholar]
- 5.Knechtle B, Rüst CA, Rosemann T, Lepers R. Age-related changes in 100-km ultra-marathon running performance. Age (Dordr) 2012;34(4):1033–1045. doi: 10.1007/s11357-011-9290-9. [DOI] [PMC free article] [PubMed] [Google Scholar]
- 6.Lepers R. Analysis of Hawaii Ironman performance in elite triathletes from 1981 to 2007. Med Sci Sports Exerc. 2008;40(10):1828–1834. doi: 10.1249/MSS.0b013e31817e91a4. [DOI] [PubMed] [Google Scholar]
- 7.Zaryski C, Smith DJ. Training principles and issues for ultra-endurance athletes. Curr Sports Med Rep. 2005;4(3):165–170. doi: 10.1097/01.csmr.0000306201.49315.73. [DOI] [PubMed] [Google Scholar]
- 8.Hoffman MD. Ultramarathon trail running comparison of performance-matched men and women. Med Sci Sports Exerc. 2008;40(9):1681–1686. doi: 10.1249/MSS.0b013e318177eb63. [DOI] [PubMed] [Google Scholar]
- 9.Lepers R, Maffiuletti NA. Age and gender interactions in ultraendurance performance: insight from the triathlon. Med Sci Sports Exerc. 2011;43(1):134–139. doi: 10.1249/MSS.0b013e3181e57997. [DOI] [PubMed] [Google Scholar]
- 10.Knechtle B, Knechtle P, Rosemann T, Senn O. Personal best time, not anthropometry or training volume, is associated with total race time in a Triple Iron triathlon. J Strength Cond Res. 2011;25(4):1142–1150. doi: 10.1519/JSC.0b013e3181d09f0f. [DOI] [PubMed] [Google Scholar]
- 11.Knechtle B, Kohler G. Running performance, not anthropometric factors, is associated with race success in a Triple Iron triathlon. Br J Sports Med. 2009;43(6):437–441. doi: 10.1136/bjsm.2007.039602. [DOI] [PubMed] [Google Scholar]
- 12.Herbst L, Knechtle B, Lopez CL, et al. Pacing strategy and change in body composition during a Deca Iron triathlon. Chin J Physiol. 2011;54(4):255–263. doi: 10.4077/CJP.2011.AMM115. [DOI] [PubMed] [Google Scholar]
- 13.Knechtle B, Knechtle P, Rüst CA, Rosemann T, Lepers R. Finishers and nonfinishers in the ‘Swiss Cycling Marathon’ to qualify for the ‘Race Across America’. J Strength Cond Res. 2011;25(12):3257–3263. doi: 10.1519/JSC.0b013e31821606b3. [DOI] [PubMed] [Google Scholar]
- 14.Knechtle B, Wirth A, Knechtle P, Rüst CA, Rosemann T. A comparison of ultra-endurance cyclists in a qualifying ultra-cycling race for Paris-Brest-Paris and the Race Across America-Swiss Cycling Marathon. Percept Mot Skills. 2012;114(1):96–110. doi: 10.2466/05.PMS.114.1.96-110. [DOI] [PubMed] [Google Scholar]
- 15.Eichenberger E, Knechtle B, Rüst CA, Rosemann T, Lepers R. Age and sex interactions in mountain ultramarathon running – the Swiss Alpine Marathon. Open Access J Sports Med. 2012;3:73–80. doi: 10.2147/OAJSM.S33836. [DOI] [PMC free article] [PubMed] [Google Scholar]
- 16.Rüst CA, Knechtle B, Knechtle P, Rosemann T, Lepers R. The age of peak performance in elite male and female Ironman triathletes competing in Ironman Switzerland, a qualifier for the Ironman world championship, Ironman Hawaii, from 1995 to 2011. Open Access J Sports Med. 2012;3:175–182. doi: 10.2147/OAJSM.S37115. [DOI] [PMC free article] [PubMed] [Google Scholar]
- 17.Knechtle B, Rüst CA, Knechtle P, Rosemann T, Lepers R. Age-related changes in ultra-triathlon performances. Extrem Physiol Med. 2012;1:5. doi: 10.1186/2046-7648-1-5. [DOI] [PMC free article] [PubMed] [Google Scholar]
- 18.Reaburn P, Dascombe B. Endurance performance in masters athletes. Eur Rev Aging Phys Act. 2008;5(1):31–42. [Google Scholar]
- 19.Leyk D, Erley O, Ridder D, et al. Age-related changes in marathon and half-marathon performances. Int J Sports Med. 2007;28(6):513–517. doi: 10.1055/s-2006-924658. [DOI] [PubMed] [Google Scholar]
- 20.Schulz R, Curnow C. Peak performance and age among superathletes: track and field, swimming, baseball, tennis, and golf. J Gerontol. 1988;43(5):P113–P120. doi: 10.1093/geronj/43.5.p113. [DOI] [PubMed] [Google Scholar]
- 21.Hunter SK, Stevens AA, Magennis K, Skelton KW, Fauth M. Is there a sex difference in the age of elite marathon runners? Med Sci Sports Exerc. 2011;43(4):656–664. doi: 10.1249/MSS.0b013e3181fb4e00. [DOI] [PubMed] [Google Scholar]
- 22.Jokl P, Sethi PM, Cooper AJ. Master’s performance in the New York City Marathon 1983–1999. Br J Sports Med. 2004;38(4):408–412. doi: 10.1136/bjsm.2002.003566. [DOI] [PMC free article] [PubMed] [Google Scholar]
- 23.Lepers R, Cattagni T. Do older athletes reach limits in their performance during marathon running? Age (Dordr) 2012;34(3):773–781. doi: 10.1007/s11357-011-9271-z. [DOI] [PMC free article] [PubMed] [Google Scholar]
- 24.Lucía A, Joyos H, Chicharro JL. Physiological response to professional road cycling: climbers vs time trialists. Int J Sports Med. 2000;21(7):505–512. doi: 10.1055/s-2000-7420. [DOI] [PubMed] [Google Scholar]
- 25.Ultracycling.com [homepage on the Internet] Boulder, CO: UltraMarathon Cycling Association; 2012Available from: http://www.ultracycling.comAccessed November 8, 2012 [Google Scholar]
- 26.Raceacrossamerica.org [homepage on the Internet] Boulder, CO: Race Across America; 2013Available from: http://www.raceacrossamerica.orgAccessed November 8, 2012 [Google Scholar]
- 27.The508.com [homepage on the Internet] Oakpark, CA: Furnace Creek 508; 2013Available from: http://www.the508.comAccessed November 8, 2012 [Google Scholar]
- 28.Radmarathon.ch [homepage on the Internet] Oberwangen, Germany: Schweizer Radmarathon; 2011Available from: http://www.radmarathon.chAccessed November 8, 2012 [Google Scholar]
- 29.Knechtle B, Wirth A, Knechtle P, Rosemann T. Training volume and personal best time in marathon, not anthropometric parameters, are associated with performance in male 100-km ultrarunners. J Strength Cond Res. 2010;24(3):604–609. doi: 10.1519/JSC.0b013e3181c7b406. [DOI] [PubMed] [Google Scholar]
- 30.Jeukendrup AE, Martin J. Improving cycling performance: how should we spend our time and money. Sports Med. 2001;31(7):559–569. doi: 10.2165/00007256-200131070-00009. [DOI] [PubMed] [Google Scholar]
- 31.Krouse RZ, Ransdell LB, Lucas SM, Pritchard ME. Motivation, goal orientation, coaching, and training habits of women ultrarunners. J Strength Cond Res. 2011;25(10):2835–2842. doi: 10.1519/JSC.0b013e318204caa0. [DOI] [PubMed] [Google Scholar]
- 32.Lombardo MP. On the evolution of sport. Evol Psychol. 2012;10(1):1–28. [PubMed] [Google Scholar]
- 33.Deaner RO. Distance running as an ideal domain for showing a sex difference in competitiveness. Arch Sex Behav. June2012 doi: 10.1007/s10508-012-9965-z. Epub. [DOI] [PubMed] [Google Scholar]
- 34.Deaner RO, Mitchell D. More men run relatively fast in US road races, 1981–2006: a stable sex difference in non-elite runners. Evol Psychol. 2011;9(4):600–621. [PubMed] [Google Scholar]
- 35.Whipp BJ, Ward SA. Will women soon outrun men? Nature. 1992;355(6355):25. doi: 10.1038/355025a0. [DOI] [PubMed] [Google Scholar]
- 36.Drinkwater BL. Women and exercise: physiological aspects. Exerc Sport Sci Rev. 1984;12:21–51. [PubMed] [Google Scholar]
- 37.Levis DA, Kamon E, Hodgson JL. Physiological differences between genders: implications for sports conditioning. Sports Med. 1986;3(5):357–369. doi: 10.2165/00007256-198603050-00005. [DOI] [PubMed] [Google Scholar]
- 38.Coast JR, Blevins JS, Wilson BA. Do gender differences in running performance disappear with distance? Can J Appl Physiol. 2004;29(2):139–145. doi: 10.1139/h04-010. [DOI] [PubMed] [Google Scholar]
- 39.Taylor BJ, Johnson BD. The pulmonary circulation and exercise responses in the elderly. Semin Respir Crit Care Med. 2010;31(5):528–538. doi: 10.1055/s-0030-1265894. [DOI] [PMC free article] [PubMed] [Google Scholar]
- 40.Seals DR, Hagberg JM, Spina RJ, Rogers MA, Schechtman KB, Ehsani AA. Enhanced left ventricular performance in endurance trained older men. Circulation. 1994;89(1):198–205. doi: 10.1161/01.cir.89.1.198. [DOI] [PubMed] [Google Scholar]
- 41.Huonker M, Schmidt-Trucksäss A, Heiss HW, Keul J. Effects of physical training and age-induced structural and functional changes in cardiovascular system and skeletal muscles. Z Gerontol Geriatr. 2002;35(2):151–156. doi: 10.1007/s003910200019. [German] [DOI] [PubMed] [Google Scholar]
- 42.Rockwood K, Song X, Mitnitski A. Changes in relative fitness and frailty across the adult lifespan: evidence from the Canadian National Population Health Survey. CMAJ. 2011;183(8):E487–E494. doi: 10.1503/cmaj.101271. [DOI] [PMC free article] [PubMed] [Google Scholar]
- 43.Tanaka H, Seals DR. Age and gender interactions in physiological functional capacity: insight from swimming performance. J Appl Physiol. 1997;82(3):846–851. doi: 10.1152/jappl.1997.82.3.846. [DOI] [PubMed] [Google Scholar]
- 44.Berthelot G, Len S, Hellard P, et al. Exponential growth combined with exponential decline explains lifetime performance evolution in individual and human species. Age (Dordr) 2012;34(4):1001–1009. doi: 10.1007/s11357-011-9274-9. [DOI] [PMC free article] [PubMed] [Google Scholar]
- 45.Rüst CA, Knechtle B, Rosemann T. Women achieve peak freestyle swim speed at earlier ages than men. Open Access J Sports Med. 2012;3:189–199. doi: 10.2147/OAJSM.S38174. [DOI] [PMC free article] [PubMed] [Google Scholar]
- 46.Eichenberger E, Knechtle B, Knechtle P, et al. Sex difference in open-water ultra-swim performance in the longest freshwater lake swim in Europe: sex difference in ultra-swimming. J Strength Cond Res. June2012 doi: 10.1519/JSC.0b013e318265a3e9. Epub. [DOI] [PubMed] [Google Scholar]
- 47.Eichenberger E, Knechtle B, Knechtle P, Rüst CA, Rosemann T, Lepers R. No gender difference in peak performance in ultra-endurance swimming performance: analysis of the ‘Zurich 12-h Swim’ from 1996 to 2010. Chin J Physiol. 2012;55(5):346–351. doi: 10.4077/CJP.2012.BAA053. [DOI] [PubMed] [Google Scholar]
- 48.Knoth C, Knechtle B, Rüst CA, Rosemann T, Lepers R. Participation and performance trends in multistage ultramarathons: the ‘Marathon des Sables’ 2003–2012. Extrem Physiol Med. 2012;1:13. doi: 10.1186/2046-7648-1-13. [DOI] [PMC free article] [PubMed] [Google Scholar]
- 49.Etter F, Knechtle B, Rüst CA, Rosemann T, Lepers R. The age-related decline in Olympic distance triathlon performance differs between males and females. J Sports Med Phys Fitness. 2013 [PubMed] [Google Scholar]
- 50.Knechtle B, Rüst CA, Rosemann T, Lepers R. Age and gender differences in half-Ironman triathlon performances – the Ironman 70.3 Switzerland from 2007 to 2010. Open Access J Sports Med. 2012;3:59–66. doi: 10.2147/OAJSM.S32922. [DOI] [PMC free article] [PubMed] [Google Scholar]
- 51.Rüst CA, Knechtle B, Rosemann T, Lepers R. Sex difference in race performance and age of peak performance in the Ironman Triathlon World Championship from 1983 to 2012. Extrem Physiol Med. 2012;1:15. doi: 10.1186/2046-7648-1-15. [DOI] [PMC free article] [PubMed] [Google Scholar]
- 52.Knechtle B, Enggist A, Jehle T. Energy turnover at the Race Across America (RAAM): a case report. Int J Sports Med. 2005;26(6):499–503. doi: 10.1055/s-2004-821136. [DOI] [PubMed] [Google Scholar]
- 53.Hulton AT, Lahart I, Williams KL, et al. Energy expenditure in the Race Across America (RAAM) Int J Sports Med. 2010;31(7):463–467. doi: 10.1055/s-0030-1251992. [DOI] [PubMed] [Google Scholar]
- 54.Ely MR, Cheuvront SN, Roberts WO, Montain SJ. Impact of weather on marathon-running performance. Med Sci Sports Exerc. 2007;39(3):487–493. doi: 10.1249/mss.0b013e31802d3aba. [DOI] [PubMed] [Google Scholar]
- 55.Parise CA, Hoffman MD. Influence of temperature and performance level on pacing a 161 km trail ultramarathon. Int J Sports Physiol Perform. 2011;6(2):243–251. doi: 10.1123/ijspp.6.2.243. [DOI] [PubMed] [Google Scholar]
- 56.Vihma T. Effects of weather on the performance of marathon runners. Int J Biometeorol. 2010;54(3):297–306. doi: 10.1007/s00484-009-0280-x. [DOI] [PubMed] [Google Scholar]
- 57.Rüst CA, Knechtle B, Knechtle P, Rosemann T. Higher prevalence of exercise-associated hyponatremia in Triple Iron ultra-triathletes than reported for Ironman triathletes. Chin J Physiol. 2012;55(3):147–155. doi: 10.4077/CJP.2012.BAA010. [DOI] [PubMed] [Google Scholar]
- 58.Rüst CA, Knechtle B, Knechtle P, Rosemann T. No case of exercise-associated hyponatraemia in top male ultra-endurance cyclists: the ‘Swiss Cycling Marathon’. Eur J Appl Physiol. 2012;112(2):689–697. doi: 10.1007/s00421-011-2024-y. [DOI] [PubMed] [Google Scholar]