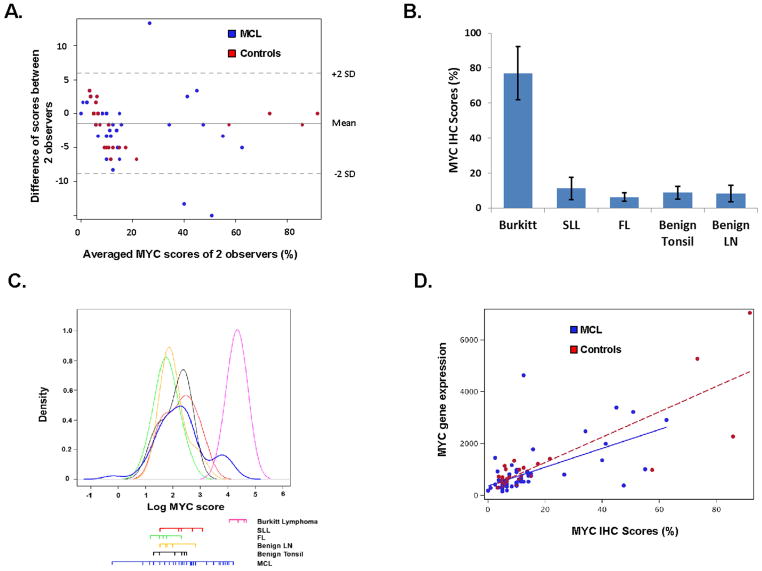
Figure 1. Validation of MYC immunohistochemical (IHC) staining through assessment of inter-observer correlation, staining pattern in control tissues, and correlation with MYC gene expression.
(A) Bland-Altman plot showing the degree of agreement between two independent pathologists scoring % MYC positive cells for 62 cases of MCL and 29 controls represented in a tissue microarray. Intra-class correlation coefficient = 0.98 (95% CI = 0.96–0.99). (B) MYC expression scores in control cases expressed as the average and standard deviation for 2 observers. Burkitt lymphoma (77.1 ± 15.1%), small lymphocytic lymphoma (11.3 ± 6.3%), follicular lymphoma (6.3 ± 2.5%), benign tonsil (8.8 ± 3.6%) and benign lymph node (8.3 ± 4.6%). (C) Frequency distribution of average MYC IHC scores for 62 MCL and 29 control cases that include 5 Burkitt lymphoma, 6 small lymphocytic lymphoma, 6 Grade 1 follicular lymphoma, 6 benign tonsil, and 6 benign lymph nodes. (D) Correlation of MYC IHC scores with MYC gene expression. Spearman’s correlation of Rho = 0.69 (p<0.0001) and 0.65 (p<0.0001) for MCL and control cases, respectively.

