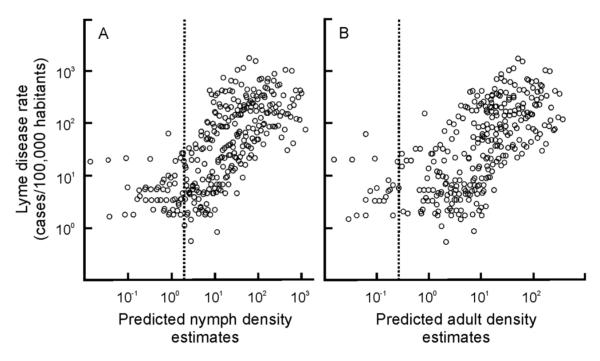
Fig. 5.
The relationship between model-predicted nymphal and adult density estimates (original units prior to log transformation are individuals/hectares) and the observed incidence of Lyme disease per county from 2004 to 2009. (A) Lyme disease incidence is significantly correlated with nymph density estimates greater than the hinge value (dotted line; hinge value=1.13 individuals hectare−1; R2=0.45, n=270, P < 0.0001) but not when estimates are lower than the hinge value (R2 = 0.02, n = 40, P > 0.05). (B) Similarly, the correlation between Lyme disease incidence and local adult densities is only significant for values greater that the hinge value (hinge value = 0.71 individuals hectare−1; R2 = 0.42, n = 281, P < 0.0001) but not when the estimates are lower than the hinge value (R2 = 0.02, n = 29, P > 0.05).

