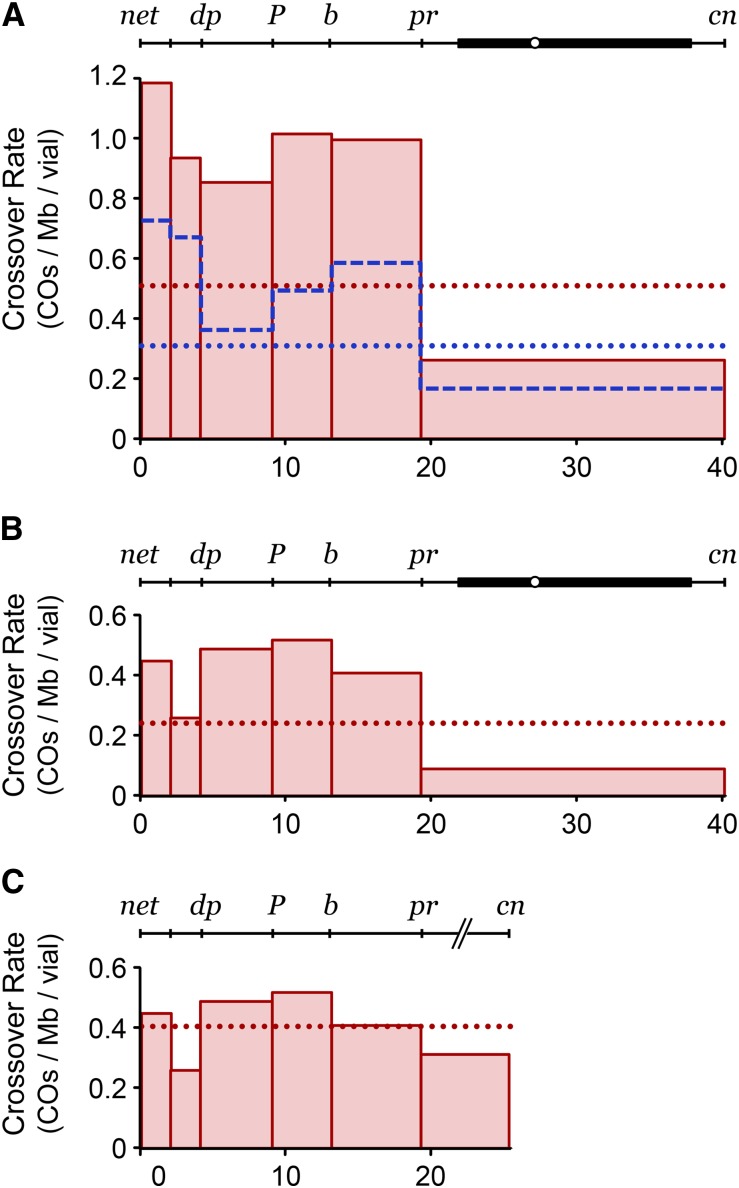
Figure 3.
Distribution of irradiation-induced crossovers. (A) Distribution of crossovers in Blm mutant males exposed to 250 rads of gamma irradiation during larval development; thick, dotted red line shows the mean frequency across the interval assayed (232 crossovers from 101 males). The thin, dashed blue line shows the distribution from unirradiated control males done at the same time; the thick, dotted blue line is the mean frequency in controls (202 crossovers from 140 males). (B) Distribution of crossovers resulting from irradiation. The unirradiated frequency was subtracted from each interval in A, removing spontaneous crossovers and leaving only irradiation-induced crossovers. (C) Data in B were regraphed to exclude the pericentric heterochromatin between pr and cn.

