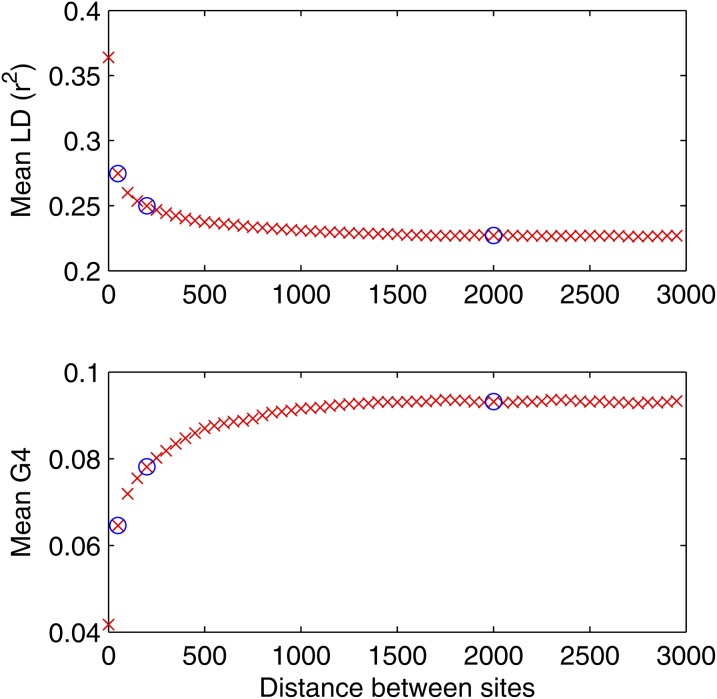
Figure 2.
LD and G4 plots for 13 Bacillus cereus whole genomes, as a function of the distance between pairs of sites. LD decreases and G4 increases until they both plateau at ∼1000 bp. The blue circles indicate the three values of LD and G4 that were used as summary statistics in the inference procedure.

