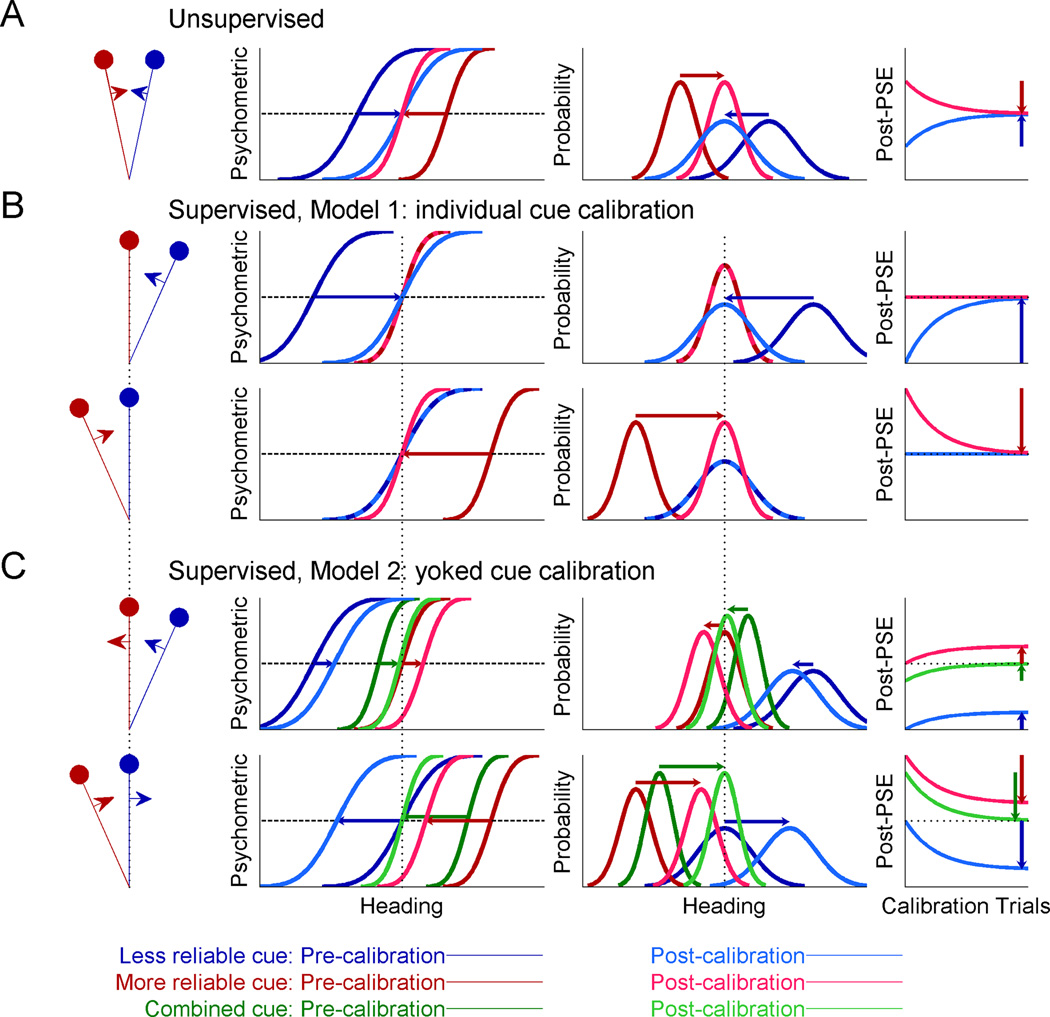
Figure 1. Simulations of multisensory calibration.
Two cues for heading direction were generated with a constant heading discrepancy between them (stimulus schematics, leftmost column). One cue was made more reliable (red), and the other, less reliable (blue). For each cue, psychometric plots (cumulative Gaussian functions; second column) were simulated to represent the ratio of rightward choices as a function of heading direction. Each psychometric plot’s intersection with the horizontal dashed line marks its point of subjective equality (PSE, estimate of straight ahead). Corresponding probability distributions (third column) represent the perceived heading for each cue in response to a particular heading stimulus, with biases equal in magnitude, but opposite in sign, to the PSEs. Vertical dotted lines represent accurate perception, according to external feedback. Dark colors represent pre-calibration (baseline) behavior, lighter colors, post-calibration, and the connecting horizontal arrows mark the cues’ shifts. The time-course of calibration is presented in the rightmost column, with the vertical arrows demonstrating complete calibration (corresponding to the post-calibration psychometric and probability distribution plots). (A) During unsupervised calibration, the cues shift towards one-another, achieving internal consistency. For supervised calibration: (B) According to Model 1, only the inaccurate cue is calibrated, both when it is less reliable (top, blue) and more reliable (bottom, red). (C) According to Model 2, only the combined cue is used and thus both cues are calibrated according the combined cue (green).

