

Abstract
Focal adhesions (FAs) are important adhesion sites between eukaryotic cells and the extracellular matrix, their size depending on the locally applied force. To quantitatively study the mechanosensitivity of FAs, we induce their growth and disassembly by varying the distribution of intracellular stress. We present a novel method for micromanipulation of living cells to explore the dynamics of focal adhesion (FA) assembly under force. Fibroblasts are sheared laterally to their adhesion surface with single PDMS micropillars in order to apply laterally stretch or compression to focal adhesions. This allows for measuring the shear force exerted by the micropillar and correlates it with FA length and growth velocity. Furthermore, we analyze the resulting dynamics of FA molecules (paxillin) and compare intensity profiles along FAs before and after the application of external force. The responses of stretched and relaxed FAs differ fundamentally: Relaxed and compressed FAs disassemble isotropically and show no length variation while stretched FAs grow unisotropically in the direction of the applied force and show protein influx only at their front.
Keywords: focal adhesion, cell adhesion, shear load, mechanosensitivity, micromanipulation, microfabrication, mechanotransduction
1. Introduction
Cell adhesion, spreading and motility are mediated by the assembly and disassembly of specialized transmembrane adhesion sites, termed focal adhesions (FAs). These molecular aggregates link the extracellular matrix to the actin cytoskeleton via transmembrane integrin receptors and various cytoplasmic plaque proteins, e.g. paxillin [1]. Over the last decade it has become evident that FAs are bidirectional mechano-chemical interfaces [2-6]: They exert [7-11] and sense [12-16] forces, i.e. they convert biochemical signals into mechanical force and vice versa. This way, cells manipulate and explore their surrounding tissue. Riveline et al. [12] showed that the intrinsic force generated by the contractile machinery of the cell, which leads to FA growth, can be substituted by external forces. However, the exact mechanism behind FA-mediated mechanosensing remained unclear. This unsolved question recently prompted several competing theories that attempt to model the physical principles governing the force-induced assembly of adhesion plaque proteins [17-21].
Our study aims at providing a detailed, time-resolved insight into the force-induced growth and disassembly of FAs. Opposite FAs are coupled via the actin cytoskeleton. We externally shear single cells with a micromanipulation device. This increases the mechanical stress transmitted through the cytoskeleton at the rear of the cells which results in stretching and compression of FAs (compare figure 1 inset). Most importantly, we intend to induce cellular responses within minutes in order to be able to distinguish the reaction to the changed loading situation from long-term events like altered gene expression of involved proteins as done in the flow experiments of Davies et al [15]. To perform this experiment, we developed a biocompatible tool that is able to instantaneously exert forces on the order of 100 nN to cells in a very controlled manner.
Figure 1.
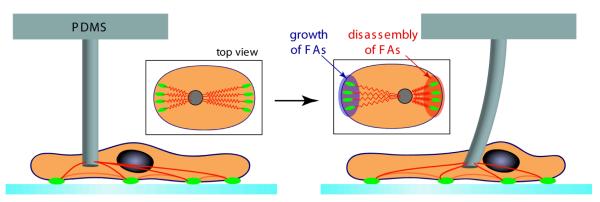
Schematic representation of the experiment. First, the cell is allowed to spread for at least 30 min. on a glass substrate. Then a microfabricated pillar coated with fibronectin is brought in contact with the dorsal side of the cell and kept there for approximately 15 min. in order to ensure stable adhesion between pillar and cell. Culture conditions are chosen such that the actin cytoskeleton (red) has not formed stress fibers. When the pillar is shifted laterally, the cytoskeleton is strained and the FAs respond according to the new force loading situation. Typically this takes 15 min.
In the last years, many different approaches in cell science revealed that cells are most sensitive to their chemical environment [22], to the lateral confinement at which molecules are offered to the cell membrane, i.e. receptor clustering,[23,24] and to the stiffness of the matrix which surrounds the cell[25,26]. The molecular components enrolled in these communication skills of cells are actin, myosin, adhesion associated proteins such as Integrins which form a network that results in the application of forces to the extracellular matrix in order to test the chemical and physical composition of it [27]. The outcome of this communication network has substantial impact on the structure of the extracellular matrix, the structure of cells and cell assemblies as well as their functions [28].
During the last 20 years, micromanipulation of living cells in the field of biophysics has been conducted in a multitude of ways, e.g., by optical tweezers, magnetic tweezers, shear flow, atomic force microcospy (AFM) and micropipette aspiration (for reviews, see [6, 29]). The forces generated by most of these tools are too weak for our purpose, with the exception of micropipette aspiration, which has not been used on adherent cells, and the AFM, which is not very viable for exerting lateral forces. Therefore, we constructed a novel micromanipulation tool to apply lateral forces to FA sites: cell-attached single micropillars. These microstructures made from Polydimethylsiloxane (PDMS) are tailored to our purposes and functionalized with fibronectin to attract cell adhesion. Once positioned on the dorsal side of cells, we move them laterally to the adhesion area with a micromanipulator to shear the entire cell, perturb the intracellular tension and trigger changes in FA dynamics. The change in internal stress is fast and drastic compared to intrinsic actomyosin-contractility. Thus, we are able to see clearly where new plaque proteins, in our case YFP-labeled paxillin molecules, are inserted into FA sites. Moreover, the micropillars can be used as force sensors to monitor the applied lateral force in real time. Hence, force-induced FA remodeling can be systematically measured and correlated with externally applied forces. The presented data will be valuable for the further refinement and verification of theories in this field [18].
2. Materials and Methods
2.1. Cell Culture
REF-52 cells (Rat Embryonic Fibroblasts; gift from B. Geiger, Weizmann Institute) stably transfected with YFP paxillin were cultured in DMEM (Dulbeccos Modified Eagle Medium, Invitrogen, Germany) supplemented with 10% fetal bovine serum (Invitrogen) and 1% L-glutamine (Invitrogen) at 37°C in a humidified, 10% CO2 environment. All measurements were performed in an incubator mounted on an inverted microscope maintained at 37 °C and 5% CO2. Before measurements, REF cells were seeded in 60 mm glass bottom petri dishes filled with F-12 + Glutamax medium (Invitrogen, Germany) supplemented with 2% fetal bovine serum (FBS) and 1% Penicillin-Streptomycin solution (Invitrogen) and allowed to spread for at least 30 minutes, so that they were able to establish small focal adhesion clusters. The glass bottom was not functionalized in order to slow down cell spreading and adhesion and, thus, enhance adhesion of the cells to the fibronectin-coated micropillars that were to be placed on their dorsal side. Together with a small amount of FBS in the medium, the untreated substrata also ensured the presence of FAs that are small enough to grow, yet big enough to shrink as long as experiments were conducted within 4 hours after seeding.
2.2. Fabrication, Mounting and Calibration of PDMS Micropillars
Prepolymer of PDMS (Sylgard 184, Dow-Corning) was poured over an array of holes in SU-8 (Microchem, Newton, MA) created on silicon wafers via standard photolithography [11, 30, 31] and cured at 65 C overnight, yielding arrays of elastic PDMS micropillars of 5 μm diameter, a height of 11 μm, and a distance of 50 μm. Prior to the experiments, these were treated with Hydrogen plasma (10 sec, 0.4 mbar, 150 W in Plasma etcher (100-E) from TePla) and subsequently immersed in 20 μg/ml fibronectin (from bovine plasma, Invitrogen) for 30 min. During the process of molding, they were attached to thin glass plates (0.14 mm 1 mm 20 mm) via sandwich assembly (see figure. 2(a)). The glass plates were then used to mount the pillars to a micromanipulator (see figure. 2(b)). The micromanipulator is connected to an inverted microscope and consists of three micrometer screws, one of them equipped with a piezo unit in order to allow very fine positioning in the z-direction. For the small deflections found in our experiments, the posts can be assumed to behave like linear springs, i.e. their deflection is directly proportional to the applied force (see [11]). To determine the constant of proportionality, the micropillars were calibrated against AFM cantilevers of known flexibility after successful experiments. For our conditions, the force constant was around 0.2 N/m.
Figure 2.

Micropillar fabrication and micromanipulation setup. (a) A glass plate (blue) is positioned between two aluminum pieces (gray) such that there is a gap between its front and the master mold (dark blue). That gap is then filled with PDMS which is cured overnight at 65°C and cut out afterwards. The resulting PDMS pillow with micropillars is attached to the glass plate and can easily be mounted to the XYZ stage on the microscope (b).
2.3. Micromanipulation
The micromanipulation set-up is schematically shown in figure 1. It was isolated from environmental vibration noise by an air-buffered table. Once a micro pillar was put in contact with the cell surface and sufficient adhesion of the tip of the top of the pillar to the cell surface could be obtained no vibration of the tip was observed by the optical microscope. Also no thermal drift was accountable during the time of the experiments, i.e. during several hours. These stability tests were performed on cells, which were dead so that vibration and thermal drift of pillars due to the viability of the cell could be neglected. Additional acoustic isolation was found not to be necessary.
Approximately round cells with focal adhesions between 1 and 3 μm in length were selected for the micromanipulation. Using the z-piezo, a fibronectin-coated micro pillar was carefully lowered onto the dorsal side of the cell halfway between its outer edge and its nucleus (compare figure. 1). The micropillar was left at this position for 14-18 min. so that the cell was able to adhere to it. Then it was moved across the cell using a micrometer screw. This way, the cell was sheared and the intracellular stress of the cytoskeleton was redistributed.
In figure. 3 we show typical phase contrast and fluorescence images for an experiment on a cell right before pulling (17 min.), after pulling left (24 min.) and after pulling upwards (44 min.) with the microfabricated pillar. One can clearly see the cellular deformations caused by the pillar shift and the resulting remodeling of FA distribution. Such double pull experiments were performed in order to increase the number of affected FAs and to study counteracting effects of consecutive compression and stretch or vice versa.
Figure 3.

Double-pull experiment. Phase contrast pictures showing cell and micropillar shortly before lateral pulling (a), after first pulling (b) and after second pulling (c). The red arrow indicates the force exerted by the micropillar which was moved manually twice (at 18 min. and 37 min.). (d-f) Fluorescence micrographs showing the resulting distribution of YFP-paxillin. Force-induced variations (orange box, growth) and (yellow box, first stationary then growth) of FAs can be seen (for a detailed analysis see figure 5). Scale bar is 5 μm. (g). The graph depicts the force development computed from the pillar position compared to that of its neighbor. Arrows mark the times where the pillar was moved manually. Relaxation of external load can be seen.
We have analyzed approximately 20 out of 40 cells successfully by this technique, which all resulted in similar behaviors of focal adhesions assembled at the substrate interface. Intense fluorescent imaging of cells resulted in cell death. Therefore, cells were carefully analyzed for their active response in order to prove their viability.
2.4. Microscopy and Image Analysis
Cells were observed both in phase contrast and fluorescence microscopy through an inverted microscope (Axiovert 100, Zeiss, Germany) equipped with a halogen and a 100 W mercury vapor lamp (HBO 100, Osram, Germany) and an environmental chamber. Images were taken with a 63× objective (Plan-Apochromat 63x/1,4 Oil Ph3, Zeiss, Germany) and recorded with a digital charge-coupled device camera (ORCA-ER 12-AG, Hamamatsu Photonics, Germany). Typically, one frame was recorded per minute. Fluorescence image sequences were preprocessed in ImageJ (version 1.37c, developed by Wayne Rasband at NIH, Bethesda, USA, http://rsb.info.nih.gov/ij/). They were registered with the plugin “StackReg” [32], and the fading intensity subsequently corrected with the plugin “Bleach Correction”. Threshold-based segmentation and evaluation of the focal adhesion areas were performed in Matlab (The Mathworks Inc., USA). An ellipse was fitted to each detected FA, and the ends of its major axis were defined as back and front of the FA, the front being always the part that is closer to the nucleus. Before differentiating the time-dependent back and front position, these data had to be smoothed in order to prevent the resulting velocities from being overly noisy. For this, we employed the “smoothing cubic spline” function implemented in Matlab which is a median between a cubic spline fit and a linear fit.
Kymographs of single FAs were made by rotating the fluorescence stacks in ImageJ such that the major axes of the FAs were horizontal, cropping them, and re-slicing to switch the time axis and the y-axis. Thereafter, stacks were z-projected using the Standard Deviation option, resulting in images with time located on the y axis and distance on the x-axis. The kymographs were then converted to 8 bits and saved.
2.5. Force Detection
To evaluate the forces that were applied via the micropillar to the cells, it was necessary to find the deflection of the micropillar connected to the cell with high precision automatically. Hence, we determined the time evolution of two pillars: the pillar that was connected to the cell and a free neighboring reference pillar, which was not bent. To gain the required precision, we used the fact that the micropillars appear as concentric ring structures in phase contrast images (compare figure 3 a-c). Our algorithm assigns a concentricity rating to eachsub-pixel coordinate in question by unwrapping the picture (i.e. transforming it to polar coordinates) around the respective position and evaluating the angle-averaged radial profile with the following symmetry metric
| (1) |
where rmin, rmax and g are the minimal considered radius, maximal radius and average gray value at a certain radius, respectively (see figure 4).
Figure 4.

Principle of ring center detection algorithm. Images of micropillars showing interference rings (a, d) are unwrapped (i.e. transformed to polar coordinates) around the subpixel coordinates to be tested (red x). In (a), the tested coordinate is at the center of the rings, while in (d), it is shifted to the lower left. The resulting unwrapped pictures (b, e) display lines that become straighter the closer the tested position is to the center of the circles. Thus, the angle-averaged radial profile for a tested coordinate at the center of the rings (c) shows more fluctuations than the profile for an off-center coordinate (f). This is reflected in the values of the symmetry metric .
To increase performance, regions within circles were automatically detected on a down-sampled image via a circular Hough transformation. Then, the position of the center of the rings was iteratively refined by employing the algorithm described above with decreasing step size. The coordinate with the highest symmetry metric was taken to be the center of the circles. Deflection of the micropillar on top of the cell was subsequently computed as the change of distance to an adjacent pillar and multiplied with the calibrated force constant to yield the total external force applied to the cell. This vector was projected onto the major axes of FAs such that positive values mean external stress pointing from back to front of the respective FA.
The spatial resolution of this algorithm was around 20 nm for good picture quality corresponding to 0.2 pixels or 4 nN for our system. However, uneven illumination or dirty pillars can significantly reduce this performance. All computations were done after experiments in the Matlab environment (The Mathworks Inc., USA). With our algorithm, one pair of pillars was evaluated within 3 seconds on a standard desktop computer (Intel Pentium 4,3 GHz, 2 GB RAM). Thus, the program could in principle be extended to monitor and control forces in real time, provided that there is a XY-Stage that can be controlled via computer.
3. Results
3.1. Focal Adhesion Remodeling Induced by External Shear Stress
Figure 3 shows a double-pull experiment in which a fibroblast was first subjected to stress in x-direction and then in y-direction. The phase contrast pictures show the deformations caused to the cell body and the position of the micropillar (figure 3a-c). Comparing the latter to the position of its neighboring micropillar which was not bent (not shown), the externally applied forces were calculated. The force’s temporal development is shown in figure 3g, and red arrows in the phase contrast images indicate the force at the time the pictures were taken. After each lateral movement of the micropillar, the system was left alone and the subsequent relaxation of the external force was observed (see figure 3g). Resulting from the manipulation of the intracellular stress, the FA assembly of the cell underwent a remodeling (compare figure 3d-f). We found increased fluorescent paxillin intensity and an elongation of FAs in regions subjected to stretching, such as the lower right region of the cell in figure 3f. On the other hand, FAs in regions with decreased internal stress showed only a loss of fluorescence and no discernible variation of their length (compare left hand side of figure. 3e and upper half of the cell in figure. 3f; see also fluorescent intensity analysis in figure. 7). This distinct behavior, elongation and increased fluorescence intensity for stressed FAs on the one hand and isotropic intensity loss for relaxed FAs on the other hand, was observed in all conducted experiments. From stationary FAs we found that the bleaching of fluorescent was found to be negligible in comparison to variation of fluorescence due to molecule diffusion in non stationary FAs.
Figure 7.

Influence of lateral stretching and compression of FAs on paxillin fluorescence intensity profiles along FAs. Kymographs of a growing (a) and disassembling (e) FA are shown. Time points of stretching and compression are marked by a white, respectively, black arrow. Temporal averaging over the blue and green boxes results in the intensity profiles before (blue) and after (green) application of external force (b, f). The box width was chosen according to the width of constant fluorescent condition. Subtraction of the profile before pulling from the profile after pulling reveals the distribution of proteins that have moved into the FA as a response to stress (c, d), a Gaussian distribution that is centered over the former front of the FA and flattens over time (see d). Compression evokes a distinctly different response: Instead of reacting only at the front, the FA loses intensity over its whole length. This becomes most obvious when computing the ratio of intensities before and after compression which stays rather constant - except for deviations at the very front and back that are due to overall movement of the FA (h).
For movies of this experiment refer to the online supplementary material. Phase contrast microscopy movie (movie 1) shows changes of cell shape to variations of applied force and fluorescence microscopy movie displays paxillin dynamics in FAs as a function of applied force (movie 2). A more detailed analysis of the FA remodeling is presented in figure 5. Here, kymographs are shown that are derived from the FAs inside the orange (figure 5 a-d) and yellow (figure 5 e-h) boxes in figure 3. Using the image analysis algorithms described above, the front and back position of the FAs were detected for each frame (figure 5 b, f solid lines). To reduce the large errors stemming from the temporal derivative, a cubic smoothing spline fit was applied to the position data (figure 5 b, f dashed lines) before calculating the velocity of the back and front of the FAs (figure 5 c, g). The resulting position and velocity data of the FA back and front reveal distinct features for the two cases: Upon stretching, both the front and back of the FA move in the direction of the applied force but the front moves at a much higher velocity leading to a net growth of the FA (compare figure 5 b, c). Upon compression, however, the observed FA does not shrink noticeably but merely stops growing and loses intensity (figure 5 e-g). The latter process proved to be reversible: The growth of the FA was reinitiated later by an application of a force in the opposite direction.
Figure 5.

Dynamics of a stretched (a-d) and a compressed (e-h) FA. Kymographs gained from the FAs inside the orange (a) and yellow (e) box in figureure 3 show the temporal development of the FAs after external manipulation. Times of external pulling and compression are denoted by white and black arrows in the Kymographs and by dashed lines in the graphs below. The resulting positions (b, f) and velocities (c, g) of back and front gained through image analysis as described below reveal distinct features for the two cases: upon stretching, both front and back of the FA move in the direction of the applied force (b), but the front moves at a much higher velocity (c) leading to a growth of the FA. Upon compression, however, a FA does not shrink but merely stops growing and loses intensity (e-g). The total external force as measured by micropillar deflection is projected onto the direction of the major axis of the respective FA such that positive values stand for stretching and negative force compression (d, h). The velocity of the front scales similarly to the externally applied force. Even small deviations in the force curve, irregularities due to intrinsic cell movement, are matched by corresponding peaks in the velocity curves (see gray arrows). Due to the uncertainty of stress distribution inside the cell, force values can only be compared between external movements of the pillar, i.e. between the dashed lines.
As explained above, the measured total external force was projected onto the major axis of the respective FA to reflect the relative amount of stress applied in its preferential growth direction (figure 5 d, h). Thus, positive values stand for stretching and negative values for compression of the FA in question. Following each lateral movement of the pillar (depicted by vertical dashed lines in figure 5), these force curves consistently depict a relaxation of the system. Interestingly, the velocity curve of the front of the stretched FA follows the force curve down to its small irregularities which are possibly due to intrinsic cell movement (gray arrows).
Note that the exact distribution of the externally applied stress to the different FAs is unknown and changes after each manual movement of the micropillar. Thus, the projected forces after pillar movement cannot be compared to the ones before. This means, a proper scaling of the forces can only be assumed between the dashed lines in figure 5. This explains for example that the second manual pillar movement barely influences the contact depicted in the left column of this figure but significantly affects the contact in the right column - despite the nominal value of the projected forces.
These characteristic, distinct reactions of FAs to stretching and relaxation were observed in all conducted experiments. Compare figure 6 for an overview of selected FA kymographs. The reversibility of these processes has been confirmed during several measurements: Growth was induced in stationary FAs and subsequently stopped again by lowering the intracellular tension (see e.g. figure 6 k, l) and vice versa (figure 6 b, m).
Figure 6.
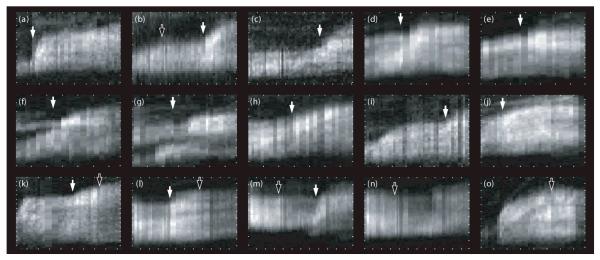
Compilation of FAs that have been stretched (white arrows) and compressed (black arrows). In the kymographs, ticks denote 5 minutes on the x-axes and 5 μm on the y-axes. Upon stretching FAs elongate and display consistently a spatially very confined integration of new paxillin molecules at their front, whereas compression results in stagnation of length and fluorescence loss over the whole FA.
3.2. Intensity Profiles along Stressed Focal Adhesions
A closer look at the intensity distribution of remodeling FAs reveals even more substantial differences between stretched and relaxed focal adhesions: figure 7 shows a comparison of the intensity profile along the major axis of a stretched (a-d), respectively relaxed (e-h) FA before and after force application. Times of stretching and compression are marked by a white, respectively black arrow. Temporal averaging over the blue and green boxes results in the intensity profiles before (blue) and after (green) external shear (figure 7 b, f). The difference between the two shows where exactly proteins have moved into or out of the FA as a response to the changed loading situation (figure 7 c, g). In the case of the stretched FA, this analysis reveals a Gaussian distribution that is centered over the former front of the FA. This means that only there, the FA reacts to the increased stress. A subtraction of the averaged profiles before and after stretching from each row of the original kymograph depicts nicely how this Gaussian peak diffuses over time (compare figure 7 d). Compression evokes a distinctly different response. Instead of reacting only at the front like its stretched counterpart, the relaxed FA loses intensity over its whole length. This becomes most obvious when computing the ratio of intensities before and after compression which stays rather constant (compare (figure 7 h) - except for deviations at the very front and back that are due to overall movement of the FA. FA adhesions did not loose considerably fluorescence intensity in the stationary case meaning that fluorescence bleaching contributed minor to the loss of fluorescence intensity than the molecular diffusion.
Hence, the insight gained from this investigation is that in the case of stretched FA only its very front responds to the external stimulus, whereas the relaxed FA loses plaque proteins over its whole length. In figure 6, we show an overview of kymographs collected from seven different cells to demonstrate how these characteristic reactions apply qualitatively to all examined cells. The Gaussian distributions seen in the kymographs of all stretched FAs deserve some more attention. Figure 8a displays paxillin influx profiles computed from kymographs upon FA stretching shown in figure 6. The Gaussian peaks seen consistently in these profiles display a very variable width. A plot of the full width at half maximum (FWHM) of Gaussian fits to these influx profiles vs. the length of the corresponding FA shows a proportionality (figure. 8 b) but not origin at 0. Consistently, this suggests that the velocity of FA growth at its front increases with force.
Figure 8.
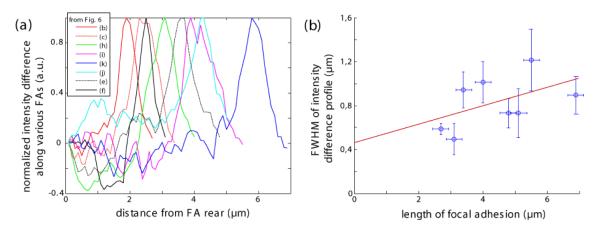
(a) Graph shows the difference in paxillin fluorescence intensity before and after stress application for several focal adhesions (analogous to figure. 7c). The intensity is normalized such that the maximal difference is 1. The legend indicates to which kymograph in figure 6 the respective profile corresponds. (b) Plot of the full width at half maximum of the depicted intensity profiles versus the length of the corresponding FA. The red line represents a linear fit to these data.
4. Discussion
4.1. Dynamics of Focal Adhesion Molecules under External Shear
We successfully induced controlled FA assembly and disassembly by shearing cells with microfabricated, flexible polymer pillars. Our results are in accordance with those obtained in previous studies [12, 33] but go beyond them with respect to their temporal and spatial resolution. Our studies were performed on live cells and the FBS concentration in the medium was carefully chosen to keep them in an intermediate state where they were neither starved nor completely spread. Hence, their metabolism was ensured to be active and responsive to both external stretching and compression of FA - unlike in previous experiments by Riveline et al. [12] where cells were serum-starved and, thus, not able to produce mature FAs. Focal adhesions that were subject to increased lateral stress displayed a distinct growth behavior. The front end moved at a velocity of up to 0.3 μm/min proportional to and in the direction of the applied stress. The rear of the observed FAs was consistently rather stationary and showed very little reaction to applied forces. Thus, externally stretched FAs displayed a net growth along their major axis, a finding consistent with previous studies [12]. On the other hand, we found that relaxation of FAs causes only negligible shortening but may stop ongoing growth (compare figure 5 f, g). Our observations are in line with a study of Chen et al. where arrays of magnetic micro pillars where fabricated and applied to cells for studying focal adhesion formation under external load. Here, an array of pillars to which focal adhesions were attached was mechanical stimulated resulting in simultaneous application of forces to several focal adhesions via several pillar posts [34].
A comparison of the intensity profile before and after pulling yielded interesting insights into the exact position of newly inserted plaque proteins (see figure 7c, figure 8) and their dynamics. Stretched focal adhesions showed an influx of plaque proteins only in their front region. The profile of this additional fluorescence intensity displayed Gaussian distributions with FWHMs between 0.5 μm and 1.5 μm. Interestingly, FWHM increased with the length of FA (see figure 8b). Since length of FA correlates with the applied force we assume that higher forces increases the velocity of FA growth and such influx of plaque proteins in FA’s front. Conversely, the FA remodeling following a decrease of internal pre-stress proved to be isotropic: a uniform loss of plaque proteins along the whole length of the respective FA was observed (compare figure 6h). All these processes have been found to be reversible: We have induced growth in stationary FAs and subsequently stopped it again by lowering the intracellular tension (see e.g. figure 6k, l) and vice versa (figure 6b, m).
4.2. Impact on Theoretical Models
The presented data will allow for refining the competing theories which describe underlying principles of mechanosensitivity [17, 18]. The observed growth velocities, intensity profiles along FAs and their evolution over time can be compared to the predictions of the models that deal with the dynamics of force-induced focal adhesion remodeling. In particular, the spatially very confined influx of protein molecules primarily into the front of stretched FAs allows for differentiating between these two models. The experiments show that the influx of proteins into the front of stretched FAs is consistent with the theory presented by Besser and Safran, who derive an influx proportional to the protein density gradient which should be maximal at the FA edges [18, equation 25]. The theory by Shemesh et al. predicts a smoothly varying influx along a stretched focal adhesion [17, equation 12], which was not observed in the experiments presented here. However, to make definitive statements about the validity of either of the theoretical models, detailed calculations of the influx profile for a given stress are needed within the framework of the respective models. These calculations need to include a more realistic assumption for the stress profile along the FAs than a linear one, for example the one suggested by Aroush and Wagner [21]. The observed disassembly of plaque proteins over the whole length of relaxed FA is, so far, not in accordance with either theory. This might change if a non-constant stress profile will be assumed (see above).
5. Summary
In summary we have observed that single PDMS micropillars are a viable tool to laterally shear cells. We have applied forces of up to 150 nN and detected them via an algorithm with an accuracy of approximately 4 nN. One drawback of our setup is the uncertainty of force distribution inside a particular cell. We only know how much force is applied in total and that this force has to be transmitted through the FAs to the substratum, but the amount of force at a particular FA can only be estimated, e.g. by employing cytoskeleton simulations [35]. In the future this will be overcome by seeding cells onto polyacrylamide gels with embedded marker beads to enable the tracking of forces below single focal adhesions. Future experiments could, furthermore, include a force feedback system that monitors applied forces in real time. This would e.g. allow studying the effect of oscillating or constant, non-relaxing, stress on FA growth. Also, it is possible to extend our setup with a FRAP system.
Supplementary Material
Acknowledgement
We thank Achim Besser for stimulating discussions and critical review of the manuscript. Furthermore, we thank Benjamin Geiger for stimulating discussions and his interest in this work as well as for support with respect to cell culture and cell manipulation. This publication and the project described herein were also partly supported by the National Institutes of Health, through the NIH Roadmap for Medical Research (PN2 EY 016586). The work was also supported by the Excellence Cluster “CellNetworks” of the University of Joachim Spatz holds a Weston Visiting Professorship at the Weizmann Institute, Department of Molecular Cell Biology. The support of the Max Planck Society is highly acknowledged.
References
- [1].Zamir E, Geiger B. Molecular complexity and dynamics of cell-matrix adhesions. J Cell Sci. 2001;114:3583–3590. doi: 10.1242/jcs.114.20.3583. [DOI] [PubMed] [Google Scholar]
- [2].Geiger B, Bershadsky A. Assembly and mechanosensory function of focal contacts. Curr Opin Cell Biol. 2001;13:584–592. doi: 10.1016/s0955-0674(00)00255-6. [DOI] [PubMed] [Google Scholar]
- [3].Bershadsky AD, Balaban NQ, Geiger B. Adhesion-dependent cell mechanosensitivity. Annu Rev Cell Dev Biol. 2003;19:677–695. doi: 10.1146/annurev.cellbio.19.111301.153011. http://dx.doi.org/10.1146/annurev.cellbio.19.111301.153011. [DOI] [PubMed] [Google Scholar]
- [4].Wehrle-Haller B, Imhof B. The inner lives of focal adhesions. Trends Cell Biol. 2002;12:382–389. doi: 10.1016/s0962-8924(02)02321-8. [DOI] [PubMed] [Google Scholar]
- [5].Ingber DE. Mechanosensation through integrins: cells act locally but think globally. Proc Natl Acad Sci USA. 2003;100:1472–1474. doi: 10.1073/pnas.0530201100. http://dx.doi.org/10.1073/pnas.0530201100. [DOI] [PMC free article] [PubMed] [Google Scholar]
- [6].Vogel V, Sheetz M. Local force and geometry sensing regulate cell functions. Nat Rev Mol Cell Biol. 2006;7:265–275. doi: 10.1038/nrm1890. http://dx.doi.org/10.1038/nrm1890. [DOI] [PubMed] [Google Scholar]
- [7].Galbraith CG, Sheetz MP. A micromachined device provides a new bend on fibroblast traction forces. Proc Natl Acad Sci USA. 1997;94:9114–9118. doi: 10.1073/pnas.94.17.9114. [DOI] [PMC free article] [PubMed] [Google Scholar]
- [8].Balaban NQ, Schwarz US, Riveline D, Goichberg P, Tzur G, Sabanay I, Mahalu D, Safran S, Bershadsky A, Addadi L, Geiger B. Force and focal adhesion assembly: a close relationship studied using elastic micropatterned substrates. Nat Cell Biol. 2001;3:466–472. doi: 10.1038/35074532. http://dx.doi.org/10.1038/35074532. [DOI] [PubMed] [Google Scholar]
- [9].Beningo KA, Dembo M, Kaverina I, Small JV, Wang YL. Nascent focal adhesions are responsible for the generation of strong propulsive forces in migrating fibroblasts. J Cell Biol. 2001;153:881–888. doi: 10.1083/jcb.153.4.881. [DOI] [PMC free article] [PubMed] [Google Scholar]
- [10].Munevar S, Wang Y, Dembo M. Traction force microscopy of migrating normal and H-ras transformed 3T3 fibroblasts. Biophys J. 2001;80:1744–1757. doi: 10.1016/s0006-3495(01)76145-0. [DOI] [PMC free article] [PubMed] [Google Scholar]
- [11].Tan JL, Tien J, Pirone DM, Gray DS, Bhadriraju K, Chen CS. Cells lying on a bed of microneedles: an approach to isolate mechanical force. Proc Natl Acad Sci USA. 2003;100:1484–1489. doi: 10.1073/pnas.0235407100. http://dx.doi.org/10.1073/pnas.0235407100. [DOI] [PMC free article] [PubMed] [Google Scholar]
- [12].Riveline D, Zamir E, Balaban NQ, Schwarz US, Ishizaki T, Narumiya S, Kam Z, Geiger B, Bershadsky AD. Focal contacts as mechanosensors: externally applied local mechanical force induces growth of focal contacts by an mDia1-dependent and ROCK independent mechanism. J Cell Biol. 2001;153:1175–1186. doi: 10.1083/jcb.153.6.1175. [DOI] [PMC free article] [PubMed] [Google Scholar]
- [13].Wang HB, Dembo M, Hanks SK, Wang Y. Focal adhesion kinase is involved in mechanosensing during fibroblast migration. Proc Natl Acad Sci USA. 2001;98:11295–11300. doi: 10.1073/pnas.201201198. http://dx.doi.org/10.1073/pnas.201201198. [DOI] [PMC free article] [PubMed] [Google Scholar]
- [14].Choquet D, Felsenfeld DP, Sheetz MP. Extracellular matrix rigidity causes strengthening of integrin-cytoskeleton linkages. Cell. 1997;88:39–48. doi: 10.1016/s0092-8674(00)81856-5. [DOI] [PubMed] [Google Scholar]
- [15].Davies PF, Robotewskyj A, Griem ML. Quantitative studies of endothelial cell adhesion. Directional remodeling of focal adhesion sites in response to flow forces. J Clin Invest. 1994;93:2031–2038. doi: 10.1172/JCI117197. [DOI] [PMC free article] [PubMed] [Google Scholar]
- [16].Delano-Ayari H, Kurdi RA, Vallade M, Gulino-Debrac D, Riveline D. Membrane and acto-myosin tension promote clustering of adhesion proteins. Proc Natl Acad Sci USA. 2004;101:2229–2234. doi: 10.1073/pnas.0304297101. [DOI] [PMC free article] [PubMed] [Google Scholar]
- [17].Shemesh T, Geiger B, Bershadsky AD, Kozlov MM. Focal adhesions as mechanosensors:a physical mechanism. Proc Natl Acad Sci USA. 2005;102:12383–12388. doi: 10.1073/pnas.0500254102. http://dx.doi.org/10.1073/pnas.0500254102. [DOI] [PMC free article] [PubMed] [Google Scholar]
- [18].Besser A, Safran SA. Force-induced adsorption and anisotropic growth of focal adhesions. Biophys J. 2006;90:3469–3484. doi: 10.1529/biophysj.105.074377. http://dx.doi.org/10.1529/biophysj.105.074377. [DOI] [PMC free article] [PubMed] [Google Scholar]
- [19].Nicolas A, Geiger B, Safran SA. Cell mechanosensitivity controls the anisotropy of focal adhesions. Proc Natl Acad Sci USA. 2004;101:12520–12525. doi: 10.1073/pnas.0403539101. http://dx.doi.org/10.1073/pnas.0403539101. [DOI] [PMC free article] [PubMed] [Google Scholar]
- [20].Nicolas A, Safran SA. Limitation of cell adhesion by the elasticity of the extracellular matrix. Biophys J. 2006;91:61–73. doi: 10.1529/biophysj.105.077115. http://dx.doi.org/10.1529/biophysj.105.077115. [DOI] [PMC free article] [PubMed] [Google Scholar]
- [21].Aroush DR, Wagner HD. Shear-Stress Profile along a Cell Focal Adhesion. Adv Mater. 2006;18:1537–154. [Google Scholar]
- [22].Hersel U, Dahmen C, Kessler H. RGD modified polymers: biomaterials for stimulated cell adhesion and beyond. Biomaterials. 2003;24:4385–4415. doi: 10.1016/s0142-9612(03)00343-0. [DOI] [PubMed] [Google Scholar]
- [23].Arnold M, Cavalcanti-Adam EA, Glass R, Blummel J, Eck W, Kantlehner M, Kessler H, Spatz JP. Activation of integrin function by nanopatterned adhesive interfaces. Chemphyschem. 2004;5:383–388. doi: 10.1002/cphc.200301014. [DOI] [PubMed] [Google Scholar]
- [24].Cavalcanti-Adam EA, Volberg T, Micoulet A, Kessler H, Geiger B, Spatz JP. Cell spreading and focal adhesion dynamics are regulated by spacing of integrin ligands. Biophysical Journal. 2007;92:2964–74. doi: 10.1529/biophysj.106.089730. [DOI] [PMC free article] [PubMed] [Google Scholar]
- [25].Discher DE, Janmey P, Wang YL. Tissue cells feel and respond to the stiffness of their substrate. Science. 2005;310:1139–1143. doi: 10.1126/science.1116995. [DOI] [PubMed] [Google Scholar]
- [26].Ulmer J, Geiger B, Spatz JP. Force-Induced Fibronectin Fibrillogenesis In Vitro. Soft Matter. 2008;4:1998–2007. [Google Scholar]
- [27].Geiger B, Spatz JP, Bershadsky AD. Environmental sensing through focal adhesions. Nature Reviews Molecular Cell Biology. 2008;10:21–33. doi: 10.1038/nrm2593. [DOI] [PubMed] [Google Scholar]
- [28].Janmey PA, Winer JP, Murray ME, Wen Q. The hard life of soft cells. Cell Motility and the Cytoskeleton. 2009;66:597–605. doi: 10.1002/cm.20382. [DOI] [PMC free article] [PubMed] [Google Scholar]
- [29].Bao G, Suresh S. Cell and molecular mechanics of biological materials. Nat Mater. 2003;2:715–725. doi: 10.1038/nmat1001. S. http://dx.doi.org/10.1038/nmat1001. [DOI] [PubMed] [Google Scholar]
- [30].du Roure O, Saez A, Buguin A, Austin RH, Chavrier P, Silberzan P, Siberzan P, Ladoux B. Force mapping in epithelial cell migration. Proc Natl Acad Sci USA. 2005;102:2390–2395. doi: 10.1073/pnas.0408482102. http://dx.doi.org/10.1073/pnas.0408482102. [DOI] [PMC free article] [PubMed] [Google Scholar]
- [31].Roos W, Ulmer J, Gräter S, Surrey T, Spatz JP. Microtubule gliding and cross-linked microtubule networks on micropillar interfaces. Nano Lett. 2005;5:2630–2634. doi: 10.1021/nl051865j. http://dx.doi.org/10.1021/nl051865j. [DOI] [PubMed] [Google Scholar]
- [32].Thvenaz P, Ruttimann U, Unser M. A pyramid approach to subpixel registration based on intensity. IEEE Transactions on Image Processing. 1998;7:27–41. doi: 10.1109/83.650848. [DOI] [PubMed] [Google Scholar]
- [33].Zaidel-Bar R, Kam Z, Geiger B. Polarized downregulation of the paxillinp130CAS-Rac1 pathway induced by shear flow. J Cell Sci. 2005;118:3997–4007. doi: 10.1242/jcs.02523. http://dx.doi.org/10.1242/jcs.02523. [DOI] [PubMed] [Google Scholar]
- [34].Sniadecki NJ, Anguelouch A, Yang MT, Lamb CM, Liu Z, Kirschner SB, Liu Y, Reich DH, Chen CS. Magnetic microposts as an approach to apply forces to living cells. PNAS. 2007;104:14553–14558. doi: 10.1073/pnas.0611613104. doi:10.1073/pnas.0611613104. [DOI] [PMC free article] [PubMed] [Google Scholar]
- [35].Paul R, Heil P, Spatz JP, Schwarz US. Propagation of mechanical stress through the actin cytoskeleton toward focal adhesions: model and experiment. Biophys J. 2008;94:1470–1482. doi: 10.1529/biophysj.107.108688. http://dx.doi.org/10.1529/biophysj.107.108688. [DOI] [PMC free article] [PubMed] [Google Scholar]
Associated Data
This section collects any data citations, data availability statements, or supplementary materials included in this article.