

Abstract
We describe the use of catalytically self-propelled microjets (dubbed micromotors) for degrading organic pollutants in water via the Fenton oxidation process. The tubular micromotors are composed of rolled-up functional nanomembranes consisting of Fe/Pt bilayers. The micromotors contain double functionality within their architecture, i.e., the inner Pt for the self-propulsion and the outer Fe for the in situ generation of ferrous ions boosting the remediation of contaminated water.The degradation of organic pollutants takes place in the presence of hydrogen peroxide, which acts as a reagent for the Fenton reaction and as main fuel to propel the micromotors. Factors influencing the efficiency of the Fenton oxidation process, including thickness of the Fe layer, pH, and concentration of hydrogen peroxide, are investigated. The ability of these catalytically self-propelled micromotors to improve intermixing in liquids results in the removal of organic pollutants ca. 12 times faster than when the Fenton oxidation process is carried out without catalytically active micromotors. The enhanced reaction–diffusion provided by micromotors has been theoretically modeled. The synergy between the internal and external functionalities of the micromotors, without the need of further functionalization, results into an enhanced degradation of nonbiodegradable and dangerous organic pollutants at small-scale environments and holds considerable promise for the remediation of contaminated water.
Keywords: catalytic micromotors, bubble propulsion, water remediation, Fenton reaction, micromixing, nanomotors
Contamination of water with nonbiodegradable and dangerous organic compounds is a major global environmental problem mainly caused by human activities. Organic pollutants are commonly found in industrial wastewaters and often cannot be processed efficiently with biological or chemical conventional treatments (chlorination, ozonation, coagulation, etc.). Currently, the rapid and recent advances in nanotechnology have increased the interest of finding useful nanomaterials and nanotools for environmental applications and for water remediation in particular.1
The Fenton method is one of the most popular advanced oxidation processes (AOP), which are effective alternatives to conventional treatments for the degradation of organic pollutants,2,3 and nowadays it is still a topic of numerous investigations.4−8 Commonly, AOP including Fenton reactions utilize the hydroxyl radical (HO•, 2.8 V vs normal hydrogen electrode), which is a powerful nonselective oxidant, as their main oxidizing agent. The generation of HO• in the Fenton method occurs by reaction of H2O2 in the presence of Fe(II) (see eq 1).
| 1 |
Fe (II) is regenerated in the catalytic cycle from the so-called Fenton-like reaction (see eq 2), and consequently only a small catalytic amount of Fe(II) is required.3 In addition, other significant reactions also occur in Fe(II)/Fe(III)/H2O2 mixtures (eqs 3–6).9
| 2 |
| 3 |
| 4 |
| 5 |
| 6 |
The effectiveness of Fenton processes has been demonstrated in several environmental applications.10,11 In the standard industrial methodology with real wastewaters, the Fenton method is coupled to processes such as coagulation, membrane filtration, and biological oxidation to degrade organics to a much larger extent.3 However, one disadvantage of these processes is that Fe ions in solution must be removed after the treatment to meet regulations for drinking water.12 In order to diminish and, in the best scenario, solve the problems caused by the presence of Fe ions in treated effluents and decrease the costs of recovery, the use of heterogeneous Fenton catalysts is a promising strategy that could allow the degradation of pollutants by Fenton processes without the requirement of dissolved iron salts.13 Among the different approaches, the utilization of zero-valence metallic iron materials has been proven as an alternative method to achieve degradation of organic pollutants in aqueous solutions.14,15 We propose the coupling of self-propelled metallic micromotors and Fenton reactions for enhanced water remediation.
Nano- and micromotors are in the forefront of nanotechnology, providing several examples of applications, ranging from the pumping of fluids at the microscale,16,17 on-chip biosensing,18 targeted transport and delivery of cells19−21 and microparticles,22,23 drilling of cells,24 and tissues25,26 to capture oil from water.27,28
Great efforts have been made to efficiently propel and accurately control micro- and nanomotors by different mechanisms.29−37 Most self-propelled systems are based on the conversion of chemical energy into mechanical motion.38 Nonetheless, there are also other ways to produce self-motion at the micro- and nanoscale, for instance electromagnetic fields,22,39,40 local electrical fields,41 thermal gradients,42,43 photoinduced motion,44−46 or the Marangoni effect.28 This variety of propulsion mechanisms gave rise to a rich diversity of designs of nanomotors such as nanorods,47,48 spherical particles,34,49 microhelices,22,39,40 polymeric capsules,28,50 and tubular microjets.51−53
Tubular microjets containing a Pt catalyst as inner layer are able to catalyze the decomposition of H2O2 into water (H2O) and oxygen (O2), resulting in an O2-bubble propulsion system.51,52 The release of O2 gas from one end of the catalytic microjets in solution reciprocally implies the motion of the fluid that surrounds and fills them, enabling the self-pumping of fluids at the micro/nanoscale. Self-propelled microjets have been fabricated by roll-up nanotechnology of thin films51,52 and later produced in porous templates combined with electrodeposition methods.53 However, in the latter case, parameters such as shape, length, and diameter are limited by the commercially available templates, reducing the versatility in the design of those nanomotors. Differently, roll-up nanotechnology of functional nanomembranes allows a reproducible mass production method54 of micro/nanomotors with custom-made dimensions, flexible in material composition and design. Therefore, it allows the fabrication of either cylindrical or conical tubes29,55 ranging from about 300 nm diameter24,29 to a few tens of micrometers with lengths spanning from 4 μm to 1 mm.17
One special feature of tubular microjets is that both the inner and the outer layers can provide functionalities for different purposes.56,57 For example, the inner layer was selectively functionalized with catalase enzymes for the biocatalytic decomposition of peroxide into oxygen gas, leading to efficient propulsion.57 Also, a similar biofunctionalization concept has been used to capture and isolate biomolecules and droplets.56,58−60 However, the use of the outer layer of catalytic micromotors as active materials, without the need of functionalization, has not been reported so far.
Here, we report the first example of micromotors employed for degrading organic pollutants in water. In this work, rhodamine 6G (Rh6G) is used as a model pollutant of xanthene dyes to study the water remediation efficiency of a Fenton process performed by Fe/Pt-based self-propelled micromotors. The mechanism of degradation is based on Fenton reactions relying on spontaneous acidic corrosion of the iron metal surface of the microtubes in the presence of H2O2, which acts both as a reagent for the Fenton reaction and as main fuel to propel the micromotors. Moreover, the ability of tubular micromotors to improve mixing results in a synergetic effect that enhances the degradation of organic pollutants. We investigated the effect of the components influencing the removal of pollutants: thickness of the outer Fe layer, concentration of H2O2, presence of surfactant, and effect of the platinum layer. We analyzed the evolution of involved reactants (Fe, H2O2 and pH) during the degradation of the pollutant. The enhanced mixing has been experimentally proven and theoretically modeled based on the continuum theory of mixing of the H2O2 solution dragged by an ensemble of microjets.
Results and Discussion
We fabricated tubular bubble-propelled micromotors containing small amounts of metallic iron (from 20 to 200 nm layer thickness) as outer layer and platinum as inner layer, enabling Fenton reactions between iron ions generated in situ and hydrogen peroxide (Figure 1). These iron ions are generated by oxidizing the metallic Fe surface of the tubes in acidic media, in a thermodynamically spontaneous process. Since the optimum reported pH to achieve a classical Fenton reaction is 2–3,4,14 a pH of 2.5 was selected to perform all the reported experiments in the present study.
Figure 1.

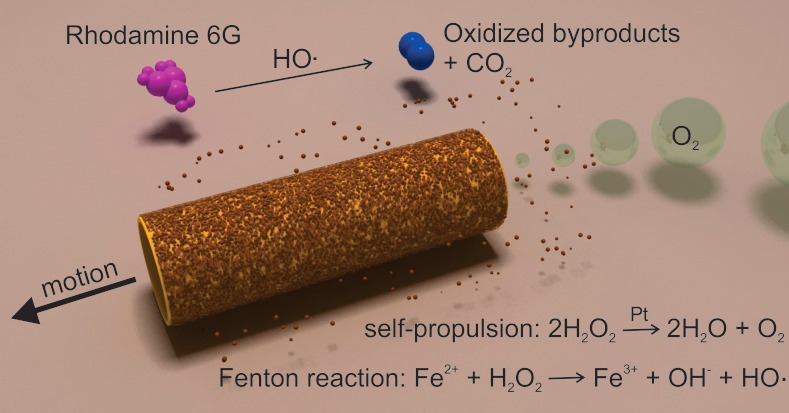
Schematic process for the degradation of polluted water (rhodamine 6G as model contaminant) into inorganic products by multifunctional micromotors. The self-propulsion is achieved by the catalytic inner layer (Pt), which provides the motion of the micromotors in H2O2 solutions. The remediation of polluted water is achieved by the combination of Fe2+ ions with peroxide, generating HO• radicals, which degrade organic pollutants.
To prove the capability of self-propelled micromotors to degrade model pollutants in water, we immersed a suspension of Fe/Pt tubular micromotors in Rh6G solution and quantified spectrophotometrically its degradation over time (for calibration curve see Figure S1 in the SI). A concentration of 15% of H2O2 was systematically used in the experiments, unless otherwise stated. Sodium dodecyl sulfate (SDS) was used as surfactant at a concentration of 0.5 wt % to facilitate bubble ejection from the micromotors. The experimental results plotted in Figure 2 clearly indicate that the presence of Fe/Pt micromotors in the treated liquid improves the degree of oxidation of Rh6G (Figure 2B) compared with the results using Fe microtubes, which do not contain a Pt layer and are hence unable to self-propel (Figure 2A). For instance, a complete removal of Rh6G was achieved after 5 h of treatment using Fe/Pt micromotors with a Fe thickness of 100 nm (Figure 2B, blue plot), but only 32% of Rh6G was oxidized in 5 h using Fe microtubes with the same thickness (Figure 2A, red plot). The initial rates of Rh6G degradation in both experiments were determined to be 12 and 1 mg·L–1·h–1 respectively; that is, a removal of Rh6G takes place ca. 12 times faster when the Fenton oxidation process is carried out with propelling Fe rolled-up micromotors. Therefore, a synergetic effect is achieved taking advantage of the release of the iron ions from the outer layer of the micromotors and their active motion in the solution (see also Video 1 in the SI). Control experiments demonstrate that both H2O2 and Fe together are necessary for the degradation of Rh6G (see eq 1). If one of these components is missing, no oxidation of Rh6G takes place and the concentration of Rh6G stays constant over 5 h (Figure 2, black plots).
Figure 2.

Removal of toxic organic compounds from aqueous solutions with pure iron microtubes (column A) and catalytically active iron/platinum (Fe/Pt) microjets (column B) in hydrogen peroxide solutions. Pink molecules represent rhodamine 6G (Rh6G); the small blue molecules represent oxidized compounds and carbon dioxide as reaction products. Pollutant Rh6G is removed faster when the solution contains active Fe/Pt microjets (column B) than containing nonactive pure iron microtubes (column A). Quantitative comparison of Rh6G degradation by pure iron (Fe) tubes (red triangles) and by catalytically active Fe/Pt tubes (blue diamonds) over 5 h. All samples were prepared at pH 2.5, with Rh6G (C0 = 45 mg/L), 15% H2O2, 0.5% sodium dodecyl sulfate as surfactant, and 441 ± 10 microtubes in a total volume of 1 mL. Controls without H2O2 and without microtubes were added for comparison.
In addition, the evolution of Fe and H2O2 reactants and the pH of the solution during the degradation of the model pollutant were also investigated. The concentration of released Fe ions in the aqueous solution after 5 h of experiment was analyzed by inductively coupled plasma optical emission spectrometry (ICP-OES). The content of Fe was determined to be 1.6 ± 0.5 mg/L (i.e., 10–4 M), which is 1 to 3 orders of magnitude lower than reported in previous works.4,8 The evolution of the concentration of H2O2 was studied by semiquantitative method using MQuant peroxide test strips (see Table 1) with the concentration of remaining H2O2 in the aqueous solution determined to be 5 ± 2%. After 5 h of experiment, the pH value was 2.6, revealing that is possible to work over many hours at the optimal range of pH 2–3 to perform the Fenton reaction.
Table 1. Evolution of the Concentration of H2O2 over an Experiment of Degradation of Rhodamine 6G.
| time (h) | concentration of H2O2 (%) |
|---|---|
| 0 | 15 |
| 1 | 15 |
| 2 | 11 ± 4 |
| 3 | 5 ± 2 |
| 4 | 5 ± 2 |
| 5 | 5 ± 2 |
We performed a series of control experiments to elucidate the effect of all components involved in the enhanced degradation of pollutants by self-propelled micromotors. Although tubular micromotors based on bubble propulsion require the presence of surfactants to reduce the surface tension and help in the stabilization of bubbles,23 in the present approach the addition of surfactants might bring an additional pollutant in the aqueous solution. For this reason, the efficiency of the degradation without surfactant was investigated. As illustrated in Figure S2 (green plot), Fe/Pt micromotors in the absence of surfactant (sodium dodecyl sulfate) were able to oxidize 63% of Rh6G in 5 h, and even a complete removal of the dye was achieved later on. Hence, it is noteworthy that the addition of surfactant is not necessary for upcoming applications wherein the reaction rate is not an important factor for the performance of the desired process.
The influence of the platinum layer by itself on the removal of the dye, apart from its role in the propulsion, was also examined. For this study, the Fe outer layer of the micromotors was replaced by titanium, which is an inert metal unable to produce hydroxyl radicals through Fenton-like reactions.61 Tubular Ti/Pt micromotors were utilized to carry out a control experiment on the degradation of Rh6G under the same conditions as for Fe/Pt micromotors. As illustrated in Figure S2 (pink plot), the platinum inner layer of the micromotors has a slight contribution on the oxidation of Rh6G, leading to a 10% oxidization of dye after 5 h with Ti/Pt micromotors. Rh6G can be adsorbed on platinum surfaces;62 thus its partial oxidation can be explained by a mechanism of the decomposition of H2O2 already described, as follows.63−65 In the presence of a platinum surface, H2O2 undergoes decomposition into H2O and O2 involving the adsorption of hydroxyl radicals on platinum, forming Pt–OHads species. Once such Pt–OHads species are formed, they can also react with both free and adsorbed organic molecules,66,67 yielding a slight but noticeable oxidation of Rh6G under our experimental conditions.
The use of an external Fe surface as active material of catalytic micromotors, without the need of further functionalization, results in a synergy between the internal and external functionalities of the micromotors. In the present work, we take advantage of the motion given by the generation of O2-bubbles in the internal Pt layer combined with the useful function of the external Fe that enables the degradation of organic pollutants. Because of the possible corrosion of the Fe material, optimization of the thickness of the outer Fe layer seems to be crucial for an efficient and long-standing Fenton reaction. Initially, we fabricated rolled-up tubes from very thin layers (5 nm thickness of Fe) and lengths of 50 μm but did not observe any substantial degradation of Rh6G. Hence, we decided to design tubes with a larger surface area that could accommodate a large range of Fe layer thicknesses. This modification in design comprised only a modification in the pattern structure to be rolled-up, which is not possible with other fabrication techniques. We fabricated tubes 500 μm in length, which allows the deposition of Fe layers up to 200 nm while keeping an aspect ratio diameter/length around 1:10, enabling good rolling up of the thin layers into tubes and active motion of the catalytic micromotors.
Only about 20% and 32% Rh6G was removed after 6 h using micromotors with 20 and 50 nm of Fe thickness (Figure 3A, red and blue plots, respectively). A significant increase in the removal up to about 88% Rh6G was achieved after 6 h of treatment using micromotors with an iron thickness of 100 nm on the outer layer (Figure 3A, pink plot). We further fabricated tubes with thicker layers of Fe (120, 150, and 200 nm), but those micromotors did not provide significant faster or further degradation of organic pollutants (Figure 3A, green, navy blue, and violet plots, respectively). Consequently, we chose tubes containing 100 nm Fe as optimum for the Fenton degradation of model pollutants in water. From the experimental results plotted in Figure 3A, one can conclude that the larger the Fe thickness, the faster the oxidation of Rh6G. However, further increase of the iron layer thicker than 100 nm did not show significant improvement of degradation rate. The resulting tubular micromotors were characterized by scanning electron microscopy (SEM) before and after the Fenton process. Figure 3B depicts SEM images of the Fe/Pt micromotors before the Fenton process. From the SEM image (Figure 3B) a smooth and uniform surface is observed. Moreover, pitting corrosion of the Fe outer layer was observed on tubes after the Fenton reaction, as shown in Figure 3C, where several nanopits were detected in the tube walls. In aqueous acidic media, pits can occur and grow during the active dissolution of the Fe surface of the micromotors if certain regions of the Fe layer are more susceptible and dissolve faster than the rest of the surface, commonly due to the presence of defects in the surface of the microstructure.68 This pitting corrosion of the iron layer is expected to play an important role in achieving an accelerated in situ generation of ferrous ions.68
Figure 3.

Optimization of Fe thickness for efficient pollutant degradation using Fe/Pt micromotors. (A) Rhodamine 6G degradation over time with self-propelled micromotors containing different Fe thickness, i.e., from 20 to 200 nm, and constant Pt thickness at 1 nm. Each sample contained a 2 mL solution at pH 2.5 with Rh6G (C0 = 100 mg/L), 5% H2O2, 1% SDS, and 882 ± 10 microtubes. The control sample was carried out under equal conditions omitting micromotors. Inset: Actively moving Fe/Pt micromotors in Rh6G solution. Scale bar: 250 μm. (B) SEM images of Fe tubes with 100 nm Fe thickness before Fenton reaction and (C) after 20 h of Fenton reaction. The blue triangles indicate the position of nanopits in tube walls.
The effect of hydrogen peroxide concentration on Rh6G degradation using Fe/Pt micromotors was also explored (Figure 4). The obtained results, shown in Figure 4, proved that the initial rate of degradation of Rh6G increases with the concentration of H2O2 in the solution. Therefore, increasing the dosage of H2O2 allows the micromotors to move faster and, consequently, the mass transfer of the reagents involved in the Fenton process is improved due to mixing. In addition, a higher amount of H2O2 also permits a faster Fenton oxidation process, since the in situ generated ferrous ions can react immediately with H2O2 to produce HO• and achieve the oxidation of Rh6G. However, the initial degradation rate of pollutants reaches a plateau at 15% H2O2, which corresponds to the saturation typically observed for the speed of microjets with increasing fuel concentration.23
Figure 4.
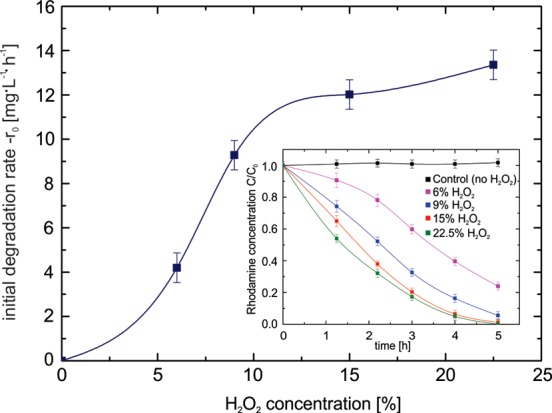
Effect of the concentration of hydrogen peroxide on the oxidation of rhodamine 6G. The main plot illustrates the initial rates of oxidation of Rh6G using different concentrations H2O2. Inset shows the oxidation of Rh6G over time using Fe/Pt micromotors with increasing H2O2 concentration over time. All samples were prepared with Rh6G (C0 = 44 mg/L) and 1% SDS.
We studied the performance, i.e., self-propulsion, of the micromotors over four hours, as illustrated in Figure 5. We observed that the micromotors are active over long periods of time when the chemical degradation takes place. Figure 5 shows that 500 μm micromotors are active for at least 4 h (see also Videos 2–4 in the SI). Moreover, the tubes mix the fluid vigorously, inducing a convection flow that efficiently diffuses molecules of dye, ions, and radicals enhancing the fast degradation of Rh6G. The mixing of treated liquids is improved not only by the movement of the micromotors in the aqueous solution but also by the continuous generation of bubbles originated in the catalytic reaction in the interior of the microtubes. Their release can provoke mixing along the z-plane. A sample containing active Fe/Pt micromotors attached to a glass wafer and immersed in the same conditions as previous experiments showed that 49% of Rh6G was oxidized in 5 h with an initial rate of 3 mg·L–1·h–1 (Figure S2, purple plot). The motion of those catalytic microtubes was hindered because they were fixed on the chip; however, they continuously generated bubbles that moved up to the surface of the liquid. Thus, the bubble generation from the fixed microtubes is not enough to accelerate the Fenton reaction as efficiently as the swimming Fe/Pt micromotors (Figure 2B, blue plot). These results are not surprising, since the movement of micromotors in liquids occurs in x–y–z directions,24,52 and in addition they bring the reactive iron ions in close contact with the Rh6G molecules.
Figure 5.

Motion of Fe/Pt micromotors versus time: Fe 100 nm/Pt 1 nm Fenton micromotors, scale bar 125 μm. The experiment was prepared at pH 2.5, with Rh6G (C0 = 45 mg/L), 5% H2O2, 1% SDS, and micromotors in a total volume of 2 mL.
The mixing effect of large microtubes is depicted in Figure 6. The micromotors have two key features that enhance mixing: (i) the generation of bubbles and (ii) the fluid flow through and around the microtubular motor. Figure 6 reveals the mixing effects of micromotors at the macro- and microscale. The different distributions of black ink in a 1 mL solution without (Figure 6A, left panels) and with catalytic tubes (Figure 6A, right panels) illustrate the enhanced mixing on the macroscale over 17 min. Each beaker contains a solution of 6% H2O2 and 1% surfactant with 10 μL of ink. In the control experiment mixing of ink and solution occurs solely due to diffusion of the ink particles under Brownian motion. However, in the solution containing catalytic micromotors, the ink was spread out faster and over a larger area than in the control experiments, due to turbulences caused by bubbling catalytic tubes. Our results are in agreement with the findings of Zhao etal.,69 who found enhanced diffusion coefficients during dissolution of pollutants in water due to the presence of self-propelled macroscopic particles. Furthermore, the direct surrounding of the tubular micromotor is affected, as shown in Figure 6B. Figure 6B illustrates trajectories of fluorescent particles (visible as white dots) near the nozzle outlet over a time frame of 3.3 s. Fluorescent particles are clearly accelerated in the zone of influence of the micromotor (see video S5 in the SI), and the tracked trajectories of fluorescent particles appear to be longer than those susceptible only to Brownian motion (see Video S6 in the SI). Insets in Figure 6B and C highlight trajectories of three selected particles, indicating that the actively bubbling tubes lead to a fast mixing and distribution of reagents within the solution. It is important to note that ink and particles have different diffusion coefficients than Rh6G. Therefore, Figure 6 serves only as a qualitative illustration and not as a quantitative analysis of the improved mixing by micromotors in Fenton reactions.
Figure 6.

Mixing with self-propelled micromotors. (A) Improved mixing of solutions on the macroscopic scale over time. (Left) Control solutions without micromotors and catalytic Fe/Pt micromotors (right) containing a sample with ca. 400 actively moving microtubes (Fe 100 nm/Pt 1 nm). All beakers contain 3 mL of solution (6% H2O2, 1% SDS, and 10 μL of black ink as dye to visualize diffusion). (B) Trajectories (colored lines) of 3 μm diameter green fluorescing particles near a tube opening of a 500 μm Fe/Pt micromotor over 3.3 s. (C) Control experiment with trajectories (colored lines) of the same sized fluorescing microparticles without microtubes as micromixers. In B and C, a total volume of 200 μL contained 1.5% H2O2 with 0.5% SDS and 10 μL of 3 μm green fluorescing microparticles. Scale bar is 100 μm. Insets B and C show representative trajectories of three particles for each corresponding case.
These results indicate that the active mixing component of the self-propelled micromotors, the amount of Fe contained at the surface or the multifunctional micromotors, and a proper concentration of hydrogen peroxide are well suited for enhancing the efficiency of the degradation of pollutants in contaminated solutions.
Mixing of the peroxide solution in the reaction vessel due to the propulsion of microjets is modeled using the stationary continuity equation for fluid dynamics (ref (70), eq 2-1.1):
| 7 |
where the mass flux density is defined as a product of the local concentration c(r) and local fluid velocity v(r):
| 8 |
The process of mixing along the vertical z-axis can be modeled by assuming that the concentration is a function of the z-coordinate only, while the z-component of the velocity is an average over an ensemble of microjets with different coordinates (x,y) in the horizontal plane over all area in the Petri dish, which is accessible to the moving microjets:
 |
9 |
Then the continuity equation (eq 7)
| 10 |
after integration over the vertical coordinate from a point z to the top of the fluid in the Petri dish (Lfluid) gives
| 11 |
With the diameter of the Petri dish D = 30 mm and the volume of the fluid V = 1 mL, the height of the fluid in the Petri dish is Lfluid = 1.41 mm.
Investigation of the velocity profile v(r) of a viscous fluid dragged by a moving microjet constitutes a separate hydrodynamic problem, which is beyond the scope of the present paper. Here we use a standard approximation: when analyzing motion in a viscous fluid, elongated orthotropic bodies can be represented by prolate ellipsoids of revolution (ref (70), p 222). The flow of a viscous fluid dragged by an ellipsoid (in our calculation, the axes of the ellipsoid are equal to diameter 2R = 120 μm and length L = 500 μm of the microjet) moving with velocity vjet (according to the experimental data, vjet = 538 μm/s) is described employing the Navier–Stokes equation (see ref (70), Chapter 4, and references therein). The solutions are obtained using two assumptions: (i) low-Reynolds-number regime and (ii) no-slip boundary conditions at the surface of the body. These results provide a generalization of the well-known Stokes’ law of resistance onto a fluid flow past a nonspherical body (ref (70), pp 145–149). Because of the large diameter of the Petri dish compared to the sizes of a model microjet, the effects of the walls on the fluid velocity field are negligible.
The average z-components of the fluid velocity are estimated for model microjets centered at the half-height of the fluid in the vertical direction (0.5Lfluid) and moving at various values of the angle Ψ between the microjet velocity vjet and the vertical z-axis. In Figure 7A they are plotted as a function of the coordinate z together with the average over an ensemble of microjets with different values of angle Ψ from 0 to 90°. The corresponding profiles of the peroxide concentration calculated according to eq 11 are represented in Figure 7B.
Figure 7.
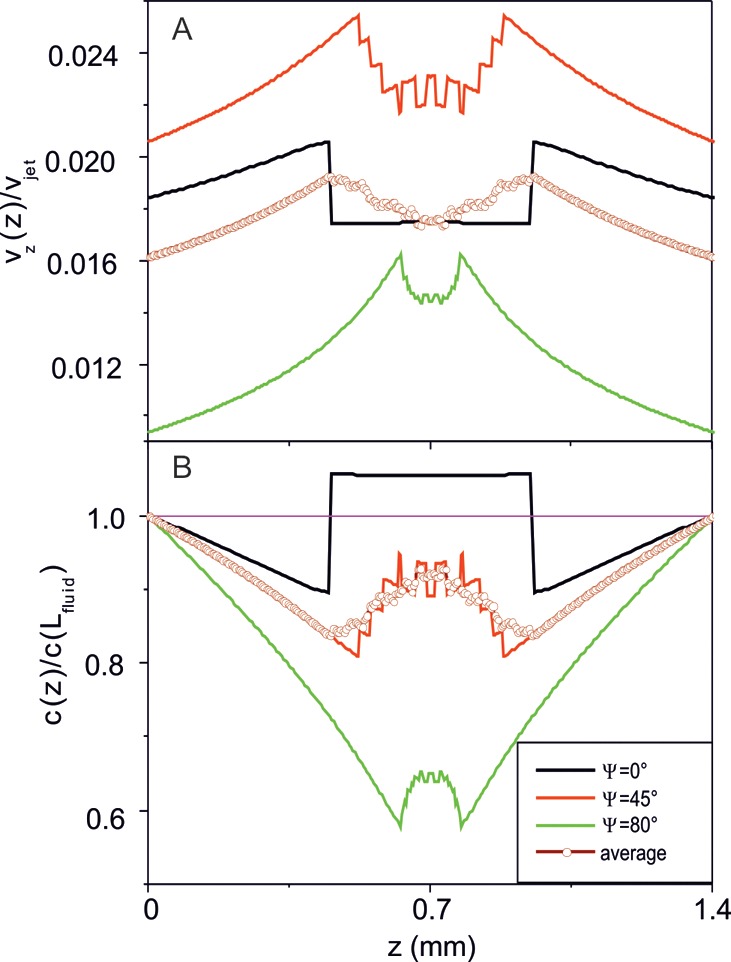
Average z-component of the fluid velocity related to the microjet velocity (A) and the peroxide concentration related to its undisturbed value far away from the moving microjet (B) calculated as a function of the vertical coordinate z for model microjets centered at the half-height of the fluid in the vertical direction (0.5 × Lfluid). The values of the angle Ψ between the microjet velocity vjet and the vertical z-axis are given in the inset. The results averaged over an ensemble of microjets with different values of the angle Ψ are represented with open circles. The pink thin line in panel (B) represents the undisturbed value of peroxide concentration far away from the moving microjet. Calculation parameters are given in the text.
The average z-component of the fluid velocity reaches its maximum values at the front and rear points of the moving microjet, where the absolute value of the total fluid velocity is vjet due to the nonslip boundary condition. These points are separated by a distance equal to the size of the projection of the microjet onto the vertical axis. This is clearly seen in Figure 7A: the distance between the local maxima of the average z-component of the fluid velocity is the largest for Ψ = 0 and monotonously decreases with increasing Ψ. Averaging over an ensemble of microjets with different values of angle Ψ results in a significantly broadened profile of the z-component of the fluid velocity with maxima close to those at Ψ = 45°. The average z-component of the fluid velocity reaches its largest values at intermediate angles Ψ ≈ 45°, because in this case contributions to the z-component of the fluid velocity are gathered optimally from the total surface of the microjet, which propels inclined with respect to the vertical axis. However, averaging over an ensemble of microjets with different values of angle Ψ provides the z-component of the fluid velocity of the same order of magnitude as that for vertically moving microjets (Ψ = 0).
Within the present model, mixing of the peroxide occurs due to the following physical reason: In order to keep the mass flux density along the vertical axis constant, as implied by eq 10, the peroxide concentration must be an inverse function of the average z-component of the velocity (eq 11). As shown in Figure 7B, the peroxide concentration profile has minima just in the regions at the front and rear points of the moving microjet, where the average z-component of the fluid velocity reaches its maximal values. Accordingly, there occurs a redistribution of the peroxide concentration in the vicinity of the microjet, which decays far away from it. The highest modulation of the peroxide concentration (∼20%) is due to the vertical propulsion of microjets (Ψ = 0). Averaging over an ensemble of microjets with different values of the angle Ψ smears the profile of the peroxide concentration and provides the modulation on the order of 10%.
It is worth emphasizing that the region of rearrangement of the peroxide concentration moves in space together with propelling microjets. Therefore the drag of the solution due to the propulsion of microjets is an effective mechanism of mixing peroxide in the reaction vessel.
Conclusions
We have demonstrated the ability of self-propelled micromotors to oxidize organic pollutants in aqueous solutions through a Fenton process. The combination of mixing and releasing iron ions in liquids results in a rate of removal of rhodamine 6G ca. 12 times higher than when the Fenton oxidation process is carried out with nonpropelling Fe rolled-up tubes. Consequently, Fe/Pt micromotors boost the Fenton oxidation process without applying external energy, and complete degradation of organic pollutants could be achieved. Advantageously, if desired, the micromotors can be easily recovered using a magnet once the water purification process has been completed and the excess of hydrogen peroxide can be easily decomposed to pure water and oxygen under visible light. Moreover, with this method, the remaining iron in the solution is 1 to 3 orders of magnitude lower than in conventional Fenton processes. The high efficiency of the oxidation of organic pollutants achieved by the Fe/Pt catalytic micromotors reported here is of importance for the design of new and faster water treatments, such as the decontamination of organic compounds in wastewaters and industrial effluents. Additionally, we have proven that the usefulness of the micromotors lies in their capacity not only to move but to exploit their motion using their external surface to enhance useful catalytic reactions. This work might pave the way for the use of multifunctional micromotors for environmental applications where the use of H2O2 is not a major drawback but a co-reagent.
Methods
Fabrication of Microjets
Microjets for the Fenton reaction experiments were fabricated by rolling up thin films of evaporated metals. Glass wafers 18 × 18 mm in size were cleaned with acetone and 2-propanol by sonication for 2 min in each solvent. The glass wafers were dried and baked at 120 °C for 2 min. Coating with positive photoresist ARP-3510 was carried out on a spin-coater at 3500 rpm for 35 s. The samples were postbaked at 90 °C for 3 min. Exposure to ultraviolet light through a mask of 500 × 500 μm squared structures for 7 s with a Karl Suss MA56 mask aligner leads to photolithographic patterning of the photoresist. The samples are developed in AR 300-35/water (1:1) solution for 50 s and dried subsequently. Metal evaporation of 50 nm iron at two different rates (3 Å/s, 0.5 Å/s) is conducted on each of these patterned wafers using an Edwards e-beam. The deposition of 100 nm Fe is carried out at an angle of 75°. In order to fabricate catalytically active tubes, sputtering of 1 nm of platinum is performed by using magnetron sputtering. The sacrificial photoresist layer is removed by immersing the glass wafers in a mixture of dimethyl sulfoxide/acetone (1:1). The Fe/Pt nanomembranes roll up immediately into microtubes of 500 μm length and about 40 μm in diameter (see Figure S3 in the SI).
Fenton Reaction
Rh6G degradation experiments were performed in a glass Petri dish (diameter 30 mm, height 10 mm) containing 1 mL of solution at initial pH = 2.5, adjusting the pH with HCl, with Rh6G (C0 = 45 mg/L), 15% H2O2, 0.5% sodium dodecyl sulfate as surfactant, and 1 wafer of Fe/Pt microtubes (441 ± 10 microtubes). The degradation experiments were carried out under standard conditions (298 K and 1 atm). All the experiments were performed under the regular conditions above-described unless otherwise stated.
Analysis of Rhodamine 6G
Rhodamine 6G was weighed and dissolved in water to a concentration of ca. 45 mg/L. A dilution series of different rhodamine concentrations from 0 to 75 mg/L was made to calibrate the concentration with the absorption at 550 nm of an MP96 spectrophotometer accordingly (see Figure S1 in the SI). All spectrophotometric measurements were carried out in a 96-well plate, using 100 μL of solution in each analysis. Initial degradation rates were determined by calculating the negative of the slope of the curves of concentration of Rh6G versus time at the start of the reaction (i.e., t = 0).
Analysis of Fenton Reactants
The pH in the aqueous solutions was measured with a pH meter (microprocessor pH meter 211, Hanna Instruments). The total Fe concentration in solution was analyzed using an ICP-OES (IRIS Intrepid II, Thermo Scientific). H2O2 analysis was performed using peroxide colorimetric test strips (Mquant peroxide colorimetric test strips, Merck Millipore).
Recording and Analysis of Videos
A Zeiss Axio microscope with high-speed camera was used to record videos of actively moving tubes in rhodamine solution at a rate of 60 frames per second. The free software FiJi was used to track particle speed and edit videos and pictures. Scanning electron microscopic pictures were taken with a Zeiss SEM/FIB scanning electron microscope.
Theoretical Analysis of Mixing
For analysis of the spatial distribution of the H2O2 concentration, the continuity equation was solved analytically after averaging the fluid velocity over the in-plane coordinate as well as over the angle between the axis of the microjet and the vertical axis of the Petri dish. The pattern of the fluid velocity around a moving microjet was modeled by the solution of the hydrodynamic Navier–Stokes equations for a prolate ellipsoid moving at small Reynolds numbers in a viscous fluid.
Acknowledgments
The research leading to these results has received funding from the European Research Council under the European Union’s Seventh Framework Programme (FP7/2007–2013)/ERC grant agreement [no. 311529] and the Volkswagen Foundation [no. 86 362]. The authors thank C. Krien, R. Engelhard, and A. Voß for technical support, S. M. Harazim for help with SEM, R. Träger for schematics, and D. Grimm, S. Sieber, S. Seifert, M. Bauer, and D. Kantor for clean room support. L.S. and S.S. thank J. Casado and M. Tasinkevych for fruitful discussions.
Supporting Information Available
Additional figures and videos. This material is available free of charge via the Internet at http://pubs.acs.org.
The authors declare no competing financial interest.
Supplementary Material
References
- Khin M. M.; Nair A. S.; Babu V. J.; Murugan R.; Ramakrishna S. A Review on Nanomaterials for Environmental Remediation. Energy Environ. Sci. 2012, 5, 8075–8109. [Google Scholar]
- Andreozzi R.; Caprio V.; Insola A.; Marotta R. Advanced Oxidation Processes (AOP) for Water Purification and Recovery. Catal. Today 1999, 53, 51–59. [Google Scholar]
- Brillas E.; Sires I.; Oturan M. A. Electro-Fenton Process and Related Electrochemical Technologies Based on Fenton’s Reaction Chemistry. Chem. Rev. 2009, 109, 6570–6631. [DOI] [PubMed] [Google Scholar]
- Venny; Gan S. Y.; Ng N. K. Current Status and Prospects of Fenton Oxidation for the Decontamination of Persistent Organic Pollutants (POPs) in Soils. Chem. Eng. J. 2012, 213, 295–317. [Google Scholar]
- Hartmann M.; Kullmann S.; Keller H. Wastewater Treatment with Heterogeneous Fenton-Type Catalysts Based on Porous Materials. J. Mater. Chem. 2010, 20, 9002–9017. [Google Scholar]
- Martin R.; Alvaro M.; Herance J. R.; Garcia H. Fenton-Treated Functionalized Diamond Nanoparticles as Gene Delivery System. ACS Nano 2010, 4, 65–74. [DOI] [PubMed] [Google Scholar]
- Zhou X. J.; Zhang Y.; Wang C.; Wu X. C.; Yang Y. Q.; Zheng B.; Wu H. X.; Guo S. W.; Zhang J. Y. Photo-Fenton Reaction of Graphene Oxide: A New Strategy to Prepare Graphene Quantum Dots for DNA Cleavage. ACS Nano 2012, 6, 6592–6599. [DOI] [PubMed] [Google Scholar]
- Nidheesh P.; Gandhimathi R.; Ramesh S. Degradation of Dyes from Aqueous Solution by Fenton Processes: a Review. Environ. Sci. Pollut. Res. 2013, 20, 2099–2132. [DOI] [PubMed] [Google Scholar]
- Soler L.; Macanas J.; Munoz M.; Casado J. Electrocatalytic Production of Hydrogen Boosted by Organic Pollutants and Visible Light. Int. J. Hydrogen Energy 2006, 31, 129–139. [Google Scholar]
- Pignatello J. J. Dark and Photoassisted Fe3+-Catalyzed Degradation of Chlorophenoxy Herbicides by Hydrogen-Peroxide. Environ. Sci. Technol. 1992, 26, 944–951. [Google Scholar]
- Perez M.; Torrades F.; Domenech X.; Peral J. Fenton and Photo-Fenton Oxidation of Textile Effluents. Water Res. 2002, 36, 2703–2710. [DOI] [PubMed] [Google Scholar]
- Bundesministerium der Justiz. Verordnung über die Qualität von Wasser für den Menschlichen Gebrauch. Trinkwasserverordnung. In Anlage 3 (zu § 7 und § 14 Absatz 3). Indikatorparameter; Deutschland, 2011; Vol. BGBI. I, pp 2388–2390. [Google Scholar]
- Navalon S.; Alvaro M.; Garcia H. Heterogeneous Fenton Catalysts Based on Clays, Silicas and Zeolites. Appl. Catal., B 2010, 99, 1–26. [Google Scholar]
- Namkung K. C.; Burgess A. E.; Bremner D. H. A Fenton-Like Oxidation Process Using Corrosion of Iron Metal Sheet Surfaces in the Presence of Hydrogen Peroxide: A Batch Process Study Using Model Pollutants. Environ. Technol. 2005, 26, 341–352. [DOI] [PubMed] [Google Scholar]
- Hou M. F.; Liao L.; Zhang W. D.; Tang X. Y.; Wan H. F.; Yin G. C. Degradation of Rhodamine B by Fe(0)-Based Fenton Process with H2O2. Chemosphere 2011, 83, 1279–1283. [DOI] [PubMed] [Google Scholar]
- Kline T. R.; Paxton W. F.; Wang Y.; Velegol D.; Mallouk T. E.; Sen A. Catalytic Micropumps: Microscopic Convective Fluid Flow and Pattern Formation. J. Am. Chem. Soc. 2005, 127, 17150–17151. [DOI] [PubMed] [Google Scholar]
- Solovev A. A.; Sanchez S.; Mei Y. F.; Schmidt O. G. Tunable Catalytic Tubular Micro-Pumps Operating at Low Concentrations of Hydrogen Peroxide. Phys. Chem. Chem. Phys. 2011, 13, 10131–10135. [DOI] [PubMed] [Google Scholar]
- Garcia M.; Orozco J.; Guix M.; Gao W.; Sattayasamitsathit S.; Escarpa A.; Merkoci A.; Wang J. Micromotor-Based Lab-on-Chip Immunoassays. Nanoscale 2013, 5, 1325–1331. [DOI] [PubMed] [Google Scholar]
- Sanchez S.; Solovev A. A.; Schulze S.; Schmidt O. G. Controlled Manipulation of Multiple Cells Using Catalytic Microbots. Chem. Commun. (Cambridge U.K.) 2011, 47, 698–700. [DOI] [PubMed] [Google Scholar]
- Balasubramanian S.; Kagan D.; Hu C. M. J.; Campuzano S.; Lobo-Castanon M. J.; Lim N.; Kang D. Y.; Zimmerman M.; Zhang L. F.; Wang J. Micromachine-Enabled Capture and Isolation of Cancer Cells in Complex Media. Angew. Chem., Int. Ed. 2011, 50, 4161–4164. [DOI] [PMC free article] [PubMed] [Google Scholar]
- Patra D.; Sengupta S.; Duan W. T.; Zhang H.; Pavlick R.; Sen A. Intelligent, Self-Powered, Drug Delivery Systems. Nanoscale 2013, 5, 1273–1283. [DOI] [PubMed] [Google Scholar]
- Tottori S.; Zhang L.; Qiu F. M.; Krawczyk K. K.; Franco-Obregon A.; Nelson B. J. Magnetic Helical Micromachines: Fabrication, Controlled Swimming, and Cargo Transport. Adv. Mater. (Weinheim, Ger.) 2012, 24, 811–816. [DOI] [PubMed] [Google Scholar]
- Solovev A. A.; Sanchez S.; Pumera M.; Mei Y. F.; Schmidt O. G. Magnetic Control of Tubular Catalytic Microbots for the Transport, Assembly, and Delivery of Micro-objects. Adv. Funct. Mater. 2010, 20, 2430–2435. [Google Scholar]
- Solovev A. A.; Xi W.; Gracias D. H.; Harazim S. M.; Deneke C.; Sanchez S.; Schmidt O. G. Self-Propelled Nanotools. ACS Nano 2012, 6, 1751–1756. [DOI] [PubMed] [Google Scholar]
- Xi W.; Solovev A. A.; Ananth A. N.; Gracias D. H.; Sanchez S.; Schmidt O. G. Rolled-Up Magnetic Microdrillers: Towards Remotely Controlled Minimally Invasive Surgery. Nanoscale 2013, 5, 1294–1297. [DOI] [PMC free article] [PubMed] [Google Scholar]
- Kagan D.; Benchimol M. J.; Claussen J. C.; Chuluun-Erdene E.; Esener S.; Wang J. Acoustic Droplet Vaporization and Propulsion of Perfluorocarbon-Loaded Microbullets for Targeted Tissue Penetration and Deformation. Angew. Chem., Int. Ed. 2012, 51, 7519–7522. [DOI] [PMC free article] [PubMed] [Google Scholar]
- Guix M.; Orozco J.; Garcia M.; Gao W.; Sattayasamitsathit S.; Merkoci A.; Escarpa A.; Wang J. Superhydrophobic Alkanethiol-Coated Microsubmarines for Effective Removal of Oil. ACS Nano 2012, 6, 4445–4451. [DOI] [PubMed] [Google Scholar]
- Zhao G.; Seah T. H.; Pumera M. External-Energy-Independent Polymer Capsule Motors and Their Cooperative Behaviors. Chem.—Eur. J. 2011, 17, 12020–12026. [DOI] [PubMed] [Google Scholar]
- Sanchez S.; Solovev A. A.; Harazim S. M.; Deneke C.; Mei Y. F.; Schmidt O. G. The Smallest Man-Made Jet Engine. Chem. Rec. 2011, 11, 367–370. [DOI] [PubMed] [Google Scholar]
- Gao W.; Sattayasamitsathit S.; Wang J. Catalytically Propelled Micro-/Nanomotors: How Fast Can They Move?. Chem. Rec. 2012, 12, 224–231. [DOI] [PubMed] [Google Scholar]
- Gibbs J.; Zhao Y. Catalytic Nanomotors: Fabrication, Mechanism, and Applications. Front. Mater. Sci. 2011, 5, 25–39. [Google Scholar]
- Mei Y. F.; Solovev A. A.; Sanchez S.; Schmidt O. G. Rolled-Up Nanotech on Polymers: from Basic Perception to Self-Propelled Catalytic Microengines. Chem. Soc. Rev. 2011, 40, 2109–2119. [DOI] [PubMed] [Google Scholar]
- Wang J. Can Man-Made Nanomachines Compete with Nature Biomotors?. ACS Nano 2009, 3, 4–9. [DOI] [PubMed] [Google Scholar]
- Howse J. R.; Jones R. A.; Ryan A. J.; Gough T.; Vafabakhsh R.; Golestanian R. Self-Motile Colloidal Particles: from Directed Propulsion to Random Walk. Phys. Rev. Lett. 2007, 99, 048102. [DOI] [PubMed] [Google Scholar]
- Sanchez S.; Pumera M. Nanorobots: The Ultimate Wireless Self-Propelled Sensing and Actuating Devices. Chem.—Asian J. 2009, 4, 1402–1410. [DOI] [PubMed] [Google Scholar]
- Mirkovic T.; Zacharia N. S.; Scholes G. D.; Ozin G. A. Fuel for Thought: Chemically Powered Nanomotors Out-Swim Nature’s Flagellated Bacteria. ACS Nano 2010, 4, 1782–1789. [DOI] [PubMed] [Google Scholar]
- Pavlick R. A.; Sengupta S.; McFadden T.; Zhang H.; Sen A. A Polymerization-Powered Motor. Angew. Chem., Int. Ed. 2011, 50, 9374–9377. [DOI] [PubMed] [Google Scholar]
- Mallouk T. E.; Sen A. Powering Nanorobots. Sci. Am. 2009, 300, 72–77. [DOI] [PubMed] [Google Scholar]
- Ghosh A.; Fischer P. Controlled Propulsion of Artificial Magnetic Nanostructured Propellers. Nano Lett. 2009, 9, 2243–2245. [DOI] [PubMed] [Google Scholar]
- Zhang L.; Abbott J. J.; Dong L. X.; Kratochvil B. E.; Bell D.; Nelson B. J. Artificial Bacterial Flagella: Fabrication and Magnetic Control. Appl. Phys. Lett. 2009, 94, 064107. [Google Scholar]
- Loget G.; Kuhn A. Electric Field-Induced Chemical Locomotion of Conducting Objects. Nat. Commun. 2011, 2, 6. [DOI] [PubMed] [Google Scholar]
- Jiang H.-R.; Yoshinaga N.; Sano M. Active Motion of a Janus Particle by Self-Thermophoresis in a Defocused Laser Beam. Phys. Rev. Lett. 2010, 105, 268302. [DOI] [PubMed] [Google Scholar]
- Qian B.; Montiel D.; Bregulla A.; Cichos F.; Yang H. Harnessing Thermal Fluctuations for Purposeful Activities: The Manipulation of Single Micro-Swimmers by Adaptive Photon Nudging. Chem. Sci. 2013, 4, 1420–1429. [Google Scholar]
- Ibele M.; Mallouk T. E.; Sen A. Schooling Behavior of Light-Powered Autonomous Micromotors in Water. Angew. Chem., Int. Ed. 2009, 48, 3308–3312. [DOI] [PubMed] [Google Scholar]
- Hong Y. Y.; Diaz M.; Cordova-Figueroa U. M.; Sen A. Light-Driven Titanium-Dioxide-Based Reversible Microfireworks and Micromotor/Micropump Systems. Adv. Funct. Mater. 2010, 20, 1568–1576. [Google Scholar]
- Chaturvedi N.; Hong Y.; Sen A.; Velegol D. Magnetic Enhancement of Phototaxing Catalytic Motors. Langmuir 2010, 26, 6308–6313. [DOI] [PubMed] [Google Scholar]
- Paxton W. F.; Kistler K. C.; Olmeda C. C.; Sen A.; St Angelo S. K.; Cao Y. Y.; Mallouk T. E.; Lammert P. E.; Crespi V. H. Catalytic Nanomotors: Autonomous Movement of Striped Nanorods. J. Am. Chem. Soc. 2004, 126, 13424–13431. [DOI] [PubMed] [Google Scholar]
- Fournier-Bidoz S.; Arsenault A. C.; Manners I.; Ozin G. A. Synthetic Self-Propelled Nanorotors. Chem. Commun. (Cambridge, U.K.) 2005, 441–443. [DOI] [PubMed] [Google Scholar]
- Baraban L.; Makarov D.; Streubel R.; Monch I.; Grimm D.; Sanchez S.; Schmidt O. G. Catalytic Janus Motors on Microfluidic Chip: Deterministic Motion for Targeted Cargo Delivery. ACS Nano 2012, 6, 3383–3389. [DOI] [PubMed] [Google Scholar]
- Wilson D. A.; Nolte R. J. M.; van Hest J. C. M. Autonomous Movement of Platinum-Loaded Stomatocytes. Nat. Chem. 2012, 4, 268–274. [DOI] [PubMed] [Google Scholar]
- Mei Y. F.; Huang G. S.; Solovev A. A.; Urena E. B.; Moench I.; Ding F.; Reindl T.; Fu R. K. Y.; Chu P. K.; Schmidt O. G. Versatile Approach for Integrative and Functionalized Tubes by Strain Engineering of Nanomembranes on Polymers. Adv. Mater. (Weinheim, Ger.) 2008, 20, 4085–4090. [Google Scholar]
- Solovev A. A.; Mei Y. F.; Urena E. B.; Huang G. S.; Schmidt O. G. Catalytic Microtubular Jet Engines Self-Propelled by Accumulated Gas Bubbles. Small 2009, 5, 1688–1692. [DOI] [PubMed] [Google Scholar]
- Gao W.; Sattayasamitsathit S.; Orozco J.; Wang J. Highly Efficient Catalytic Microengines: Template Electrosynthesis of Polyaniline/Platinum Microtubes. J. Am. Chem. Soc. 2011, 133, 11862–11864. [DOI] [PubMed] [Google Scholar]
- Harazim S. M.; Xi W.; Schmidt C. K.; Sanchez S.; Schmidt O. G. Fabrication and Applications of Large Arrays of Multifunctional Rolled-Up SiO/SiO2 Microtubes. J. Mater. Chem. 2012, 22, 2878–2884. [Google Scholar]
- Bolanos-Quinones V. A.; Ma L.; Li S. L.; Jorgensen M.; Kiravittaya S.; Schmidt O. G. Enhanced Optical Axial Confinement in Asymmetric Microtube Cavities Rolled Up from Circular-Shaped Nanomembranes. Opt. Lett. 2012, 37, 4284–4286. [DOI] [PubMed] [Google Scholar]
- Kagan D.; Campuzano S.; Balasubramanian S.; Kuralay F.; Flechsig G. U.; Wang J. Functionalized Micromachines for Selective and Rapid Isolation of Nucleic Acid Targets from Complex Samples. Nano Lett. 2011, 11, 2083–2087. [DOI] [PubMed] [Google Scholar]
- Sanchez S.; Solovev A. A.; Mei Y.; Schmidt O. G. Dynamics of Biocatalytic Microengines Mediated by Variable Friction Control. J. Am. Chem. Soc. 2010, 132, 13144–13145. [DOI] [PubMed] [Google Scholar]
- Campuzano S.; Kagan D.; Orozco J.; Wang J. Motion-Driven Sensing and Biosensing Using Electrochemically Propelled Nanomotors. Analyst (Cambridge, U.K.) 2011, 136, 4621–4630. [DOI] [PubMed] [Google Scholar]
- Campuzano S.; Orozco J.; Kagan D.; Guix M.; Gao W.; Sattayasamitsathit S.; Claussen J. C.; Merkoci A.; Wang J. Bacterial Isolation by Lectin-Modified Microengines. Nano Lett. 2012, 12, 396–401. [DOI] [PMC free article] [PubMed] [Google Scholar]
- Orozco J.; Garcia-Gradilla V.; D’Agostino M.; Gao W.; Cortes A.; Wang J. Artificial Enzyme-Powered Microfish for Water-Quality Testing. ACS Nano 2013, 7, 818–824. [DOI] [PubMed] [Google Scholar]
- Tengvall P.; Elwing H.; Sjöqvist L.; Lundström I.; Bjursten L. M. Interaction between Hydrogen Peroxide and Titanium: A Possible Role in the Biocompatibility of Titanium. Biomaterials 1989, 10, 118–120. [DOI] [PubMed] [Google Scholar]
- Kim N. H.; Kim K. Surface-Enhanced Resonance Raman Scattering of Rhodamine 6G on Pt Nanoaggregates. J. Raman Spectrosc. 2005, 36, 623–628. [Google Scholar]
- Hall S. B.; Khudaish E. A.; Hart A. L. Electrochemical Oxidation of Hydrogen Peroxide at Platinum Electrodes. Part 1. An Adsorption-Controlled Mechanism. Electrochim. Acta 1998, 43, 579–588. [Google Scholar]
- Choudhary V. R.; Samanta C.; Jana P. Decomposition and/or Hydrogenation of Hydrogen Peroxide over Pd/Al2O3 Catalyst in Aqueous Medium: Factors Affecting the Rate of H2O2 Destruction in Presence of Hydrogen. Appl. Catal., A 2007, 332, 70–78. [Google Scholar]
- Mededovic S.; Locke B. R. Platinum Catalysed Decomposition of Hydrogen Peroxide in Aqueous-Phase Pulsed Corona Electrical Discharge. Appl. Catal., B 2006, 67, 149–159. [Google Scholar]
- Samet Y.; Mefteh R.; Abdelhedi R.; Savall A. Improvement of the Electrocatalytic Activity of Platinum in Oxidation of Aromatic Compounds. C. R. Chim. 2008, 11, 1254–1261. [Google Scholar]
- Prabhuram J.; Manoharan R. Investigation of Methanol Oxidation on Unsupported Platinum Electrodes in Strong Alkali and Strong Acid. J. Power Sources 1998, 74, 54–61. [Google Scholar]
- Frankel G. S. Pitting Corrosion of Metals. A Review of the Critical Factors. J. Electrochem. Soc. 1998, 145, 2186–2198. [Google Scholar]
- Zhao G.; Stuart E. J. E.; Pumera M. Enhanced Diffusion of Pollutants by Self-Propulsion. Phys. Chem. Chem. Phys. 2011, 13, 12755–12757. [DOI] [PubMed] [Google Scholar]
- Happel J.; Brenner H.. Low Reynolds Number Hydrodynamics, 2nd ed.; Martinus Nijhoff Publishers: The Hague, 1983. [Google Scholar]
Associated Data
This section collects any data citations, data availability statements, or supplementary materials included in this article.