

Abstract
Aim:
The aim of this study is to determine the factors responsible for differences in the prevalence of diabetes mellitus (DM) in subjects of different social class in an urban South Indian population.
Materials and Methods:
Analyses were based on the cross-sectional data from the Chennai Urban Rural Epidemiology Study of 1989 individuals, aged ≥20 years. Entered in the analyses were information obtained by self-report on (1) household income; (2) family history of diabetes; (3) physical activity; (4) smoking status; (5) alcohol consumption. Biochemical, clinical and anthropometrical measurements were performed and included in the analyses. Social class was classified based on income as low (Rs. <2000) intermediate (Rs. 2000-5000`) and high (Rs. 5000-20000).
Results:
The prevalence rates of DM were 12.0%, 18.4% and 21.7% in low, intermediate and high social class, respectively (P < 0.001). A significant increase in the risk of diabetes was found with ascending social class (Intermediate class: Odds ratio [OR], 1.7 [confidence interval [CI], 1.2-2.3]; High class: OR, 2.0 [CI-1.4-2.9]). The multivariable adjusted logistic regression analysis revealed that the effect of social class on the risk of diabetes remained significant (P = 0.016) when age, family history of diabetes and blood pressure were included. However, with the inclusion of abdominal obesity in the model, the significant effect of social class disappeared (P = 0.087).
Conclusion:
An increased prevalence of DM was found in the higher social class in this urban South Indian population, which is explained by obesity.
Keywords: Asian Indians, diabetes, obesity, social class, socio-economic status, South Asians, urban
INTRODUCTION
India has the second largest number of people with diabetes mellitus (DM) in the world. A recent national survey, the Indian Council of Medical Research-INdia DIABetes (ICMR-INDIAB) Study has confirmed that India has 62.4 million people with diabetes.[1] According to the International Diabetes Federation, by 2030 this will increase to over 100 million.[2] An estimated 95% of these are type 2 DM patients; therefore, the terms DM and type 2 DM will be used interchangeably in this report. Widespread problems arise when a large proportion of a population has DM as it has economic, societal, clinical and individual impact.[3] Therefore, establishing the predominant risk factors and the distribution of these in a given population are of high importance for designing and implementing targeted interventions to halt and reverse the future prospects.
Although there is a strong genetic component for DM, environmental factors are equally important.[4] Of the non-modifiable risk factors, family history of DM and age are of special importance as Indians have a tendency to develop DM at a younger age and are subjected to a strong genetic predisposition.[5,6,7,8,9] Among the modifiable risk factors obesity, physical inactivity, hypertension, alcohol consumption and smoking are readily established.[10,11,12,13,14]
In industrialized countries, the highest prevalence of DM is found in the lower social classes, whereas the opposite trend appears in developing countries with the highest prevalence being found in the highest social class.[15,16,17] Thus, life-styles associated with different social classes may vary between countries. Until now, most studies conducted in India have focused on the difference in DM prevalence between the urban and rural areas and high and low income groups in an intra-urban setting.[17,18,19,20] It is possible that individuals living in urban areas belonging to a higher social class are more likely to be exposed to the specific risk factors for DM. However, several studies have shown that socio-economic status also has an independent association with DM, when comparing different socio-economic groups.[17,18,19,20,21] Therefore, the aim of this study was to determine the factors responsible for differences in prevalence of DM in subjects of different social class in an urban South Indian population.
MATERIALS AND METHODS
The Chennai Urban Rural Epidemiology Study (CURES) is a cross-sectional epidemiological survey conducted on a representative sample of the population of Chennai (formerly Madras city) in Southern India.[19] The survey was conducted between 2001 and 2004 in three phases. In the initial phase of the survey, 46 wards were systematically selected to represent the 10 zones of Chennai. The sample size obtained from each ward was proportional to the total population living in that particular zone. Every third road on the right hand within each ward was surveyed. A structured questionnaire (which had been pretested and validated) was administered to all study participants by the interviewers to collect information regarding demographic, socio-economic, behavioral and health status. All interviewers underwent extensive training on various aspects of the study and a pilot study was conducted among a subpopulation of 100 subjects to overcome the practical difficulties of performing the study. In phase 1, data was collected until a total of 26,001 individual's ≥20 years of age had been interviewed. This paper primarily concerns phase 3, in which every tenth subject recruited in phase 1 (n = 2600) was selected using the systematic sampling method and invited to our center for detailed anthropometric measurements and biochemical tests. Of these, 2350 participated in the study (response rate: 90.4%). Eligible for inclusion in our analyses were 1,989 (1,071 females) individuals, for whom complete information on all relevant variables was obtained. The mean age was 39.0 ± 12.6 years (range: 20-80 years).
DM was diagnosed based on self-reported drug treatment (insulin or hypoglycemic agents) and/or World Health Organization (WHO) criteria, i.e., 2 h post load plasma venous glucose ≥11.1 mmol/l (200 mg/dl).[22] Participants were instructed to fast overnight (≥8 h). All individuals underwent a standard oral glucose tolerance test except for self-reported diabetic participants (n = 136) who had a fasting glucose test only. Venous plasma glucose was measured using a Hitachi-912 Autoanalyzer (Hitachi, Mannheim, Germany). Pre-diabetes comprised participants identified with impaired fasting glucose and/or impaired glucose tolerance by WHO criteria, i.e., fasting plasma glucose ≥6.1 mmol/l (110 mg/dl) and <7.0 mmol/l (126 mg/dl) and/or 2 h post load plasma glucose ≥7.8 mmol/l (140 mg/dl) and <11.1 mmol/l (200 mg/dl), respectively.[22]
The following variables were included as possible risk factors; social class, age, sex, obesity, physical inactivity, family history of diabetes and blood pressure (BP). Social class was the primary independent variable in the analyses. The variable is based on self-reported monthly household income and is categorized in accordance to previous studies of social class differences in India.[17,21] Accordingly, social class was graded as low ( <2000) intermediate ( 2000-5000) and high ( 5000-20 000). Abdominal obesity was classified by waist circumference (WC) according to the WHO criteria for Asians, i.e., ≥90 cm for male and ≥80 cm for female.[23] WC was obtained from all participants. It was measured using a non-stretchable fiber measure tape. The participants were asked to stand erect in a relaxed position, arms at the side and with both feet together. One layer of clothing was accepted. Waist girth was measured as the smallest horizontal breadth between the costal margins and the iliac crest at the end of normal expiration. WC was measured to the nearest 0.1 cm and carried out twice; the mean value was used as the WC. Abdominal obesity was included as a dichotomous variable in the descriptive analysis and included as a continuous variable in the logistic regression model. Height was measured with a tape as the participant stood without shoes against the wall. Weight was measured to nearest 0.1 kg by a traditional spring balance, which was calibrated every day with known weights. Body mass index (BMI) was employed to assess the general obesity likewise using the WHO criteria for Asians, i.e. BMI ≥25 kg/m2.[23] Physical activity was based upon the self-report. Based on exercise, leisure time activities and job related activities respondents were categorized into three groups indicating activity level (vigorously active, moderately active and sedentary). Individuals were graded as vigorously active if they did leisure time exercise and had physically demanding work, whereas individuals who either exercised or had physically demanding work were categorized as moderately active. All others were categorized as sedentary. Family history of diabetes was based on the self-report stating whether both, one or none of the parents were diagnosed with DM.
BP was measured on the right arm using a mercury sphygmomanometer (Diamond Deluxe BP Apparatus, Pune, India) with the participant sitting in an upright position. The readings were recorded to the nearest 2 mm Hg from the top of the mercury meniscus. Systolic pressure was recorded at the first appearance of sound and diastolic pressure was measured at the disappearance of sound (Korotkoff's phase 5). Measurement was repeated after 5 min and the mean value was recorded as the BP reading. Hypertension was defined by the 2003 Joint National Committee criteria, as systolic BP ≥140 mmHg and/or diastolic BP ≥90 mmHg. Normal BP was recorded as <120mmHg/80 mmHg.[24] BP was included as an ordinal variable in the analyses. Glycated hemoglobin (HbA1c) was measured by the high pressure liquid chromatography method using a Variant machine (BIORAD, Hercules, California, USA).
Statistics
Means ± standard deviation are reported for normally distributed variables. Group comparisons of means were performed using ANOVA F-test. Proportions were compared using a (2-test. Logistic regression analyses were performed on a model including all covariates and two-way interactions, stepwise excluding the least significant variable/interaction, one at a time, until all included covariates was statistically significant (P < 0.05). The dependent variable comprised participants with DM. The independent variables included in the full model were social class, sex, age, WC, family history of diabetes and BP and all two-way interactions. The assumption of logit linearity was tested for the two continuous variables age and WC, by exploring how to best include them.
To ensure that related variables did not diminish each other's effect on the outcome, only one obesity measure was included. WC was employed in the logistic regression analyses as this measure is a better indicator of the risk of developing DM than general obesity measured by BMI in this ethnic group.[23] In our earlier study,[25] we found that WC estimates obesity-related cardiovascular disease risk better than BMI. However, the model search was repeated with BMI to examine whether this recommendation was applicable to our particular study. Finally, to further examine the results from the multivariable adjusted model a forward stepwise model search was performed including the significant variables from the final logistic regression model.
All statistical analyses were carried out using the SPSS 16.0 (Chicago, IL, USA). All tests are two-sided. P <0.05 was considered as statistically significant.
RESULTS
The prevalence of DM in low, intermediate and high social class was 12.0%, 18.4% and 21.7%, respectively. For women, the high social class had significantly higher prevalence compared with intermediate and low social class (P < 0.001).
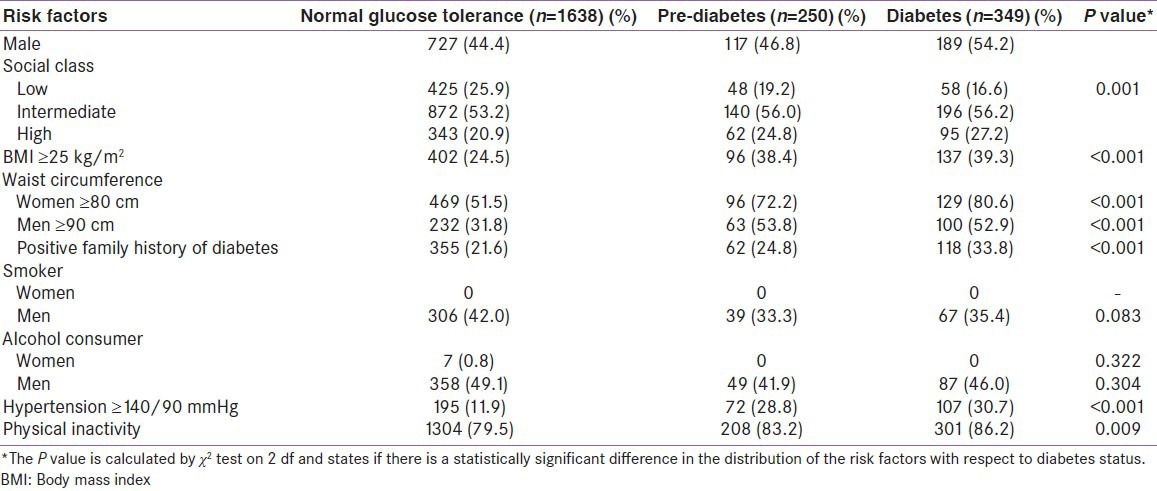
Table 1 shows mean values of baseline characteristics distributed by glycemic status. A statistically significant gradient was found, where higher mean values of age, BMI, WC, diastolic and systolic BP and HbA1c percentage increased from the normal glucose tolerance group to the diabetes group. Table 2 shows the prevalence of various risk factors stratified according to the glycemic status. It is noted that the prevalence of all risk factors were the highest among diabetic subjects, followed by those with pre-diabetes. We found while around 50% of women with normal glucose tolerance had a WC >80 cm, for the diabetes group, it was more than 80%.
Table 1.
Glycemic status and baseline characteristics of the study population
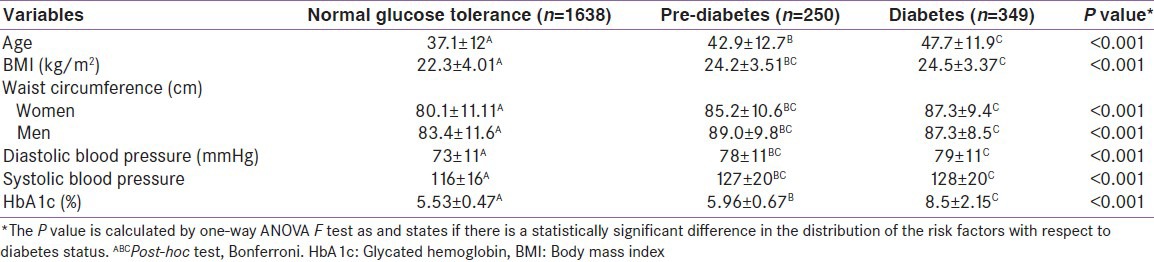
Table 2.
Prevalence of various risk factors stratified according to the glycemic status
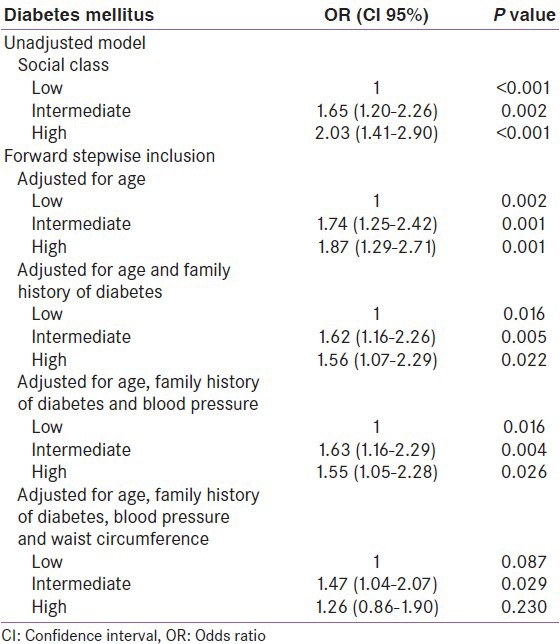
Multiple logistic regression analysis resulted in a model including age, social class, WC, family history of DM and BP as risk factors [Table 3]. In the unadjusted analyses, the risk increased with the increasing affluence (P < 0.001). The stepwise forward model analysis showed that the effect of social class on the risk of having DM remained significant (P = 0.016) when age, family history of diabetes and BP were included. However, with the inclusion of obesity measured by WC in the model, the significant effect of social class disappeared (P = 0.087).
Table 3.
Logistic regression analyses illustrating the mediating effect of waist circumference on the risk of having diabetes according to social class
DISCUSSION
This study compares the association between higher social class and diabetes, which suggested that affluence, was associated with increased risk of diabetes, which is in accordance with several studies, which have investigated the effect of socio-economic status on the risk of DM in developing countries.[17,18,26,27] However, on adjustment for various factors in the step forward regression model, when obesity was included in the model, the differences disappeared suggesting that the difference could be explained by obesity. India is presently undergoing a transition from a pattern generally seen in developing countries, i.e. high prevalence of DM and non-communicable diseases (NCDs) in the higher social class, which is the opposite pattern seen in western countries, where the poor or the low social class have a high prevalence of DM, obesity and other NCDs.
Previously, researchers have shown that obesity is the key environmental factor for DM.[20,28] We suggest that material life conditions as a proxy for social class could have a major impact on life-style. This suggests that in India, high social class leads to a life-style associated with obesity, which predisposes the high social class to DM. Affluence assures better life conditions and thus may be employed as a proxy for social class. In addition, affluence causes the accumulation of several factors such as physical inactivity and higher calorie intake, which again lead to obesity. Knowing that obesity is a central independent risk factor for the development of DM,[29] it is plausible that obesity as a mediator explains the absence of an independent effect of social class on the risk of having DM in the adjusted analysis. The step-wise forward model supports this, as the effect of social class was significant when all other risk factors except obesity were included in the model. With the inclusion of obesity, the significant effect of social class disappeared, suggesting that it is obesity, which is the major determinant of increased prevalence of DM in the higher social class.
On the basis of the evidently close relationship between social class and obesity, we wanted to elaborate on the effect of obesity in our study. When not taking possible confounders into account, we found significantly increasing prevalence rates of both general and abdominal obesity with rising affluence. Neither gender nor physical activity had a significant effect on the risk of DM in the logistic regression model. As physical activity was measured by self-report, it is likely that this variable is biased by misclassification as people tend to over-report or can have difficulties assessing their own physical activity level. Hence, this may be the reason for the lack of significant effect of physical activity in this study.
The current study used income as a proxy of social class. This implies that the life-style opportunities available are dependent on the individual's resources. By choosing income as an indicator of social class, the association between social class and DM is explained by how material life conditions affect health. Although, the use of household income to define social class could be associated with a certain degree of bias, we regard the result of our analyses to indicate a valid trend taking the large study sample into account.
It is possible with the rapid epidemiological transition that is occurring in India, the scenario presented in this paper could rapidly change. Indeed, in a 10 year follow-up study of the Chennai Urban Population Study (CUPS) conducted between 1996 and 1998, we have noted that there is now a convergence of the prevalence rates of diabetes in the low and the middle income groups.[30] Hence, it is likely that with time, the prevalence rates of diabetes and obesity may in fact become higher in the lower income group as is presently seen in the developed countries of the world.
In summary, a higher prevalence of DM was found in the higher social class in this urban South Indian population, which is explained by obesity. It would be worthwhile conducting longitudinal studies to prospectively look at the effect of social class on the risk of development of diabetes in India.
ACKNOWLEDGMENTS
We are grateful to the Chennai Willingdon Corporate Foundation, Chennai, for the financial support provided for the study. We thank the epidemiology team members for conducting the CURES field studies. This is the 116th publication from CURES (CURES-116).
Footnotes
Source of Support: Chennai Willingdon Corporate Foundation, Chennai, for the financial support provided for the study
Conflict of Interest: None declared
REFERENCES
- 1.Anjana RM, Pradeepa R, Deepa M, Datta M, Sudha V, Unnikrishnan R, et al. Prevalence of diabetes and prediabetes (impaired fasting glucose and/or impaired glucose tolerance) in urban and rural India: Phase I results of the Indian Council of Medical Research-INdia DIABetes (ICMR-INDIAB) study. Diabetologia. 2011;54:3022–7. doi: 10.1007/s00125-011-2291-5. [DOI] [PubMed] [Google Scholar]
- 2.Unwin N, Whiting D, Guariguata L, Ghyoot G, Gan D, editors. Diabetes Atlas. 5th ed. Brussels, Belgium: International Diabetes Federation; 2011. International Diabetes Federation; pp. 11–74. [Google Scholar]
- 3.Surana SP, Shah DB, Gala K, Susheja S, Hoskote SS, Gill N, et al. Prevalence of metabolic syndrome in an urban Indian diabetic population using the NCEP ATP III guidelines. J Assoc Physicians India. 2008;56:865–8. [PubMed] [Google Scholar]
- 4.Hoskote SS, Joshi SR. Are Indians destined to be diabetic? J Assoc Physicians India. 2008;56:225–6. [PubMed] [Google Scholar]
- 5.Joshi SR. Metabolic syndrome - Emerging clusters of the Indian phenotype. J Assoc Physicians India. 2003;51:445–6. [PubMed] [Google Scholar]
- 6.Dagogo-Jack S. Ethnic disparities in type 2 diabetes: Pathophysiology and implications for prevention and management. (779-89).J Natl Med Assoc. 2003;95:774. [PMC free article] [PubMed] [Google Scholar]
- 7.Kooner JS, Saleheen D, Sim X, Sehmi J, Zhang W, Frossard P, et al. Genome-wide association study in individuals of South Asian ancestry identifies six new type 2 diabetes susceptibility loci. Nat Genet. 2011;43:984–9. doi: 10.1038/ng.921. [DOI] [PMC free article] [PubMed] [Google Scholar]
- 8.Vimaleswaran KS, Radha V, Ghosh S, Majumder PP, Deepa R, Babu HN, et al. Peroxisome proliferator-activated receptor-gamma co-activator-1alpha (PGC-1alpha) gene polymorphisms and their relationship to Type 2 diabetes in Asian Indians. Diabet Med. 2005;22:1516–21. doi: 10.1111/j.1464-5491.2005.01709.x. [DOI] [PubMed] [Google Scholar]
- 9.Radha V, Kanthimathi S, Mohan V. Genetics of type diabetes. In: Mehra NK, editor. The HLA Complex in Biology and Medicine- A Resource Book. New Delhi: India Jaypee Brothers Medical Publishers; 2010. pp. 241–53. [Google Scholar]
- 10.Kriska AM, Pereira MA, Hanson RL, de Courten MP, Zimmet PZ, Alberti KG, et al. Association of physical activity and serum insulin concentrations in two populations at high risk for type 2 diabetes but differing by BMI. Diabetes Care. 2001;24:1175–80. doi: 10.2337/diacare.24.7.1175. [DOI] [PubMed] [Google Scholar]
- 11.Gress TW, Nieto FJ, Shahar E, Wofford MR, Brancati FL. Hypertension and antihypertensive therapy as risk factors for type 2 diabetes mellitus. Atherosclerosis risk in communities study. N Engl J Med. 2000;342:905–12. doi: 10.1056/NEJM200003303421301. [DOI] [PubMed] [Google Scholar]
- 12.Conen D, Ridker PM, Mora S, Buring JE, Glynn RJ. Blood pressure and risk of developing type 2 diabetes mellitus: The Women›s health study. Eur Heart J. 2007;28:2937–43. doi: 10.1093/eurheartj/ehm400. [DOI] [PubMed] [Google Scholar]
- 13.Baliunas DO, Taylor BJ, Irving H, Roerecke M, Patra J, Mohapatra S, et al. Alcohol as a risk factor for type 2 diabetes: A systematic review and meta-analysis. Diabetes Care. 2009;32:2123–32. doi: 10.2337/dc09-0227. [DOI] [PMC free article] [PubMed] [Google Scholar]
- 14.Willi C, Bodenmann P, Ghali WA, Faris PD, Cornuz J. Active smoking and the risk of type 2 diabetes: A systematic review and meta-analysis. JAMA. 2007;298:2654–64. doi: 10.1001/jama.298.22.2654. [DOI] [PubMed] [Google Scholar]
- 15.Bjork S, Kapur A, King H, Nair J, Ramachandran A. Global policy: Aspects of diabetes in India. Health Policy. 2003;66:61–72. doi: 10.1016/s0168-8510(03)00044-7. [DOI] [PubMed] [Google Scholar]
- 16.Rao KD, Bhatnagar A, Murphy A. Socio-economic inequalities in the financing of cardiovascular and diabetes inpatient treatment in India. Indian J Med Res. 2011;133:57–63. [PMC free article] [PubMed] [Google Scholar]
- 17.Mohan V, Shanthirani S, Deepa R, Premalatha G, Sastry NG, Saroja R, et al. Intra-urban differences in the prevalence of the metabolic syndrome in southern India – The Chennai urban population study (CUPS No. 4) Diabet Med. 2001;18:280–7. doi: 10.1046/j.1464-5491.2001.00421.x. [DOI] [PubMed] [Google Scholar]
- 18.Ramachandran A, Mary S, Yamuna A, Murugesan N, Snehalatha C. High prevalence of diabetes and cardiovascular risk factors associated with urbanization in India. Diabetes Care. 2008;31:893–8. doi: 10.2337/dc07-1207. [DOI] [PubMed] [Google Scholar]
- 19.Deepa M, Pradeepa R, Rema M, Mohan A, Deepa R, Shanthirani S, et al. The Chennai urban rural epidemiology study (CURES) - Study design and methodology (urban component) (CURES-I) J Assoc Physicians India. 2003;51:863–70. [PubMed] [Google Scholar]
- 20.Evans JM, Newton RW, Ruta DA, MacDonald TM, Morris AD. Socio-economic status, obesity and prevalence of Type 1 and Type 2 diabetes mellitus. Diabet Med. 2000;17:478–80. [PubMed] [Google Scholar]
- 21.Ramachandran A, Snehalatha C, Vijay V, King H. Impact of poverty on the prevalence of diabetes and its complications in urban Southern India. Diabet Med. 2002;19:130–5. doi: 10.1046/j.1464-5491.2002.00656.x. [DOI] [PubMed] [Google Scholar]
- 22.Alberti KG, Zimmet PZ. Definition, diagnosis and classification of diabetes mellitus and its complications. Part 1: Diagnosis and classification of diabetes mellitus provisional report of a WHO consultation. Diabet Med. 1998;15:539–53. doi: 10.1002/(SICI)1096-9136(199807)15:7<539::AID-DIA668>3.0.CO;2-S. [DOI] [PubMed] [Google Scholar]
- 23.Sydney: Health Communications Australia Pty. Ltd; 2000. Regional Office for the Western Pacific of the World Health Organization. World Health Organization, International Association for the Study of Obesity and International Obesity Task Force. The Asia Pacific Perspective: Redefining Obesity and its Treatment; pp. 17–21. [Google Scholar]
- 24.Chobanian AV, Bakris GL, Black HR, Cushman WC, Green LA, Izzo JL, Jr, et al. The seventh report of the joint national committee on prevention, detection, evaluation, and treatment of high blood pressure: The JNC 7 report. JAMA. 2003;289:2560–72. doi: 10.1001/jama.289.19.2560. [DOI] [PubMed] [Google Scholar]
- 25.Deepa M, Farooq S, Deepa R, Manjula D, Mohan V. Prevalence and significance of generalized and central body obesity in an urban Asian Indian population in Chennai, India (CURES: 47) Eur J Clin Nutr. 2009;63:259–67. doi: 10.1038/sj.ejcn.1602920. [DOI] [PubMed] [Google Scholar]
- 26.Boddula R, Yadav S, Bhatia V, Genitta G, Pandey D, Kumar A, et al. High prevalence of type 2 diabetes mellitus in affluent urban Indians. Diabetes Res Clin Pract. 2008;81:e4–7. doi: 10.1016/j.diabres.2008.04.003. [DOI] [PubMed] [Google Scholar]
- 27.Singh RB, Beegom R, Mehta AS, Niaz MA, De AK, Mitra RK, et al. Social class, coronary risk factors and undernutrition, a double burden of diseases, in women during transition, in five Indian cities. Int J Cardiol. 1999;69:139–47. doi: 10.1016/s0167-5273(99)00010-8. [DOI] [PubMed] [Google Scholar]
- 28.Haslam DW, James WP. Obesity. Lancet. 2005;366:1197–209. doi: 10.1016/S0140-6736(05)67483-1. [DOI] [PubMed] [Google Scholar]
- 29.Haffner SM. Epidemiology of type 2 diabetes: Risk factors. Diabetes Care. 1998;21(Suppl 3):C3–6. doi: 10.2337/diacare.21.3.c3. [DOI] [PubMed] [Google Scholar]
- 30.Deepa M, Anjana RM, Manjula D, Narayan KM, Mohan V. Convergence of prevalence rates of diabetes and cardiometabolic risk factors in middle and low income groups in urban India: 10-year follow-up of the Chennai urban population study. J Diabetes Sci Technol. 2011;5:918–27. doi: 10.1177/193229681100500415. [DOI] [PMC free article] [PubMed] [Google Scholar]