

Abstract
Gilles de la Tourette syndrome (GTS) is a common developmental neuropsychiatric disorder characterized by tics and frequent psychiatric comorbidities, often causing significant disability. Tic generation has been linked to disturbed networks of brain areas involved in planning, controlling and execution of actions, particularly structural and functional disorders in the striatum and cortico–striato–thalamo–cortical loops. We therefore applied structural diffusion tensor imaging (DTI) to characterize changes in intrahemispheric white matter connectivity in cortico-subcortical circuits engaged in motor control in 15 GTS patients without psychiatric comorbidities. White matter connectivity was analyzed by probabilistic fiber tractography between 12 predefined cortical and subcortical regions of interest. Connectivity values were combined with measures of clinical severity rated by the Yale Global Tic Severity Scale (YGTSS). GTS patients showed widespread structural connectivity deficits. Lower connectivity values were found specifically in tracts connecting the supplementary motor areas (SMA) with basal ganglia (pre-SMA–putamen, SMA–putamen) and in frontal cortico-cortical circuits. There was an overall trend towards negative correlations between structural connectivity in these tracts and YGTSS scores. Structural connectivity of frontal brain networks involved in planning, controlling and executing actions is reduced in adult GTS patients which is associated with tic severity. These findings are in line with the concept of GTS as a neurodevelopmental disorder of brain immaturity.
Keywords: MRI white matter imaging, Diffusion tensor imaging, Movement disorder
Highlights
-
•
We examine white matter pathways in Tourette syndrome with diffusion tensor imaging.
-
•
GTS patients showed widespread structural connectivity deficits.
-
•
Altered connectivity in GTS patients was associated with tic severity.
-
•
Our findings are in line with the concept of GTS as disorder of brain immaturity.
1. Introduction
Gilles de la Tourette syndrome (GTS) is a complex developmental neuropsychiatric disorder with childhood onset. Its hallmarks are tics, i.e. repetitive, patterned movements akin to voluntary movements but misplaced in context and time. Tics are highly variable in their phenomenology and often accompanied by premonitory sensations. They are characterized by fluctuations in frequency and intensity (Jankovic, 1997). Furthermore, patients are able to suppress tics to a certain degree. Tics appear to result from a complex functional interplay of cortico-subcortical brain circuits (Ganos et al., 2012). GTS can be viewed as a model of aberrant activity in neuronal networks involved in planning, executing and controlling motor actions.
The pathophysiological mechanism that constitutes tics still remains elusive. However, increasing evidence from experimental, electrophysiological and imaging studies points to a disorder within fronto-striatal pathways (Ganos et al., 2012; McNaught and Mink, 2011). Specifically, structural and functional abnormalities in cortico–striato–thalamo–cortical circuits have been found in relation to tic generation (Bronfeld and Bar-Gad, 2013; Mink, 2006). In post-mortem neuropathological studies of GTS patients, abnormalities in the dopaminergic system were shown in frontal, primary motor and pre-motor cortical areas (Yoon et al., 2007). Apparent imbalances of GABAergic neuron distribution in the internal segment of the globus pallidus and striatum have also been proposed as pathophysiological correlates of a dysfunctional cortico-subcortical circuitry (Kalanithi et al., 2005).
On a macroscopic scale, knowledge on brain morphology has mainly been gained through magnetic resonance imaging (MRI) studies, although agreement on a common “GTS model” has not been reached. This notwithstanding, findings from structural imaging studies have advanced the understanding of GTS pathophysiology. Thinning of cortical motor areas as well as altered basal ganglia volumes have been reported and interpreted as reflections of altered cortico-subcortical circuits involved in tic generation (Hyde et al., 1995; Peterson et al., 2003). Cortical thinning correlating with tic severity has been found in the cingulate area as well as supplementary motor, premotor, somatosensory and prefrontal cortex (Draganski et al., 2010; Muller-Vahl et al., 2009; Sowell et al., 2008; Worbe et al., 2010). These structural changes indicate that wider networks of cortical and subcortical gray matter structures are involved in the pathophysiology of GTS.
In contrast to the large number of reports of structural analysis of gray matter regions, studies of white matter components of cortical projections in GTS are still scarce. Diffusion tensor imaging (DTI) investigates white matter structure in vivo and allows reconstruction of white matter tracts via estimation of the main fiber orientation (Johansen-Berg and Behrens, 2006). Advances in DTI and tracking methods have expedited the development of neuronal connectivity models that aim to quantify anatomical links between different brain regions (Le Bihan and Johansen-Berg, 2012). Using DTI, distinctive changes between GTS and control groups have been detected in motor connections, but also in white matter tracts of somatosensory, fronto-striatal, and transcallosal circuits (Govindan et al., 2010; Neuner et al., 2010; Thomalla et al., 2009).
Recently, findings from functional MRI in adolescent GTS patients have advanced the concept of immature brain networks in GTS as a disorder of neural development. Specifically, functional immaturity and disintegration of cortico-basal ganglia and frontal cortico-cortical networks have been detected by resting state fMRI (Church et al., 2009; Worbe et al., 2012).
Here, we applied DTI to explore the structural connectivity pattern between brain regions involved in motor control and their relation to clinical features. We examined the connectivity of intrahemispheric white matter tracts between 12 predefined regions of interest (ROIs) in 15 adult GTS patients and healthy controls using probabilistic tractography (Behrens et al., 2007). Only unmedicated adult GTS patients without co-morbidities were included to avoid confounding variables. We hypothesized that distinctive changes in intrahemispheric white matter connectivity would be present in GTS patients compared to healthy adults reflecting abnormal brain maturation in GTS as a neurodevelopmental disorder. More specifically, we hypothesized structural connectivity to be altered in fronto–striato–thalamic circuits that are involved in tic generation.
2. Materials and methods
2.1. Subjects
We analyzed clinical and MR data from 15 patients (13 men, mean age: 34.5; SD ± 8.9 years) previously included in a study of structural white matter integrity using voxel-based morphometry analysis of fractional anisotropy (FA) (Thomalla et al., 2009). We only included patients without psychiatric co-morbidities. Only four patients had been on medication to treat tics during the 12 months prior to the study, and all had stopped their medication at least 3 weeks prior to enrollment. The control group comprised age- and gender-matched healthy subjects (13 men, mean age: 34.6; SD ± 9.1 years). The study was approved by the local ethics committee (No. 2514). Written consent was obtained from all participants. Clinical assessment was performed by a neurologist or psychiatrist experienced in diagnosing and treating GTS patients. Lifetime clinical information was systematically collected using standardized clinical assessment and a semi-structured interview adapted from Robertson and Eapen (Eapen et al., 2001) where patients are systematically screened for premonitory urges and other sensory phenomena, disturbances of social behavior, impulse control disorder, as well as symptoms of depression or anxiety disorder. GTS and ADHD were diagnosed according to DSM-IV-TR criteria. Patients fulfilling criteria of OCD, ADHD or other co-morbidities were excluded from the study. Tic severity was rated using the Yale Global Tic Severity Scale (YGTSS) (Leckman et al., 1989).
2.2. Imaging
We performed MRI at 3 T field strength using a Magnetom Trio TIM (Siemens, Erlangen, Germany) equipped with a gradient system providing a maximum strength of 40 mT/m using an 8-channel head coil. DTI data was measured with an echo planar imaging (EPI) whole brain sequence. The sequence was configured as follows: TE/TR = 105/18.500 ms, bandwidth = 1954 Hz/Px, 128 × 128 matrix, FOV 256 × 192 mm, 60 axial slices, 2 mm slice thickness without inter-slice gap, resulting in an isotropic voxel size of 2 × 2 × 2 mm3, gradient pulses along 24 different directions with a b-value of 1000 s/mm2. Non-diffusion weighted image (b = 0 s/mm2) was acquired after every eighth image to guide registration of individual diffusion images. Measuring of DTI data was repeated to increase signal-to-noise ratio resulting in a total scanning time of 16 min and 50 s. Structural imaging was performed using a T1-weighted imaging of the whole brain. The Fast Low Angle Shot (FLASH) 3D sequence was configured as follows: TE/TR = 4.92/15 ms, flip angle 25, 192 slices, 1 mm slice thickness, 20% gap, 256 × 256 matrix, FOV 256 × 256 mm. Heads of participants were stabilized using foam pads to minimize movement artifacts. For each subject measurements of head displacement were derived from realignment parameters.
2.3. Data analysis
An overview of data processing is given in Fig. 1. Analysis of images was performed using tools from the FMRIB Software Library (FSL) (FMRIB Software Library, www.fmrib.ox.ac.uk/fsl) (Smith et al., 2004). For parcellation of cortical areas, we manually delineated ROIs on a standard brain template (Montreal Neurological Institute, MNI 152) by integration of functional and anatomical knowledge on specific brain regions from previous studies. Specifically, 12 ROIs were chosen to investigate the circuitry of motor and behavior control (Fig 1): Primary motor cortex (M1) (Geyer et al., 2000; Newton et al., 2006), primary sensory cortex (S1) (Eickhoff et al., 2005; Ramnani, 2006), ventral and dorsal premotor cortex (PMV and PMD) (Binkofski et al., 2004; Germann et al., 2005; Geyer, 2004; Tomassini et al., 2007), supplementary motor cortex (SMA) (Johansen-Berg et al., 2004; Lehericy et al., 2004; Picard and Strick, 2001), pre-supplementary motor cortex (Pre-SMA) (Johansen-Berg et al., 2004; Lehericy et al., 2004; Picard and Strick, 2001), and prefrontal and orbitofrontal cortex (PFC and OFC) (Maldjian et al., 2003). We included prefrontal areas and the OFC due to their role in flexible control of behavior. Both regions have been associated with impulse control and behavioral inhibition of motor actions (Aron et al., 2003; Duncan and Owen, 2000). In GTS, structural changes in both areas have been associated with tic severity (Draganski et al., 2010). Subcortical regions were created based on the Basal Ganglia Human Area Template (BGHAT) in MNI space (Prodoehl et al., 2008) including the caudate nucleus (Caud), globus pallidus (GP), putamen (Put) and thalamus (Thal).
Fig. 1.
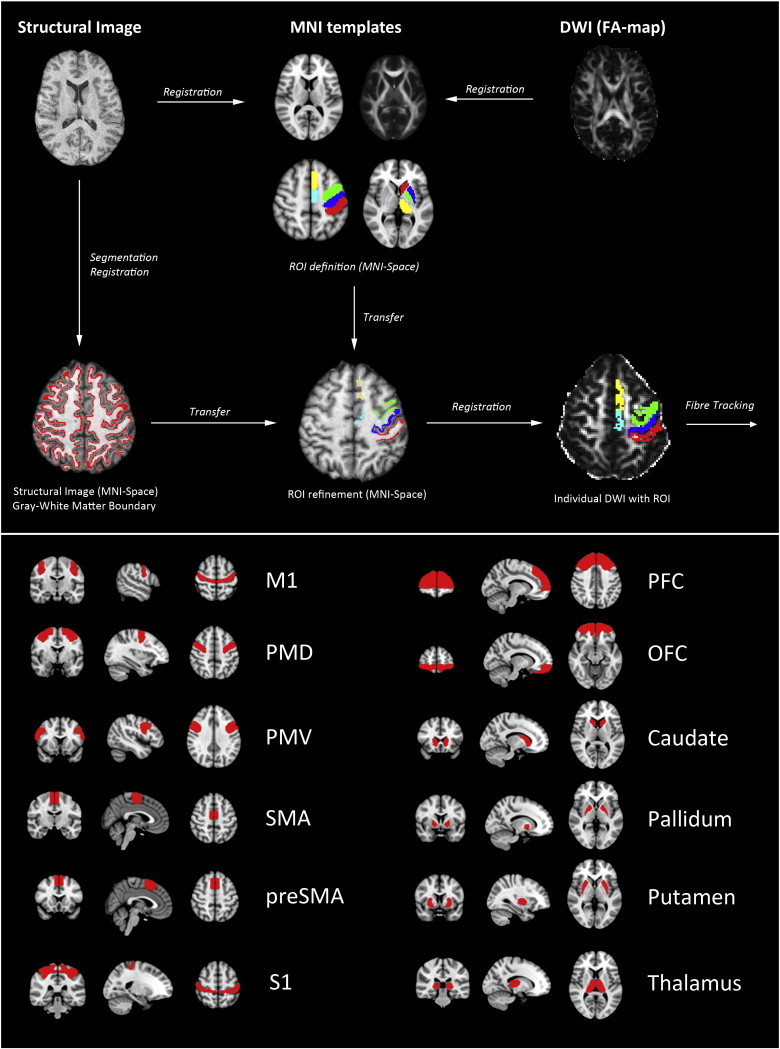
The image processing pipeline utilized in this paper (upper section). Cortical and subcortical region of interest shown on a structural brain template in Montreal Neurological Institute (MNI) space (lower section). Abbreviations: FA: Fractional anisotropy; DWI: Diffusion weighted imaging; MNI: Montreal Neurological Institute template; ROIs: Regions of interest; M1: Primary motor cortex; S1: Primary sensory cortex; PMV and PMD: Ventral and dorsal premotor cortex; SMA: Supplementary motor cortex; preSMA: Pre-supplementary motor cortex; PFC and OFC: Prefrontal and orbitofrontal cortex.
ROIs were further refined to delineate the gray–white matter boundary underlying the cortical areas to increase anatomical accuracy for DTI fiber tracking: We reconstructed gray–white matter boundary ROI from T1-weighted images in three steps: First, individual T1-weighted images were visually inspected for data quality and brain matter was extracted using the brain extraction tool (BET) available with the FSL software. Secondly, images were registered into MNI-space with the FMRIB linear and non-linear image registration tool FLIRT and FNIRT (Jenkinson and Smith, 2001) implemented in FSL. Third, we used FAST (FMRIB's Automated Segmentation Tool) to segment brain images into different tissue types (i.e. gray matter, white matter, cerebrospinal fluid). FAST creates partial volume maps for each class of segmentation. After segmentation white and gray matter volumes were binarized, dilated and multiplied. The result was a binarized border zone of voxels between gray and white matter (Zhang et al., 2001). These voxels were selected and the resulting ribbon-shaped masks multiplied with the ROIs defined previously. All individual ROI were visually checked by two investigators (B.C. and H.B.) for plausibility and accuracy.
FMRIB's Diffusion Toolbox (FDT) was used to perform all processing of DTI data. Motion and eddy current correction as well as image averaging were carried out on the diffusion data. Gradient directions were rotated after image alignment. The extent of head displacement during scanning was derived from alignment parameters and recorded in terms of absolute and relative values. Maps of fractional anisotropy were generated using DTI fit. To align diffusion imaging data to the MNI152 standard space, we applied TBSS (tract-based spatial statistics) on individual FA data (Smith et al., 2006; Yap et al., 2011). This resulted in a coefficient file (“warp”) containing values for linear and non-linear transformation of individual FA maps to the MNI152 space (using the FMRIB58 template as reference). Gray–white matter ROIs created previously were aligned to individual diffusion space applying the inverted transformation coefficient file generated by TBSS. These ROIs were then visually validated for accuracy and used as seed masks for probabilistic tractography. ROI sizes and FA values within ROIs were compared between patients and controls using a univariate general linear model (GLM). In probabilistic tractography, connectivity distribution drops with distance from the seed mask. We calculated the average length between different ROI using the distance-correction option of probtrackx. Values of average distances between seed and target ROI were included into the statistical model to account for the confounding effect of tract length.
Processing of diffusion data included application of a probabilistic diffusion model modified to allow estimation of multiple (n = 2) fiber directions using the program bedpostx (Behrens et al., 2003, 2007). From each seed ROI voxel, 5000 samples were initiated through the probability distribution on principle fiber direction over one entire hemisphere. Pathways were disregarded if they entered a voxel with FA < 0.15. This arbitrary threshold was chosen based on pilot analyses showing this threshold consistently preventing erroneous tracking between neighboring gyri. Tracking resulted in individual maps representing the connectivity value between the seed ROI and individual voxel. For each hemisphere, intrahemispheric structural connectivity between two regions was measured masking each seed ROI results by each of the remaining 11 “target” ROIs. To account for differences in volume of ROI masks, a normalized connectivity index (CI) was calculated by dividing the masked voxel values through the product of seed and target ROI volumes: CI = sum of intensity values in target ROI / (seed ROI volume × target ROI volume).
2.4. Statistical analysis
Measuring connectivity between ROIs resulted in CI for 66 tract connections in each participant, hemisphere and direction. Prior to analysis, distribution of data was visually inspected and data were log transformed to reach normal distribution. Following statistical analyses, if not otherwise indicated, log-transformed values were back-transformed. Estimated means and 95% confidence intervals are reported.
Maximum translation and rotation of individual head movements were compared between patients and controls using a two-tailed Mann–Whitney U-test. To examine and compare ROI characteristics, we first calculated individual ROI sizes and mean FA values using FSL. We then applied a univariate general linear model using either mean FA (of the ROI) or ROI size as a depended variable adjusting for ROI location, hemisphere side and group. We examined the interaction of “Group × ROI” to detect potential differences in ROI characteristics between the two groups. SPSS 20.0 (IBM Co., Somers, NY, USA) was used for this analysis.
We then investigated the hypothesis whether patients and healthy controls exhibit different connectivity between predefined ROIs in a separate analysis. In order to control for the hierarchical structure of the data, a multilevel model was calculated (Brown and Prescott, 2006). The model was adjusted for following fixed effects: group, hemisphere side and track. All two-way and three-way interactions were included into the model. Likelihood ratio test was used for variable selection. Post-hoc group comparisons were carried out on estimated means and a Bonferroni-correction was applied to correct for multiple comparisons. SAS 9.3 (SAS Institute Inc., Cary, NC, USA) was used for analysis of the multilevel model.
To investigate the clinical significance of altered structural connectivity, behavioral data (YGTSS) were correlated with CI values of tracts based on significant group results. Therefore, we used a two-tailed Spearman's rank correlation (p < 0.05 uncorrected for multiple comparisons) in SPSS 20.0 (IBM Co., Somers, NY, USA).
3. Results
3.1. Clinical characteristics
Clinical data on patients are provided in Table 1. Simple motor tics were present in all patients during the time of assessment and premonitory urges preceded at least one of these tics in each patient. Mean disease duration was 26.5 (SD ± 8.5) years, mean YGTSS score was 42 (SD ± 16).
Table 1.
Demographic variables and clinical characteristics of patients. Abbreviations: + = present, − = absent, DCI = Diagnostic Confidence Index; YGTSS = Yale Global Tic Severity Scale; M = male; F = female.
| Subject |
Age |
Onset age |
Sex |
DCI |
YGTSS |
Motor tics |
Vocal tics |
||
|---|---|---|---|---|---|---|---|---|---|
| Simple | Complex | Simple | Complex | ||||||
| P01 | 33 | 12 | M | 63 | 46 | + | + | + | + |
| P02 | 23 | 6 | M | 61 | 57 | + | + | + | − |
| P03 | 29 | 3 | F | 68 | 30 | + | + | + | + |
| P04 | 27 | 7 | M | 68 | 31 | + | + | + | − |
| P05 | 22 | 10 | M | 47 | 26 | + | + | − | − |
| P06 | 39 | 12 | M | 100 | 77 | + | + | + | + |
| P07 | 31 | 12 | M | 37 | 18 | + | − | − | − |
| P08 | 54 | 13 | M | 57 | 49 | + | + | + | − |
| P09 | 28 | 6 | M | 50 | 44 | + | − | + | − |
| P10 | 42 | 3 | F | 76 | 42 | + | + | + | − |
| P11 | 45 | 11 | M | 64 | 35 | + | + | + | − |
| P12 | 29 | 3 | M | 54 | 36 | + | + | + | − |
| P13 | 34 | 6 | M | 52 | 56 | + | − | + | − |
| P14 | 38 | 11 | M | 45 | 22 | + | − | + | − |
| P15 | 43 | 5 | M | 67 | 60 | + | + | − | − |
3.2. Data quality and ROI characteristics
On visual inspection, no artifacts were detected on MRI data that would preclude further image analysis. Head movement was comparable between patients and controls: Median of absolute head displacement was 1.38 mm (controls) and 1.79 mm (patients), p = 0.389. Results from the univariate general linear model showed no significant interaction of “Group × ROI” (F = 1.52; p = 0.122; 11 degrees of freedom (DF)). There was also no significant “Group × ROI” interaction when using FA as depended variable (F = 1.47; p = 0.137; 11 DF) thus demonstrating comparability of FA values in ROIs in both groups.
3.3. Connectivity indices between cortical regions of interest
In total, 7920 CI values were measured. Mean CI values from both hemispheres are illustrated in Fig. 2. Connections between subcortical structures showed high connectivity values. Lowest CI values were measured in tracts connecting the orbitofrontal cortex to other cortical areas.
Fig. 2.
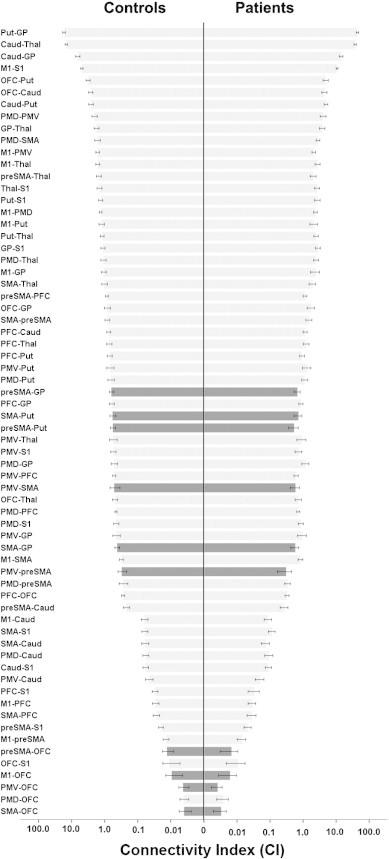
Pyramid plot of mean values of connectivity indices (CI) for controls (left) and patients (right). Bars in black demonstrate connections with significant group differences resulting from post-hoc tests (controls vs. patients). Error bars mark 95% confidence intervals. X-axis is log-transformed.
3.4. Group differences of connectivity values
All measured CI values were included into the multilevel model. Significant effects were detected for the two-way interactions of “Group × Tract” (F = 3.94; p < 0.001; 65 DF) indicating tract-specific differences between groups, and “Hemisphere Side × Tract” (F = 2.21; p < 0.001; 65 DF). There was no significant influence of the two-way interaction “Group × Hemisphere Side” (p = 0.848; 2 DF).
We conducted follow-up comparisons of the significant two-way interaction of “Group × Tract” and calculated group differences for individual tracts by means of percentage change (Fig. 3). After correction for multiple comparisons, significantly lower CI values were shown in the patient group for 10 tracts (Figs. 2, 3, 4 and Table 2). Of these, two were aberrant from existing known direct anatomical connections (SMA–pallidum and preSMA–pallidum) and have therefore been omitted from further analysis in association with clinical data (see Table 3). Overall, there were no tracts with significantly higher CI values for patients.
Fig. 3.
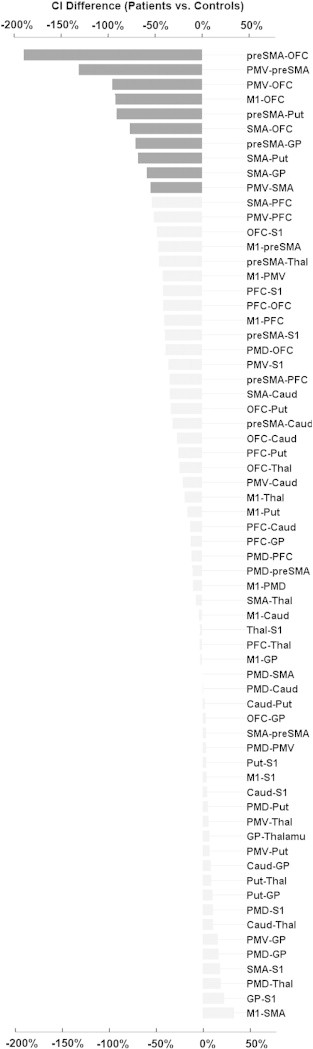
Relative differences of connectivity indices between patients and controls (in percent change). Negative values demonstrate lower connectivity in patients. Black bars signify connections with significant group differences resulting from post-hoc tests (controls vs. patients).
Fig. 4.
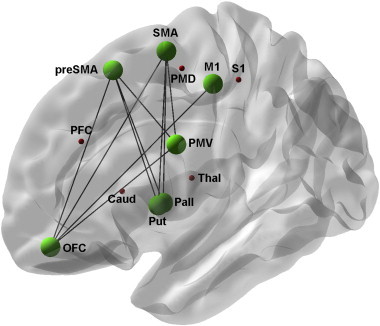
Simplified schematic overview of regions of interest included in the study. Green dots and lines show ROIs and tracts with significant group differences in connectivity indices resulting from post-hoc tests (controls vs. patients). For the purpose of illustration, mean results are shown on the left hemisphere.
Table 2.
Absolute differences of estimated means (controls–patients) for tracts with significant differences resulting from post-hoc tests (log-transformed values, Bonferroni-corrected, 95% confidence intervals are shown) Abbreviations: M1: Primary motor cortex; S1: Primary sensory cortex; PMV and PMD: Ventral and dorsal premotor cortex; SMA: Supplementary motor cortex; preSMA: Pre-supplementary motor cortex; PFC and OFC: Prefrontal and orbitofrontal cortex.
| Tract | Connectivity index | p-Value | |
|---|---|---|---|
| preSMA–OFC | 0.464 | (0.34–0.58) | < 0.000 |
| PMV–preSMA | 0.388 | (0.27–0.51) | < 0.000 |
| PMV–OFC | 0.305 | (0.18–0.43) | < 0.000 |
| preSMA–putamen | 0.285 | (0.16–0.41) | < 0.000 |
| preSMA–pallidum | 0.238 | (0.12–0.36) | 0.008 |
| M1–OFC | 0.315 | (0.19–0.44) | 0.000 |
| SMA–pallidum | 0.214 | (0.09–0.34) | 0.034 |
| SMA–putamen | 0.229 | (0.11–0.35) | 0.014 |
| SMA–OFC | 0.263 | (0.14–0.38) | 0.001 |
| PMV–SMA | 0.218 | (0.10–0.34) | 0.028 |
Table 3.
Spearman rank correlation of patient's mean Connectivity Indices with scores from clinical evaluation (YGTSS). Results are shown for selected tracts with significant group differences (patients vs. controls). Negative values demonstrate higher clinical severity associated with lower connectivity. P-values are uncorrected for multiple comparisons. Abbreviations: M1: Primary motor cortex; S1: Primary sensory cortex; PMV and PMD: Ventral and dorsal premotor cortex; SMA: Supplementary motor cortex; preSMA: Pre-supplementary motor cortex; PFC and OFC: Prefrontal and orbitofrontal cortex.
| Tract | r (95% CI) | p-Value | |
|---|---|---|---|
| PMV–SMA | − 0.25 | (− 0.74–0.35) | 0.376 |
| SMA–putamen | − 0.35 | (− 0.82–0.20) | 0.196 |
| PMV–preSMA | − 0.38 | (− 0.81–0.29) | 0.164 |
| SMA–OFC | − 0.38 | (− 0.79–0.13) | 0.164 |
| PMV–OFC | − 0.50 | (− 0.80–0.13) | 0.060 |
| preSMA–OFC | − 0.53 | (− 0.86–0.32) | 0.044 |
| preSMA–putamen | − 0.58 | (− 0.83–−0.15) | 0.024 |
| M1–OFC | − 0.73 | (− 0.88–−0.35) | 0.002 |
3.5. Correlation with clinical score
Correlations of YGTSS scores with individual tract CI values were analyzed for 10 white matter tracts based on significant results of group comparison. Significant negative associations were found for three tracts connecting M1 with OFC (R = − 0.73, p = 0.002), pre-SMA with putamen (R = − 0.58, p = 0.024) and pre-SMA with OFC (R = − 0.53, p = 0.044). p-Values were not significant following correction for multiple testing. Spearman rank correlation coefficients and p-values are summarized in Table 3.
4. Discussion
Using DTI tractography, we investigated intrahemispheric structural connectivity between regions involved in motor control in a well-defined group of adult GTS patients. They had significantly lower connectivity in comparison to healthy controls. These deficits were marked in tracts connecting frontal cortical areas with basal ganglia and in frontal cortico-cortical circuits. There was an overall trend towards negative correlations between structural connectivity and tic severity.
Tics are the defining clinical feature of GTS. Although their exact structural and functional neural basis remains elusive, involvement of dysfunctional networks including the frontal cortex and its connections to the basal ganglia has been proposed (Mink, 2001, 2006). In our patient group, connectivity indices were reduced between the pre-SMA/SMA and putamen probably reflecting reduced structural connectivity between these brain regions. Efferent projections from the pre-SMA and SMA to the striatum have been demonstrated in animal studies (Inase et al., 1999). In humans, distinct projections from both pre-SMA and SMA to the striatum have been shown in vivo by DTI-tractography (Lehericy et al., 2004). On the other hand, we also detected significantly reduced connectivity values between pre-SMA/SMA and the pallidum (Table 1) that cannot simply be explained by reduced structural connectivity between these regions, as there are no direct anatomical connections from cortical areas to the pallidum. These findings may result from alterations along polysynaptic neuronal connections that form elements of the cortico–striato–thalamocortical loop, which, however, cannot be further discriminated due to the general limitation of DTI fiber tracking.
Functionally, the pre-SMA and striatum are part of the neuronal circuitry involved in the generation and control of voluntary movements. The pre-SMA in particular plays a major role in motor inhibition (Hoffstaedter et al., 2013; Nachev et al., 2007). In a recent meta-analysis, Swick et al. emphasized the importance of the SMA/pre-SMA in the concept of inhibitory control of actions that are “out of context” (Swick et al., 2011). In GTS, SMA overactivity has been a recurring theme in functional imaging and electrophysiological studies. It has repeatedly been identified in GTS patients performing voluntary movements (Biswal et al., 1998) and related to sensory urges (Mantovani et al., 2007). Based on these findings one might expect increased structural connectivity of SMA as a reflection of increased activity. However, structural connectivity in this part of the cortico-subcortical circuit was reduced in our study. Both findings might be interpreted as signs of abnormal structural and functional organization and connection of frontal cortico-cortical circuits involving the SMA in GTS. One could speculate that reduced structural connectivity leads to a less focused and overall increased local brain activation in cortical areas.
In addition to supplementary motor areas, we also found decreased connectivity values in circuits involving the OFC. In healthy controls, both the OFC and dorsolateral prefrontal cortex have been implicated in successful inhibition of stimuli or impulses that are not relevant to a specific motor task (Berlin et al., 2004). The OFC is structurally heterogeneous and has widespread connections with prefrontal, limbic, sensory and premotor areas (Zald et al., in press). In GTS patients, metabolism in the OFC and a wide network of cortical and subcortical areas was reduced in positron-emission tomography (PET) studies (Braun et al., 1993). In keeping with these findings, connectivity was decreased in circuits connecting the OFC to pre-SMA, SMA and M1 in our patients. However, these data have to be interpreted with caution as anatomical data demonstrating connections between the OFC and premotor or motor areas are scarce. While there are some data from post-mortem anatomical studies demonstrating OFC–premotor-connections in the macaque monkey (Cavada et al., 2000), data on human OFC connectivity to motor and premotor areas is limited (Kringelbach and Rolls, 2004; Zald et al., in press). Altered connectivity values may thus also arise from changes in poly-synaptic connections between these areas that cannot be resolved by DTI tractography. Moreover, all of the significantly altered connections involving the OFC clustered at the end of lowest connectivity values and may thus be more susceptible to errors resulting from confounding influences from image acquisition and postprocessing.
We studied adult GTS patients with mean disease duration of 27 years. This raises the question of whether the observed changes reflect a primary disease marker or adaptive plasticity during the course of the disease. With regard to this question, the observed correlation between structural abnormalities and clinical parameters points towards the interpretation of decreased structural connectivity being part of the primary pathophysiology of GTS. There was an overall trend towards negative correlations between connection strength and YGTSS in tracts showing significant group differences of connectivity (Table 3). However, these results have to be considered exploratory since they were not based on clear hypotheses and we did not apply corrections for multiple comparisons of correlation values.
To our knowledge, this is the first study assessing structural brain connectivity in adult GTS patients using DTI-tractography. Applying a similar technique, Makki et al. investigated the structural integrity of fronto–striato–thalamic circuit in 18 children with GTS (Makki et al., 2009) demonstrating significantly lower connectivity values between the caudate and frontal areas in the left hemisphere in line with the observation of reduced connectivity of motor areas in our study.
Connectivity as measured by DTI-tractography relates to structural properties of large white matter tracts such as the degree of myelination, number of axons, degree of axonal pruning and the cohesiveness or truncation of axons (Danielian et al., 2010; Le Bihan and Johansen-Berg, 2012). In the current study, reduced connectivity values were demonstrated in almost two-thirds of all connections pointing towards a disruption in the organization of neural networks engaged in movement generation and control. Our findings are in line with other studies showing myelination abnormalities in widespread brain areas shown by diffusion imaging in GTS (Draganski et al., 2010; Neuner et al., 2010).
During brain development, increases of myelination have been proposed to cause increases of fractional anisotropy (FA) (Zanin et al., 2011) probably due to a combination of increased axonal density and myelination (Beaulieu, 2002). Since both factors significantly influence outcome of DTI tractography algorithms, the reduced connectivity shown in our patient group could reflect delayed or incomplete maturation of white matter tracts specifically noticeable in frontal cortico-cortical and striato-cortical circuits.
Supporting the developmental theory of GTS, post-mortem neuropathological studies have suggested disturbed maturation processes leading to imbalances of neuronal distribution in the basal ganglia in these patients (Kalanithi et al., 2005). Resting-state functional imaging studies have recently lend support to the concept of GTS as a disorder of brain immaturity in distinct neuronal circuits: Findings from a study by Church et al. suggest that functional communication between cortical areas of patients with GTS resembles that of younger children (Church et al., 2009). Specifically, functional “under”-connectivity between long-distant cortical areas and “over”-communication between adjacent areas was shown in fronto-parietal and cingular-opercular task control networks. Similarly, graph theoretical measures from resting-state functional networks have pointed to a disorganization and “functional immaturity” of sensorimotor and pre-motor pathways of adult GTS patients (Worbe et al., 2012). We propose the apparent and widespread structural connectivity deficit in our GTS patients to be a structural correlate of abnormal, immature, or delayed brain development. However, a direct comparison between our results and studies of functional imaging is difficult due to the absence of a common framework in terms of network definition and performance parameters. Future studies combining structural and functional imaging are therefore highly desirable to elucidate the complex interplay between functional and structural brain connectivity in GTS patients.
There are several limitations of our study. Due to its cross-sectional character, we could not observe progression of structural changes that would allow insights into the course of primary neurodevelopmental deficit or a secondary compensatory mechanism. Moreover, in this analysis, we focused on an intrahemispheric network between cortical areas, i.e. disregarded interhemispheric commissural pathways via the corpus callosum. This was mainly done for methodological reasons as probabilistic tracking of transcallosal pathways still carries some unresolved problems, and the combination of tracking results of both intra- and interhemispheric pathways brings about further statistical problems of dependency which cannot easily be solved in the chosen statistical model. Moreover, alterations of interhemispheric pathways in GTS have already been demonstrated by changes of volume and structural integrity of the corpus callosum (Plessen et al., 2009) and alterations of interhemispheric connectivity using combined transcranial magnetic stimulation and DTI (Baumer et al., 2010). Future studies should aim at combining intra- and interhemispheric connectivity analysis of both structural and functional measures of connectivity to get a more comprehensive view of alterations of brain connectivity in GTS.
5. Conclusion
DTI-tractography demonstrated decreased structural connectivity in cortico-subcortical and frontal cortico-cortical networks involved in planning, controlling and execution of actions in GTS patients which was associated with tic severity. This is in line with the concept of GTS as a prototype neurodevelopmental disorder of brain immaturity leading to problems with motor and behavior control.
Acknowledgments
Bastian Cheng and Götz Thomalla had full access to all of the data in the study and take responsibility for the integrity of the data and the accuracy of the data analysis.
This work was funded by the German Research Foundation (Deutsche Forschungsgemeinschaft, DFG), grant numbers MU1692/2-1 (to Alexander Münchau) and F168-1 (to Götz Thomalla). This work was supported by the DFG, Sonderforschungsbereich (SFB) 936, Project C2.
Footnotes
This is an open-access article distributed under the terms of the Creative Commons Attribution-NonCommercial-No Derivative Works License, which permits non-commercial use, distribution, and reproduction in any medium, provided the original author and source are credited.
Authors' conflict disclosure: no conflicts of interest.
References
- Aron A.R. Stop-signal inhibition disrupted by damage to right inferior frontal gyrus in humans. Nat. Neurosci. 2003;6:115–116. doi: 10.1038/nn1003. [DOI] [PubMed] [Google Scholar]
- Baumer T. Interhemispheric motor networks are abnormal in patients with Gilles de la Tourette syndrome. Mov. Disord. 2010;25:2828–2837. doi: 10.1002/mds.23418. [DOI] [PubMed] [Google Scholar]
- Beaulieu C. The basis of anisotropic water diffusion in the nervous system —a technical review. NMR Biomed. 2002;15:435–455. doi: 10.1002/nbm.782. [DOI] [PubMed] [Google Scholar]
- Behrens T.E. Characterization and propagation of uncertainty in diffusion-weighted MR imaging. Magn. Reson. Med. 2003;50:1077–1088. doi: 10.1002/mrm.10609. [DOI] [PubMed] [Google Scholar]
- Behrens T.E. Probabilistic diffusion tractography with multiple fibre orientations: what can we gain? Neuroimage. 2007;34:144–155. doi: 10.1016/j.neuroimage.2006.09.018. [DOI] [PMC free article] [PubMed] [Google Scholar]
- Berlin H.A., Rolls E.T., Kischka U. Impulsivity, time perception, emotion and reinforcement sensitivity in patients with orbitofrontal cortex lesions. Brain. 2004;127:1108–1126. doi: 10.1093/brain/awh135. [DOI] [PubMed] [Google Scholar]
- Binkofski F. Supramodal representation of objects and actions in the human inferior temporal and ventral premotor cortex. Cortex. 2004;40:159–161. doi: 10.1016/s0010-9452(08)70933-x. [DOI] [PubMed] [Google Scholar]
- Biswal B. Abnormal cerebral activation associated with a motor task in Tourette syndrome. AJNR Am. J. Neuroradiol. 1998;19:1509–1512. [PMC free article] [PubMed] [Google Scholar]
- Braun A.R. The functional neuroanatomy of Tourette's syndrome: an FDG-PET study. I. Regional changes in cerebral glucose metabolism differentiating patients and controls. Neuropsychopharmacology. 1993;9:277–291. doi: 10.1038/npp.1993.64. [DOI] [PubMed] [Google Scholar]
- Bronfeld M., Bar-Gad I. Tic disorders: what happens in the basal ganglia? Neuroscientist. 2013;19:101–108. doi: 10.1177/1073858412444466. [DOI] [PubMed] [Google Scholar]
- Brown H., Prescott R. 2 edition. Wiley; 2006. Applied Mixed Models in Medicine. [Google Scholar]
- Cavada C. The anatomical connections of the macaque monkey orbitofrontal cortex. A review. Cereb. Cortex. 2000;10:220–242. doi: 10.1093/cercor/10.3.220. [DOI] [PubMed] [Google Scholar]
- Church J.A. Control networks in paediatric Tourette syndrome show immature and anomalous patterns of functional connectivity. Brain. 2009;132:225–238. doi: 10.1093/brain/awn223. [DOI] [PMC free article] [PubMed] [Google Scholar]
- Danielian L.E. Reliability of fiber tracking measurements in diffusion tensor imaging for longitudinal study. Neuroimage. 2010;49:1572–1580. doi: 10.1016/j.neuroimage.2009.08.062. [DOI] [PMC free article] [PubMed] [Google Scholar]
- Draganski B. Multispectral brain morphometry in Tourette syndrome persisting into adulthood. Brain. 2010;133:3661–3675. doi: 10.1093/brain/awq300. [DOI] [PMC free article] [PubMed] [Google Scholar]
- Duncan J., Owen A.M. Common regions of the human frontal lobe recruited by diverse cognitive demands. Trends Neurosci. 2000;23:475–483. doi: 10.1016/s0166-2236(00)01633-7. [DOI] [PubMed] [Google Scholar]
- Eapen V. Prevalence of tics and Tourette syndrome in an inpatient adult psychiatry setting. J. Psychiatry Neurosci. 2001;26:417–420. [PMC free article] [PubMed] [Google Scholar]
- Eickhoff S. High-resolution MRI reflects myeloarchitecture and cytoarchitecture of human cerebral cortex. Hum. Brain Mapp. 2005;24:206–215. doi: 10.1002/hbm.20082. [DOI] [PMC free article] [PubMed] [Google Scholar]
- Ganos C., Roessner V., Munchau A. The functional anatomy of Gilles de la Tourette syndrome. Neurosci. Biobehav. Rev. 2012;37(6):1050–1062. doi: 10.1016/j.neubiorev.2012.11.004. [DOI] [PubMed] [Google Scholar]
- Germann J. Precentral sulcal complex of the human brain: morphology and statistical probability maps. J. Comp. Neurol. 2005;493:334–356. doi: 10.1002/cne.20820. [DOI] [PubMed] [Google Scholar]
- Geyer S. The microstructural border between the motor and the cognitive domain in the human cerebral cortex. Adv. Anat. Embryol. Cell Biol. 2004;174(I-VIII):1–89. doi: 10.1007/978-3-642-18910-4. [DOI] [PubMed] [Google Scholar]
- Geyer S. Functional neuroanatomy of the primate isocortical motor system. Anat. Embryol. (Berl) 2000;202:443–474. doi: 10.1007/s004290000127. [DOI] [PubMed] [Google Scholar]
- Govindan R.M. Abnormal water diffusivity in corticostriatal projections in children with Tourette syndrome. Hum. Brain Mapp. 2010;31:1665–1674. doi: 10.1002/hbm.20970. [DOI] [PMC free article] [PubMed] [Google Scholar]
- Hoffstaedter F. The “what” and “when” of self-initiated movements. Cereb. Cortex. 2013;23:520–530. doi: 10.1093/cercor/bhr391. [DOI] [PMC free article] [PubMed] [Google Scholar]
- Hyde T.M. Cerebral morphometric abnormalities in Tourette's syndrome: a quantitative MRI study of monozygotic twins. Neurology. 1995;45:1176–1182. doi: 10.1212/wnl.45.6.1176. [DOI] [PubMed] [Google Scholar]
- Inase M. Corticostriatal and corticosubthalamic input zones from the presupplementary motor area in the macaque monkey: comparison with the input zones from the supplementary motor area. Brain Res. 1999;833:191–201. doi: 10.1016/s0006-8993(99)01531-0. [DOI] [PubMed] [Google Scholar]
- Jankovic J. Tourette syndrome. Phenomenology and classification of tics. Neurol. Clin. 1997;15:267–275. doi: 10.1016/s0733-8619(05)70311-x. [DOI] [PubMed] [Google Scholar]
- Jenkinson M., Smith S. A global optimisation method for robust affine registration of brain images. Med Image Anal. 2001;5:143–156. doi: 10.1016/s1361-8415(01)00036-6. [DOI] [PubMed] [Google Scholar]
- Johansen-Berg H., Behrens T.E. Just pretty pictures? What diffusion tractography can add in clinical neuroscience. Curr. Opin. Neurol. 2006;19:379–385. doi: 10.1097/01.wco.0000236618.82086.01. [DOI] [PMC free article] [PubMed] [Google Scholar]
- Johansen-Berg H. Changes in connectivity profiles define functionally distinct regions in human medial frontal cortex. Proc. Natl. Acad. Sci. U. S. A. 2004;101:13335–13340. doi: 10.1073/pnas.0403743101. [DOI] [PMC free article] [PubMed] [Google Scholar]
- Kalanithi P.S. Altered parvalbumin-positive neuron distribution in basal ganglia of individuals with Tourette syndrome. Proc. Natl. Acad. Sci. U. S. A. 2005;102:13307–13312. doi: 10.1073/pnas.0502624102. [DOI] [PMC free article] [PubMed] [Google Scholar]
- Kringelbach M.L., Rolls E.T. The functional neuroanatomy of the human orbitofrontal cortex: evidence from neuroimaging and neuropsychology. Prog. Neurobiol. 2004;72:341–372. doi: 10.1016/j.pneurobio.2004.03.006. [DOI] [PubMed] [Google Scholar]
- Le Bihan D., Johansen-Berg H. Diffusion MRI at 25: exploring brain tissue structure and function. Neuroimage. 2012;61:324–341. doi: 10.1016/j.neuroimage.2011.11.006. [DOI] [PMC free article] [PubMed] [Google Scholar]
- Leckman J.F. The Yale Global Tic Severity Scale: initial testing of a clinician-rated scale of tic severity. J. Am. Acad. Child Adolesc. Psychiatry. 1989;28:566–573. doi: 10.1097/00004583-198907000-00015. [DOI] [PubMed] [Google Scholar]
- Lehericy S. 3-D diffusion tensor axonal tracking shows distinct SMA and pre-SMA projections to the human striatum. Cereb. Cortex. 2004;14:1302–1309. doi: 10.1093/cercor/bhh091. [DOI] [PubMed] [Google Scholar]
- Makki M.I. Altered fronto–striato–thalamic connectivity in children with Tourette syndrome assessed with diffusion tensor MRI and probabilistic fiber tracking. J. Child Neurol. 2009;24:669–678. doi: 10.1177/0883073808327838. [DOI] [PubMed] [Google Scholar]
- Maldjian J.A. An automated method for neuroanatomic and cytoarchitectonic atlas-based interrogation of fMRI data sets. Neuroimage. 2003;19:1233–1239. doi: 10.1016/s1053-8119(03)00169-1. [DOI] [PubMed] [Google Scholar]
- Mantovani A. Repetitive transcranial magnetic stimulation of the supplementary motor area in the treatment of Tourette syndrome: report of two cases. Clin. Neurophysiol. 2007;118:2314–2315. doi: 10.1016/j.clinph.2007.07.011. [DOI] [PubMed] [Google Scholar]
- McNaught K.S., Mink J.W. Advances in understanding and treatment of Tourette syndrome. Nat. Rev. Neurol. 2011;7:667–676. doi: 10.1038/nrneurol.2011.167. [DOI] [PubMed] [Google Scholar]
- Mink J.W. Neurobiology of basal ganglia circuits in Tourette syndrome: faulty inhibition of unwanted motor patterns? Adv. Neurol. 2001;85:113–122. [PubMed] [Google Scholar]
- Mink J.W. Neurobiology of basal ganglia and Tourette syndrome: basal ganglia circuits and thalamocortical outputs. Adv. Neurol. 2006;99:89–98. [PubMed] [Google Scholar]
- Muller-Vahl K.R. Prefrontal and anterior cingulate cortex abnormalities in Tourette syndrome: evidence from voxel-based morphometry and magnetization transfer imaging. BMC Neurosci. 2009;10:47. doi: 10.1186/1471-2202-10-47. [DOI] [PMC free article] [PubMed] [Google Scholar]
- Nachev P. The role of the pre-supplementary motor area in the control of action. Neuroimage. 2007;36(Suppl. 2):T155–T163. doi: 10.1016/j.neuroimage.2007.03.034. [DOI] [PMC free article] [PubMed] [Google Scholar]
- Neuner I. White-matter abnormalities in Tourette syndrome extend beyond motor pathways. Neuroimage. 2010;51:1184–1193. doi: 10.1016/j.neuroimage.2010.02.049. [DOI] [PubMed] [Google Scholar]
- Newton J.M. Non-invasive mapping of corticofugal fibres from multiple motor areas—relevance to stroke recovery. Brain. 2006;129:1844–1858. doi: 10.1093/brain/awl106. [DOI] [PMC free article] [PubMed] [Google Scholar]
- Peterson B.S. Basal ganglia volumes in patients with Gilles de la Tourette syndrome. Arch. Gen. Psychiatry. 2003;60:415–424. doi: 10.1001/archpsyc.60.4.415. [DOI] [PubMed] [Google Scholar]
- Picard N., Strick P.L. Imaging the premotor areas. Curr. Opin. Neurobiol. 2001;11:663–672. doi: 10.1016/s0959-4388(01)00266-5. [DOI] [PubMed] [Google Scholar]
- Plessen K.J., Bansal R., Peterson B.S. Imaging evidence for anatomical disturbances and neuroplastic compensation in persons with Tourette syndrome. J. Psychosom. Res. 2009;67:559–573. doi: 10.1016/j.jpsychores.2009.07.005. [DOI] [PMC free article] [PubMed] [Google Scholar]
- Prodoehl J. Region of interest template for the human basal ganglia: comparing EPI and standardized space approaches. Neuroimage. 2008;39:956–965. doi: 10.1016/j.neuroimage.2007.09.027. [DOI] [PMC free article] [PubMed] [Google Scholar]
- Ramnani N. The primate cortico-cerebellar system: anatomy and function. Nat. Rev. Neurosci. 2006;7:511–522. doi: 10.1038/nrn1953. [DOI] [PubMed] [Google Scholar]
- Smith S.M. Advances in functional and structural MR image analysis and implementation as FSL. Neuroimage. 2004;23(Suppl. 1):S208–S219. doi: 10.1016/j.neuroimage.2004.07.051. [DOI] [PubMed] [Google Scholar]
- Smith S.M. Tract-based spatial statistics: voxelwise analysis of multi-subject diffusion data. Neuroimage. 2006;31:1487–1505. doi: 10.1016/j.neuroimage.2006.02.024. [DOI] [PubMed] [Google Scholar]
- Sowell E.R. Thinning of sensorimotor cortices in children with Tourette syndrome. Nat. Neurosci. 2008;11:637–639. doi: 10.1038/nn.2121. [DOI] [PMC free article] [PubMed] [Google Scholar]
- Swick D., Ashley V., Turken U. Are the neural correlates of stopping and not going identical? Quantitative meta-analysis of two response inhibition tasks. Neuroimage. 2011;56:1655–1665. doi: 10.1016/j.neuroimage.2011.02.070. [DOI] [PubMed] [Google Scholar]
- Thomalla G. Structural changes in the somatosensory system correlate with tic severity in Gilles de la Tourette syndrome. Brain. 2009;132:765–777. doi: 10.1093/brain/awn339. [DOI] [PubMed] [Google Scholar]
- Tomassini V. Diffusion-weighted imaging tractography-based parcellation of the human lateral premotor cortex identifies dorsal and ventral subregions with anatomical and functional specializations. J. Neurosci. 2007;27:10259–10269. doi: 10.1523/JNEUROSCI.2144-07.2007. [DOI] [PMC free article] [PubMed] [Google Scholar]
- Worbe Y. Distinct structural changes underpin clinical phenotypes in patients with Gilles de la Tourette syndrome. Brain. 2010;133:3649–3660. doi: 10.1093/brain/awq293. [DOI] [PubMed] [Google Scholar]
- Worbe Y. Functional immaturity of cortico-basal ganglia networks in Gilles de la Tourette syndrome. Brain. 2012;135:1937–1946. doi: 10.1093/brain/aws056. [DOI] [PubMed] [Google Scholar]
- Yap P.T. Development trends of white matter connectivity in the first years of life. PLoS One. 2011;6:e24678. doi: 10.1371/journal.pone.0024678. [DOI] [PMC free article] [PubMed] [Google Scholar]
- Yoon D.Y. Frontal dopaminergic abnormality in Tourette syndrome: a postmortem analysis. J. Neurol. Sci. 2007;255:50–56. doi: 10.1016/j.jns.2007.01.069. [DOI] [PubMed] [Google Scholar]
- Zald D.H. Meta-Analytic Connectivity Modeling Reveals Differential Functional Connectivity of the Medial and Lateral Orbitofrontal Cortex. Cereb. Cortex. 2012 doi: 10.1093/cercor/bhs308. (in press) [DOI] [PMC free article] [PubMed] [Google Scholar]
- Zanin E. White matter maturation of normal human fetal brain. An in vivo diffusion tensor tractography study. Brain Behav. 2011;1:95–108. doi: 10.1002/brb3.17. [DOI] [PMC free article] [PubMed] [Google Scholar]
- Zhang Y., Brady M., Smith S. Segmentation of brain MR images through a hidden Markov random field model and the expectation–maximization algorithm. IEEE Trans. Med. Imaging. 2001;20:45–57. doi: 10.1109/42.906424. [DOI] [PubMed] [Google Scholar]