

Abstract
Cerebrovascular reactivity is the change in cerebral blood flow in response to a vasodilatory or vasoconstrictive stimulus. Measuring variations of cerebrovascular reactivity between different regions of the brain has the potential to not only advance understanding of how the cerebral vasculature controls the distribution of blood flow but also to detect cerebrovascular pathophysiology. While there are standardized and repeatable methods for estimating the changes in cerebral blood flow in response to a vasoactive stimulus, the same cannot be said for the stimulus itself. Indeed, the wide variety of vasoactive challenges currently employed in these studies impedes comparisons between them. This review therefore critically examines the vasoactive stimuli in current use for their ability to provide a standard repeatable challenge and for the practicality of their implementation. Such challenges include induced reductions in systemic blood pressure, and the administration of vasoactive substances such as acetazolamide and carbon dioxide. We conclude that many of the stimuli in current use do not provide a standard stimulus comparable between individuals and in the same individual over time. We suggest that carbon dioxide is the most suitable vasoactive stimulus. We describe recently developed computer-controlled MRI compatible gas delivery systems which are capable of administering reliable and repeatable vasoactive CO2 stimuli.
 |
Jorn Fierstra is currently enrolled in a neurosurgical training program at the University Medical Center Zürich, Switzerland. His PhD degree from Utrecht University, was based on research done in the Department of Neurosurgery, Neuroradiology and Anesthesiology of the University Health Network, Toronto, Canada, and he recently received an MD degree from Utrecht University, the Netherlands. His research interests include clinical investigations of cerebral vasculature pathophysiology and fMRI related research. Olivia Sobczyk is currently a PhD student in the Institute of Medical Science at the University of Toronto and the University Health Network, Toronto, Canada. She obtained her MSc in Biomedical Physics from Ryerson University, Toronto, Canada. Her research interests include mathematical modeling and investigation in cerebral hemodynamic processes, specifically cerebral vascular reactivity, and clinical investigation in the application of functioning imaging tools to investigate neurological disorders.
Introduction
Cerebral blood flow (CBF) is carefully regulated to provide nutrients and oxygen to the various regions of the brain. Metabolic coupling mechanisms ensure that blood flow is increased in active regions (Iadecola & Nedergaard, 2007; Attwell et al. 2011; Paulson et al. 2011), and autoregulation ensures that blood flow is maintained in the face of changes in perfusion pressure (Lucas et al. 2010). The cerebral vasculature also responds to carbon dioxide and hypoxia (Kety & Schmidt, 1948; Mardimae et al. 2012). The action of these various factors serves to control the distribution of cerebral blood flow. One of the ways investigators have probed the regulation of cerebral blood flow and its distribution is to challenge the system with a vasoactive stimulus and observe the response. Such experiments measure the cerebrovascular reactivity (CVR), the change in CBF per change in vasoactive stimulus.
For example, recent studies using trans-cranial Doppler (TCD) measurements of CBF and carbon dioxide (CO2) as a vasoactive stimulus have found differences in CVR between the major cerebral arteries (Sato et al. 2012; Willie et al. 2012). And, as Fig. 1 shows, maps of CVR obtained from blood oxygen level-dependent (BOLD) magnetic resonance imaging (MRI), which is used as a surrogate for cerebral blood flow, can detect inhomogeneities in the distribution of cerebral blood flow. The BOLD signal is degraded in proportion to the concentration of deoxyhaemoglobin in a voxel. It represents the net balance between O2 delivery and O2 consumption. At physiological levels of tissue blood flows, the BOLD signal and blood flow approximate a linear relationship (assuming O2 consumption is constant). Measuring variations of cerebrovascular reactivity between different regions of the brain has the potential to not only advance understanding of how the cerebral vasculature controls blood flow and its distribution but also to detect cerebrovascular pathophysiology (e.g. Mandell et al. 2011).
Figure 1. Example CVR maps.
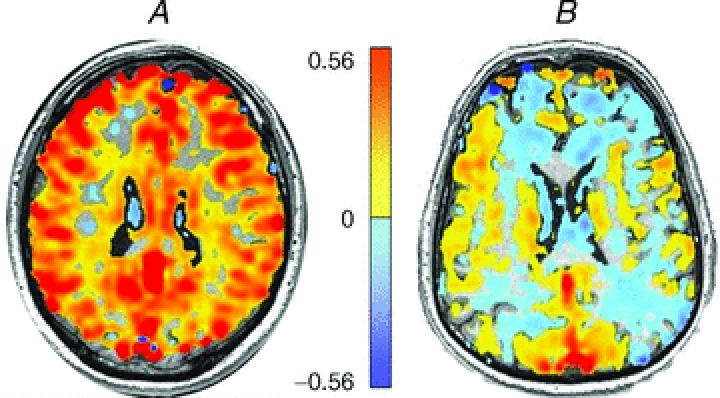
CVR is the ratio of the change in the BOLD-MRI signal in response to a change in CO2 stimulus, and is colour coded voxel by voxel according to the scale provided in the colour bar, and superimposed on the corresponding voxel of the anatomical scan. A, CVR map measured in a healthy volunteer. B, CVR map measured in a patient with moya moya disease. Although the hypercapnic stimulus was the same in each subject, the distribution of the changes in blood flow in the patient with moya moya disease revealed multiple areas of reduced cerebrovascular reactivity in response to the global vasodilatory stimulus. These regions of reduced CVR are the result of vascular steal, where stimulus-induced reductions in flow resistance result in flow diversion from regions of low to high vasodilatory reactivity.
However, currently published CVR studies use different combinations of vasoactive stimuli and measures of CBF, generating results that are difficult to compare. Although the methods of measuring CBF differ in their sensitivity, specificity, and spatial and temporal resolution, each does, nevertheless, generate highly repeatable and specific measures (see Wintermark et al. 2005 for review). The same cannot be said of the vasoactive stimulus. The many vasoactive stimuli that have been used to increase CBF generate results that are difficult to compare between studies. Even within a single method, the vasodilatory effect is seldom uniform, repeatable, or even quantifiable. It is this inability to standardize the vasoactive stimulus, or alternatively, precisely and accurately measure the stimulus at the active site, that has most impeded comparison of CVR between various studies, and between individuals in the same study.
We therefore set out to survey vasoactive stimuli used to generate CVR measures. We conclude that CO2 is the most appropriate stimulus in terms of its practicality of use and ability to be standardized. Since CBF responds to arterial CO2 tension, we review methods of controlling the arterial partial pressure of CO2 ( ), specifically commenting on their anticipated advantages and limitations used for making CVR measurements. We then present a detailed description of an automated prospective method of targeting
  developed in our laboratory. We note that the various methodologies for controlling
  are complex and require some knowledge of respiratory physiology in order to appreciate the subtleties involved. Accordingly, we provide an Appendix containing a brief glossary and summary of the basic principles of respiratory physiology pertinent to the control of CO2 as a vasoactive stimulus.
Vasodilatory challenges
The main types of vasoactive stimuli
To measure CVR, three types of vasodilatory challenges have been utilized: (1) the application of a transient reduction in mean arterial blood pressure (MacKenzie et al. 1979), (2) the injection of an exogenous chemical (e.g. acetazolamide; Vorstrup et al. 1986) and (3) an increase in  (e.g. Poulin et al. 1996). The ease of use of each method as a standardized stimulus is assessed in the following sections.
Systemic blood pressure as a stimulus
At first glance, a reduction in systemic blood pressure (Panerai, 1998) appears to be the ideal vasodilatory challenge for testing the basic autoregulatory response of the cerebral vasculature. However, the induction of a safe, titratable and repeatable hypotensive stimulus is challenging. Inducing hypotension by administering vasodilators makes it difficult to separate the vascular effects resulting from autoregulation and those resulting from the direct effect of vasodilators (Artru & Colley, 1984) Abrupt thigh cuff release (single step change in blood pressure; Aaslid et al. 1989) and lower body negative pressure (cyclic changes in blood pressure; Tan, 2012) are designed to examine dynamic cerebral autoregulation. Tan et al. (2012), for example, examine the loss of coherence between arterial pressure changes and TCD signal changes as an index of autoregulation. However, these methods reduce blood pressure through a reduction in venous return and effectively central blood volume. The extent of the ensuing hypotension in healthy subjects is variable (Mahony et al. 2000), and is expected to be more variable if performed in patients over a range of ages, with multiple underlying co-morbidities and taking an array of medication. Hypotensive provocation would also be a concern for patients at risk of hypotension-induced ischaemia such as those with already haemodynamically precarious regional brain blood flow (Symon, 1969; Mandell et al. 2008).
Hypotension vs. chemical stressors
These considerations regarding hypotension have resulted in a preference for the administration of chemical cerebral vasodilators to test vasodilatory reserve in clinical studies. To do so, investigators had to address the concern that the mechanism of vasodilatation due to autoregulation may not be the same as for a chemical stimulus such as acetazolamide (ACZ) or CO2 (Lundar et al. 1985) The conclusion of studies performed over the last half-century is that regardless of the underlying mechanisms, cerebrovasodilators and pressure autoregulation draw on the same vasodilatory reserve (Symon, 1968; Nishimura et al. 1999). Reductions in perfusion pressure, resulting in autoregulatory vasodilatation, progressively dampen both the vasoconstrictor (Artru & Colley, 1984) and vasodilatory responses to CO2 in dogs (Harper, 1965) and humans (Vorstrup et al. 1986; Ringelstein et al. 1992; Nishimura et al. 1999). Overall, these studies indicate that chemical stimuli, and in particular hypercapnia, are suitable for interrogating the brain vasculature for regions with limited vasodilatory capacity.
Exogenous chemical acetazolamide as a stimulus
In 1986, Vorstrup et al. (1986) introduced the use of intravenous administration of 1 g of the carbonic anhydrase inhibitor ACZ as a maximal vasodilatory stimulus for measuring CVR. Indeed, ACZ continues to be the most widely applied stimulus for cerebral vasodilatation in a clinical setting and is used with TCD (Ringelstein et al. 1992; Gur et al. 1996), 133Xe enhanced-CT (Yonas et al. 1993), single positron emission computed tomography (SPECT), (Hasegawa & Yamaguchi, 1993; Kuroda et al. 2001) and BOLD MRI (Asghar et al. 2011). ACZ administration produces an extracellular and intracellular acidosis resulting in the relaxation of vascular smooth muscle. The advantages claimed for ACZ as a cerebral vasodilator are the simplicity of a single dose injection (Okazawa et al. 2001), its reproducibility independent of subject cooperation, and its high safety profile.
However, a standardized dose of ACZ does not generate the reproducible stimulus required for standardizing CVR measurement. First, there is considerable individual variability in the response to ACZ; both the serum ACZ concentrations for a given dose, and the cerebrovascular responses to a given serum level, vary between subjects. These unpredictable and uncontrollable influences prevent a reproducible stimulus–response relationship. It has been suggested that the best way to standardize the use of ACZ for CVR is to give a large enough dose to obtain a maximal CBF response. However, this approach also poses difficulties as there are large inter-subject variations in ACZ's time to peak effect, duration of action, and elimination rate. While a single 1 g dose of ACZ, is assumed to provide a supramaximal stimulus (Ringelstein et al. 1992; Okazawa et al. 2001), this single dose does not reliably produce a maximum CBF if it is less than 15 mg kg−1 (Dahl et al. 1995; Grossmann & Koeberle, 2000). Even with an effective supramaximal ACZ dose, CBF continues to respond to ventilation-induced changes in  and to changes in blood pressure (Vorstrup et al. 1986); both are confounding factors affecting CBF. Second, doses in the 15 mg kg−1 range are associated with a high incidence of side-effects, including dizziness, nausea, vomiting, headache, malaise and neurological symptoms related to ischaemia (Dahl et al. 1995; Grossmann & Koeberle, 2000). Even at lower doses there are symptomatic complaints following ACZ in 40–60% of subjects (Ringelstein et al. 1992; Saito et al. 2011). A major disadvantage of ACZ is that in case of adverse events or subject discomfort the effects are not easily terminated. Altogether, these issues limit the desirability of ACZ as a vasoactive stimulus. An alternative stimulus is needed. On the basis that CVR measures using CO2 are similar to those using ACZ, (Markus & Harrison, 1992; Ringelstein et al. 1992; Gooskens et al. 2003), it is reasonable to consider CO2 as a suitable candidate for the vasodilatory stimulus.
Carbon dioxide as a stimulus
CO2 as a vasodilatory stimulus has many advantages. Increases in  raise CBF by about 3% (Fortune et al. 1992) or more under hypoxic conditions (Poulin et al. 2002), and in contrast to intravenously injected ACZ, the administration of CO2 is non-invasive and easily terminated. CBF closely follows changes in
  for TCD measurements of the middle cerebral artery flow velocity (Poulin et al. 1996), and even faster for BOLD MRI measures as we show later. The physiological mechanisms of vasodilatation with CO2 have been reviewed (Brian, 1998). Moderate hypercapnia with end-tidal
  (
( ) controlled at tensions between 40 and 50 mmHg is well tolerated by conscious humans (Steinback et al. 2009; Spano et al. 2012). Furthermore, CO2 administration is safe even in critically ill patients, and even when applied for prolonged periods (e.g. weeks; Feihl & Perret, 1994; O’croinin et al. 2005). A further indication of the safety of hypercapnia comes from case reports of accidental extreme hypercapnia; patients have recovered from
  values exceeding 200 mmHg without adverse neurological sequellae after nothing more than restoration of normal ventilation (Potkin & Swenson, 1992; Ayas et al. 1998).
Despite these advantages, few clinical studies have considered using CO2 as the vasoactive stimulus and its use is mostly in laboratory studies. One of the reasons cited against using CO2 is that changing  requires some type of ventilatory manoeuvre such as breath-holding or voluntary hyperventilation, and therefore some cooperation from the subject, as opposed to ACZ, which can simply be injected intravenously. Furthermore, the perception is that the extent of the stimulus cannot be as easily regulated as drug dosing. Indeed, this latter difficulty in controlling
  has been an incentive to develop new technology for targeting and maintaining
  tension.
Whether to use hypocapnia or hypercapnia is the first consideration. Hypocapnia has a vasoconstrictive effect on the brain vasculature, thereby reducing cerebral blood flow (Raichle & Plum, 1972) and has been used for CVR mapping (Bright et al. 2009). However, Ringelstein et al. (1988, 1992) induced hypocapnia for clinical CVR testing by hyperventilation in patients with an occlusion of the internal carotid artery and found that, in comparison with a hypercapnic stimulus and acetazolamide, hypocapnia led to a relatively blunted response of CVR. Furthermore, a hypocapnic manoeuvre for CVR testing in subjects with traumatic brain injury led to an even more heterogeneous response (Steiner et al. 2005). It also seems counterintuitive to reduce CBF by hyperventilation for identifying patients at risk for cerebral ischaemia. Therefore, a hypercapnic vasodilatory stimulus is more often applied for clinical CVR examinations. Before describing these new approaches for controlling  , we review specific methods employed in recently published studies to produce hypercapnia. Please refer to the Appendix for an explanation of the terms and respiratory physiology involved.
Hypercapnia
Breath-holding
One of the earliest methods used to induce hypercapnia was breath-holding to prevent CO2 elimination, which results in a progressive increase in  with time. The use of breath-holding for CVR measurement was first demonstrated by Ratnatunga & Adiseshiah (1990), used clinically with TCD measurements of blood velocity to assess the risk of stroke in symptomatic patients with carotid artery disease (Markus & Harrison, 1992; Kastrup et al. 1999, 2001; Silvestrini et al. 1999, 2000; Vernieri et al. 1999). In these studies, breath-holding time was taken as an indicator of the strength of the vasoactive stimulus and used to normalize the change in CBF signal for stimulus strength, and establish a ‘breath hold index’ (Kastrup et al. 1999; Silvestrini et al. 1999, 2000; Vernieri et al. 1999).
The problem with this approach is the tenuous relationship between breath-holding time and the actual  stimulus controlling CBF: breath-holding time is only one of several factors determining the actual change in
  . Other factors include the metabolic rate of the subject, the size of the lungs (which vary with age, sex, height, abdominal girth, body position, extent of chest compression with fat, presence of obstructive and other lung diseases etc.), recent ventilation history (e.g. if preceded by hyperventilation, the
  may change little if at all), and whether the subject inspired or expired immediately before breath-holding. Even if these factors are somehow controlled,
  is still not a linear function of breath-holding time as has been assumed (Sasse et al. 1996; Stock et al. 2006). Finally, the duration of breath-holding is highly variable between subjects, varying by more than 4 times (see Table I of Markus & Harrison, 1992), even within the same subject (Totaro et al. 1999). All of these factors contribute to a large variability and non-linear relation between breath-holding times and the resulting
  stimulus; an issue that cannot be addressed if CVR measures are to be comparable. While breath-holding techniques can be refined (Scouten & Schwarzbauer, 2008; Murphy et al. 2011; Bright & Murphy, 2013), by including end-tidal measures for example, they have not been shown to provide CVR maps that reliably identify cerebrovascular pathology because the threshold stimulus for all pathological conditions is still unknown. These drawbacks make breath-holding unsuitable as a method of producing a standardized hypercapnic stimulus for CVR measurements.
Inspired CO2
A second commonly used method of increasing  is the administration of a fixed inspired fractional concentration of CO2. Breathing 2, 5 or 7% CO2 via a tight fitting non-rebreathing face mask is often considered to produce a standard hypercapnic stimulus (Bishop et al. 1987; Ringelstein et al. 1988, 1992; Hoge et al. 1999; Vernieri et al. 2004). However, despite widespread confidence in this approach, a fixed inspired fractional concentration of CO2 does not produce a fixed related
  , but one that varies both between subjects and within the same subject over time (Hoskins, 1990; Prisman et al. 2008). Indeed, the resulting
  varies with metabolic rate and ventilation; the latter depending on the CO2 chemoreflex sensitivity of the individual (Duffin, 2011). Such chemoreflex-mediated increases in ventilation, responding to the CO2 in the inspired gas, moderate the rise in
  . Subjects with high chemoreflex sensitivities have greater increases in ventilation and, consequently, a lower
  stimulus for CVR (Ainslie & Duffin, 2009). As a result, for inspired CO2 fractions of 5% or less, the CO2-mediated ventilatory response may produce an unchanged, or even lowered
  (Baddeley et al. 2000). Furthermore, any increased ventilation also increases arterial
  (
( ) even if the inspired
  remains constant (Floyd et al. 2003; Prisman et al. 2008; Mark et al. 2010). For example, Wise et al. (2007) found a 15 mmHg increase in
  when subjects breathed 5% CO2 in air. If BOLD MRI is used to measure CVR under these conditions, this rise in
  would result in a small but measurable ∼0.3% increase in the BOLD signal (Prisman et al. 2008), which is about 10% of typical signal changes seen with a 10 mmHg increase in
  .
.
To circumvent this problem it has been argued that, regardless of the ventilatory response to administered CO2, end-tidal  (
( ) is a suitable surrogate for
  , and therefore
  can be used as the stimulus for CBF (Hoskins, 1990; Ringelstein et al. 1992; Mark et al. 2011). In young healthy people, the gradient between
  and
and  may indeed be small – on average – but it is nevertheless unknown. The gradient between arterial and end-tidal measurements (Robbins et al. 1990) varies in an individual with age (Miller & Tenney, 1956; Badgwell et al. 1987), exercise (Jones et al. 1979), body position (Barr, 1963), and disease (Yamanaka & Sue, 1987; Liu et al. 1995; Prause et al. 1997). Even the assumption of a constant relation between
  and
and  may not be correct. In patients with lung disease, changes in
  and
and  are concordant only about 70% of the time (Russell & Graybeal, 1994; Grenier et al. 1999; McDonald et al. 2002). Thus, providing a fixed known inspired CO2 fractional concentration and measuring the
  cannot standardize the
  stimulus, and is therefore unsuitable for measuring CVR quantitatively.
Rebreathing
Rebreathing exhaled gas is a traditional means of increasing  (Read, 1967). Its main advantages are that no external source of CO2 is required and the basic apparatus, consisting of an exhaled gas reservoir and gas sensors are readily available. It lends itself to testing CVR as there is equilibration between arterial, and alveolar
  , which can be measured with each breath. The
  , and hence the
  , can span a range of values potentially enabling the exploration of the dynamic relationship between
  and CBF.
However, there are a number of caveats which, if not addressed, limit its usefulness. First, during rebreathing, oxygen is continuously consumed from the reservoir changing the  , which should be kept constant for CVR measurement. Second,
  values, and hence CBF are changing continuously. This ramp stimulus is not suitable for use with measures of CBF that drift over time such as BOLD MRI, or that require steady states like arterial spin labeling (ASL) (Hajjar et al. 2010); if CBF measures with high time resolution are used, they must be matched to the constantly changing
  . Third, the rate of rise of
  is difficult to predict or control; depending on the individual's rate of CO2 production and the size of the rebreathing reservoir. Smaller reservoirs provide a more rapid rise in
  but may not provide adequate volume reserve for the larger tidal volumes as
  rises (Russo et al. 2000), and larger reservoirs prolong the rise time of
  , confounding measures of CBF that drift over time. Finally, contrary to the assertion that rebreathing quickly leads to a detectable ‘steady state plateau’ (Russo et al. 2000; Glodzik et al. 2011; Lee & Lee, 2011), complete rebreathing does not result in a plateau of
  as long the subject is alive (and producing CO2). Plateaus are only reached with incomplete rebreathing, such as the addition of a dead space (Glodzik et al. 2011) or as a result of holes in the rebreathing bag (Lee & Lee, 2011). Moreover, such plateau
  values are not predictable (SD in one study was 3.5 mmHg; Lee & Lee, 2011), and the time constants for reaching actual plateaus in these cases are typically very long, and seldom attained (see Fig. 1 in Lee & Lee, 2011).
From these considerations it is apparent that rebreathing requires modification before it can be used to provide a stimulus for CVR measurement. Indeed, using rebreathing to measure the distribution of cerebral blood flow using BOLD MRI imaging is not appropriate; methods of maintaining a constant  , and compensating for its effect on BOLD signal have not been developed. However, a specialized rebreathing method where isoxia is maintained during rebreathing has been developed for measuring the characteristics of the respiratory chemoreflexes (Duffin, 2011) and is suitable for CVR measurements using TCD. Originally modified from the rebreathing method proposed by (Read, 1967) and first described by (Casey et al. 1987), the isoxic rebreathing method has been extensively reviewed (Jensen et al. 2010; Duffin, 2011). In this method,
  and
and  are equivalent, satisfying the requirements for a known measured hypercapnic stimulus, with end-tidal
  (
( ) maintained constant. Recently this method has been adopted for use with TCD to measure blood flow velocity in a number of studies (e.g. Fan et al. 2010; Skow et al. 2013) and to describe the sigmoidal response to CO2 (Claassen et al. 2007; Battisti-Charbonney et al. 2011).
Dynamic end-tidal forcing
The first computerized method to control  and
and  was developed by Swanson & Bellville (1975) and termed dynamic end-tidal forcing (DEF). It is implemented using a computer-controlled gas blender (Robbins et al. 1982b) with a feedback algorithm (Robbins et al. 1982a) to control the inspired concentration of source gases O2, CO2 and N2, to target
  and
and  . To produce a sequence of changes in
  and
and  a predictive algorithm is used to calculate the inspired gas fractional concentrations necessary to produce the target end-tidal tensions. DEF has been used to control
  and
and  during BOLD MRI imaging for CVR in a single study of four subjects (Wise et al. 2007) and of coronary vascular reactivity in 15 subjects (Beaudin et al. 2011).
In operation, the difference between the target and actual end-tidal tensions is assessed on a breath-by-breath basis, and using the known inspired concentrations of gases, the errors in the inspired concentrations can be determined. With that error information and a prediction of the size of the next breath, the system controller calculates the corrections to the programmed inspired gas concentrations necessary to attain the target end-tidal tensions in the next breath. These corrective actions are made continuously when steady target end-tidal tensions are required. However, for rapid changes, the controller shortens the time for transition by overcompensating, and then reverts to maintaining corrective actions. For rapid decreases in  the method depends on increased ventilatory drive or voluntary hyperventilation.
While the DEF system is capable of controlling end-tidal gasses, we suggest that it is not suitable for clinical CVR testing for a number of reasons. First, implementation of the DEF system poses some difficulties. It is resource intensive, requiring an extensive and complex infrastructure (see Fig. 1 of Wise et al. 2007) because the system requires high flows (∼70 l min−1) in order to exceed the subject's peak inspiratory flow, which must be humidified before delivery to an open cone from which the subject breathes. The installation must therefore include the means to store and supply large volumes of humidified gas at high flows via large diameter tubing, and a breathing circuit with MRI-compatible electronic components such as flow sensors. Second, its performance in terms of accuracy and speed need improvement. Step increases in  are slow; despite utilizing ‘overpressure’ the time to transition to a new
  can take more than a minute (Beaudin et al. 2011). And for maintaining steady target tensions, the DEF control system prediction-correction algorithm has inherent breath-to-breath variations in
  and
and  of up to 2 mmHg (see Fig. 2, panel 2, in Wise et al. (2007) and Fig. 1 in Beaudin et al. (2011)). Third, as previously discussed, the relation between
  (the measured value) and
  (the actual CVR stimulus) is not known in an individual (e.g. St Croix et al. 1995). Finally, although the DEF system also incorporates safety features consisting of monitors for heart rate, pulse oximetry, inspired O2 concentration, and the presence of a back-up O2 source, maintaining safety is challenging because a failure of the O2 flow provides a totally anoxic inspiratory gas flow that must be detected and rectified immediately to prevent harm.
Figure 2. The sequential gas delivery circuit (SGD) operation.
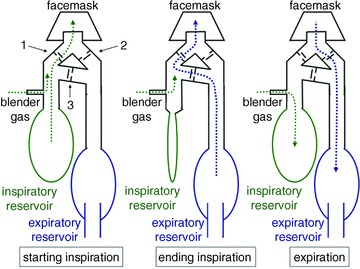
The valve manifold has an inspiratory valve (1), an expiratory valve (2) and a cross-over valve (3). The latter has a slightly greater opening pressure than the other valves and, when open allows gas to cross from the expiratory to the inspiratory limb. During expiration, gas delivered by the gas blender enters the inspiratory gas reservoir (green dotted line), and exhaled gas enters the expired gas reservoir (blue dashed line).During inspiration, gas is drawn from the stored blender gas in the inspiratory gas reservoir (green dotted lines). If the inspired volume exceeds the volume in the inspiratory reservoir, the balance comes from the expiratory gas reservoir via the cross-over valve (blue dashed line).
Prospective end-tidal targeting
Approximately 15 years ago, our laboratory set out to develop an automated device that would reliably administer a repeatable change in  , while maintaining isoxia, with minimal subject cooperation. As BOLD MRI signal was the intended surrogate for CBF, the equipment needed to be MRI compatible and compact. It also had to be economical, and inherently safe. The method that emerged became known as prospective targeting of
  and
and  (Slessarev et al. 2007; Blockley et al. 2011; Alderliesten et al. 2013). The core feature of the method is the capability of controlling the amount and content of gas entering the lung gas exchange region independent of the tidal volume and pattern of breathing. This capability was achieved by using a simple 3-valve manifold and circuit that, with control of the flow of gas to the circuit, produced a sequential delivery of inspired and previously exhaled gas. Its operation is illustrated in Fig. 2.
As Fig. 2 shows, gases from the inspiratory reservoir and from the expiratory reservoir are delivered sequentially during inspiration (Sommer et al. 1998; Somogyi et al. 2005; Slessarev et al. 2007). The functional significance of this arrangement is that the rebreathed gas in the expiratory reservoir, having already equilibrated with the blood, provides no gradient for any further gas exchange, i.e. rebreathed gas is neutral with respect to pulmonary gas exchange. This sequential gas delivery (SGD) means that the gas supplied to the inspiratory reservoir is the only source of gas available for gas exchange in the lung. Provided the subject empties the inspiratory reservoir for each breath, the output of the gas blender is the alveolar ventilation, regardless of actual breath size or breathing pattern.
This prospective targeting methodology confers four major advantages. First, with alveolar ventilation precisely administered by the gas blender, gas tensions can be accurately targeted because  and
and  are determined by the gas fractional concentrations in the alveolar ventilation (Slessarev et al. 2007). Moreover, the targeting of each gas is independent of the other as well as independent of both the minute ventilation and the breathing pattern of the subject, as Fig. 3 illustrates. Second, gas blender flows to the SGD circuit approximate resting ventilation, so that more compact gas sources can be used, and gas utilization is minimized and expenses reduced. Also the system operation is quiet, and gas humidification can easily be achieved. Third, the prospective nature of the system targeting eliminates the need for a feedback correction mechanism thereby markedly reducing the computational complexity while minimizing the breath-to-breath variability of
  . Fourth, a minimal degree of cooperation is required of the subjects; all they need to do is breathe so that their ventilation exceeds the blender gas flow to the inspiratory reservoir. Finally, and most important, because the SGD circuit includes an element of expired gas rebreathing, alveolar inhomogeneities are reduced and, as a result, the gradient between
  and
and  is reduced to the range of instrument measuring error (0.5 ± 1.7 mmHg; P= 0.53; Ito et al. 2008; Fierstra et al. 2011) under steady conditions.
Figure 3. Examples of PE T, CO2 and PE T, O2 control in a subject using an SGD breathing circuit and prospective end-tidal targeting.
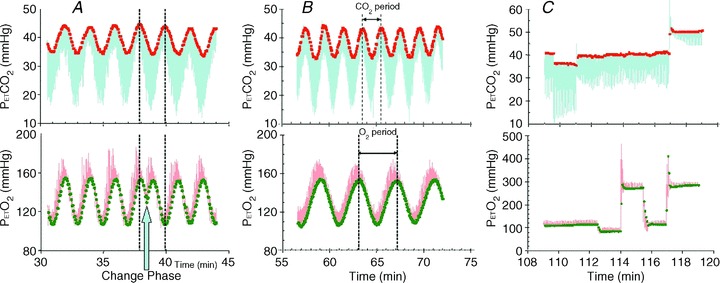
The continuous traces from sampling at the mask are  (blue upper) and
  (red lower). End-tidal values are
  (red filled squares) and
  (green filled circles), each representing a single breath. A, sinusoidal changes of
  and
and  are implemented in phase until the blue arrow, when the phase of the
  is changed 180 deg. B, sinusoidal changes of
  and
and  are implemented with the period of
  twice that of
  . C, simultaneous square wave changes in
  and
and  are implemented independently of each other. In the sinusoidal patterns, the target
  and
and  change with each breath. The algorithm used to reach these targets is context sensitive, that is, it takes into account the current gas concentrations in the lung as well as the target history. This means that the set of flows and inspired gas concentrations differ – even for the same recurrent end-tidal target values, whether they be in a sinusoidal sequence or steady target level. The algorithm uses the baseline
  , and resting CO2 production and O2 consumption to calculate inspired gas parameters. Baseline
  is based on the
  during rest. Resting CO2 production and O2 consumption are calculated from a nomogram based on sex, height and weight. Errors in presumption of CO2 production or O2 consumption, or changes in these due to changes in activity or muscle tone, result in target values drifting over time, as can be seen in A and C.
Until now it has not been possible to accurately specify the  stimulus, and so it was not known how precisely the BOLD MRI signal follows the change in
  . We found that after synchronizing the phases of the
  and BOLD signals, the waveforms track precisely, voxel-by-voxel as shown in Fig. 4. This observation demonstrates that any inaccuracies of the independent variable
  will result in inaccuracies of the CVR measurements, and so impede interpretation. The computer controlled gas blender and SGD circuit can be used to prospectively target
  , which is accurately and precisely known at breath-by-breath intervals through the measurement of
  .
.
Figure 4. Voxel tracking of PE T, CO2.
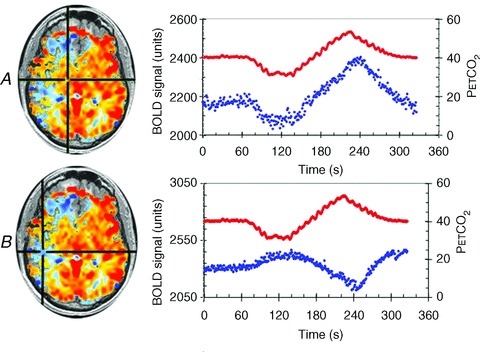
CVR maps, constructed as for Fig. 1, are shown on the left with chosen voxels indicated by the cross-hairs. The right side shows graphs of the time course of the chosen voxels BOLD signals (blue dots) in response to the changes in  (red dots). A, a voxel with positive CVR. B, a voxel with negative CVR (vascular steal). In each case the BOLD signals track the
  stimulus, indicating that a precise and accurate measurement of CVR requires accuracy and precision of the
  stimulus as well as the surrogate measure of cerebral blood flow.
However, as well as the advantages described above, the prospective targeting system, has a number of limitations associated with its application. As discussed in the caption in Fig. 3, initialization of the targeting software requires unmeasured parameters such as baseline  , CO2 production and O2 consumption; incorrect assumptions are a source of error in targeting. In addition, the achievement of precise targeting has fastidious technical requirements; the most important of which is that the interface with the subject be absolutely airtight. Skin tape such as Tegaderm (3M, St Paul MN, USA) is used around the mask by most investigators. Although the breathing circuit is simple in design, it nevertheless has strict performance requirements, particularly in the competence of the valves and the condition of the reservoirs during targeting (e.g. collapse of the inspiratory reservoir on inspiration; venting the expiratory reservoir without contaminating its contents with air). The system requires preparation of two custom blend gases containing different concentrations of O2, CO2 and N2 to circumvent the possibility of administering hypoxic gas. Subjects must cooperate to the extent that they empty the inspiratory reservoir each breath so that, on occasion, they must either increase their minute ventilation on command; alternatively, the user can reduce the blend gas flow (whereby the gas concentrations automatically adjust to maintain targeting). Thus, the gas blender and associated software, like that of DEF system, are too complex for most laboratories to assemble and achieve sophistication and safety. Neither are they currently regulatory approved commercially available devices. Nevertheless, we have made every effort to selectively make available hand-assembled devices for collaborative research, resulting in about 60 publications in the peer reviewed literature enabled by the device.
Conclusions
Measures of CBF are now highly reproducible, but variability of the vasoactive stimulus remains a major impediment in the pursuit of a standardized cerebrovascular test employing CVR measurement. Reducing this source of variability will further advance the art towards the goal of generating useful comparisons of CVR maps between subjects or groups of subjects, as well as the ability to follow CVR changes in a given subject over time. After reviewing the various vasoactive stimuli, we conclude that while the modified rebreathing method may be used to measure CVR with TCD, only the computer controlled gas delivery DEF and prospective end-tidal gas targeting systems are capable of providing reliable and repeatable vasoactive CO2 stimuli for both TCD and clinically available imaging techniques such as BOLD MRI that produce CVR maps. These latter methods, therefore, may be candidates for incorporation into standardized CVR measurements; of these systems, prospective end-tidal targeting is the most practical for routine testing (Spano et al. 2012) with all measurement modalities.
Glossary
Abbreviations
- ACZ
acetazolamide
- ASL
arterial spin labeling
- BOLD
blood oxygen level-dependent
- CBF
cerebral blood flow
- CVR
cerebrovascular reactivity
- DEF
dynamic end-tidal forcing
- MRI
magnetic resonance imaging
- SGD
sequential gas delivery (circuit)
- TCD
trans-cranial Doppler
Appendix A selective primer in respiratory physiology
| Terminology | |
|---|---|
| Alveolar ventilation | The gas in the lungs contributing to gas exchange with the blood |
| Breath hold index |
 increase divided by breath-hold time increase divided by breath-hold time |
| CO2 | Carbon dioxide |
 |
Fractional concentration of CO2, the proportion of CO2 in a gas |
| Hypercapnia | Higher than normal 
|
| Hypocapnia | Lower than normal 
|
| Minute ventilation | Gas volume exchanged in the lungs in litres per minute |
 |
Partial pressure of CO2 |
| Peak inspiratory flow | Peak flow of gas during a breath |
 |
End-tidal partial pressure of carbon dioxide |
| Rebreathing | Inhaling previously exhaled gas |
| Ventilatory drive | The urge to breathe |
Carbon dioxide (CO2) is produced in the body by metabolism, so that CO2 levels in the blood are determined by the balance between the rate of production by the tissues and the rate of elimination through the lungs.
The partial pressure of CO2( ), in a gas mixture is
  times the ambient pressure (Henry's law). Partial pressure determines the movement of gases in the body, so the concentration of CO2 in the blood is a function of
  (CO2 dissociation curve). The partial pressure of CO2 in arterial blood is represented as
  , which is considered to be the independent variable affecting the flow resistance of cerebral vessels.
End-tidal (
( ) is the partial pressure of CO2 in the gas at the end of an exhalation. It is that which has fully equilibrated with the blood and so is of interest.
Breath-holding (holding one's breath) reduces the rate of elimination of CO2 to zero. As a result CO2 accumulates in the blood and its fractional concentration and partial pressure rises.
Rebreathing is the inhalation of previously exhaled gas. As this gas has already equilibrated with the blood, it does not participate in gas exchange. Therefore the rebreathed portion of the breath does not contribute to alveolar ventilation. If the entire breath consists of previously exhaled gas, the result is the same as breath-holding: there is a steady accumulation of CO2 in the blood. The rate of rise of CO2 in the blood depends on the body's CO2 production and the body size. There is also a steady consumption of oxygen (O2), and without O2 replacement, the O2 concentration in the blood falls continuously. Rebreathing methods therefore require the addition of O2 to maintain blood O2 levels.
Inhaling CO2 also adds to the accumulation of CO2 in the blood. When the inspired gas has a constant concentration of CO2, the CO2 level in the blood is a function of both this inspired concentration (which tends to raise the concentration of CO2) and the level of ventilation (which tends to lower it). Since the level of ventilation to a given inspired concentration of CO2 varies between people, the blood concentration of CO2 to a given inspired concentration will vary.
Chemoreflexes control the partial pressure of CO2 in the blood. If the  exceeds a threshold the central and peripheral chemoreflexes effect a reflex increase in ventilation to restore resting
  .
.
The relationship between and
and  is not constant. In some healthy people they may be closely related, but the relationship is not reliable. The only exception is when CO2 is inhaled at the end of a breath. Our system of prospective targeting of
  includes some rebreathing at the end of inhalation, which has been shown to equalize the
  and
and  . In this case, the
  is an accurate surrogate for the
  , the independent variable affecting cerebral blood flow.
Tidal volume is the volume of a breath. To generate a breath the diaphragm and chest muscles contract. The flow of gas into the lungs starts from 0, reaches a maximum and ends at 0 flow just before exhalation. The maximum flow at rest in adults can be 50 l min−1. It can be 2 to 3 times this with greater breathing efforts. When the subject breathes gas provided by a mask that is open to atmosphere (such as a regular oxygen mask), and the flow of gas does not exceed this peak inspiratory flow, gas from the room is drawn into the mask and dilutes the administered gas. Typical maximum oxygen flows into the mask are 5–15 l min−1. Maximum flow that can be conducted in standard oxygen tubing is about 25 l min−1. Meeting peak inspiratory flow rates requires gas flows of 70 l min−1 or more.
Controlling lung gas concentrations is difficult. After an exhalation there is a large volume of gas left in the lung called the ‘functional residual capacity’, or FRC. The FRC is typically very large (∼3 l in an adult) compared to the breath size (∼0.5 l). As a result it takes many breaths to ‘wash out’ the current gas concentration in the FRC and replace it with gas of another concentration. Computerized gas delivery systems have developed strategies to optimize this exchange.
Additional information
Competing interests
J.A.F. is Chief Scientist and J.D. is Senior Scientist at Thornhill Research Inc. (TRI), a spin-off company from the University Health Network that developed the RespirAct™. RespirAct™ is currently a non-commercial research tool made available for this research by TRI.
References
- Aaslid R, Lindegaard KF, Sorteberg W, Nornes H. Cerebral autoregulation dynamics in humans. Stroke. 1989;20:45–52. doi: 10.1161/01.str.20.1.45. [DOI] [PubMed] [Google Scholar]
- Ainslie PN, Duffin J. Integration of cerebrovascular CO2 reactivity and chemoreflex control of breathing: mechanisms of regulation, measurement, and interpretation. Am J Physiol Regul Integr Comp Physiol. 2009;296:R1473–R1495. doi: 10.1152/ajpregu.91008.2008. [DOI] [PubMed] [Google Scholar]
- Alderliesten T, De Vis JB, Lemmers PM, Van Bel F, Benders MJ, Hendrikse J, Petersen ET. Simultaneous quantitative assessment of cerebral physiology using respiratory-calibrated MRI and near-infrared spectroscopy in healthy adults. Neuroimage. 2013 doi: 10.1016/j.neuroimage.2013.07.015. (in press; DOI: 10.1016/j.neuroimage.2013.07.015) [DOI] [PubMed] [Google Scholar]
- Artru a A, Colley PS. Cerebral blood flow responses to hypocapnia during hypotension. Stroke. 1984;15:878–883. doi: 10.1161/01.str.15.5.878. [DOI] [PubMed] [Google Scholar]
- Asghar MS, Hansen a E, Pedersen S, Larsson HB, Ashina M. Pharmacological modulation of the BOLD response: a study of acetazolamide and glyceryl trinitrate in humans. J Magn Reson Imaging. 2011;34:921–927. doi: 10.1002/jmri.22659. [DOI] [PubMed] [Google Scholar]
- Attwell D, Buchan a M, Charpak S, Lauritzen M, MacVicar BA, Newman EA. Glial and neuronal control of brain blood flow. Nature. 2011;468:232–243. doi: 10.1038/nature09613. [DOI] [PMC free article] [PubMed] [Google Scholar]
- Ayas N, Bergstrom LR, Schwab TR, Narr BJ. Unrecognized severe postoperative hypercapnia: a case of apneic oxygenation. Mayo Clin Proc. 1998;73:51–54. doi: 10.1016/S0025-6196(11)63619-7. [DOI] [PubMed] [Google Scholar]
- Baddeley H, Brodrick PM, Taylor NJ, Abdelatti MO, Jordan LC, Vasudevan a S, Phillips H, Saunders MI, Hoskin PJ. Gas exchange parameters in radiotherapy patients during breathing of 2%, 3.5% and 5% carbogen gas mixtures. Br J Radiol. 2000;73:1100–1104. doi: 10.1259/bjr.73.874.11271904. [DOI] [PubMed] [Google Scholar]
-
Badgwell JM, Mcleod ME, Lerman J, Creighton RE. End-tidal P
 measurements sampled at the distal and proximal ends of the endotracheal tube in infants and children. Anesth Analg. 1987;66:959–964. [PubMed] [Google Scholar]
 - Barr PO. Pulmonary gas exchange in man as affected by prolonged gravitational stress. Acta Psychiatr Scand Suppl. 1963;207:1–46. doi: 10.1111/j.1748-1716.1963.tb00082.x. [DOI] [PubMed] [Google Scholar]
- Battisti-Charbonney A, Fisher J, Duffin J. The cerebrovascular response to carbon dioxide in humans. J Physiol. 2011;589:3039–3048. doi: 10.1113/jphysiol.2011.206052. [DOI] [PMC free article] [PubMed] [Google Scholar]
- Beaudin AE, Brugniaux JV, Vohringer M, Flewitt J, Green JD, Friedrich MG, Poulin MJ. Cerebral and myocardial blood flow responses to hypercapnia and hypoxia in humans. Am J Physiol Heart Circ Physiol. 2011;301:H1678–H1686. doi: 10.1152/ajpheart.00281.2011. [DOI] [PubMed] [Google Scholar]
- Bishop CC, Butler L, Hunt T, Burnand KG, Browse NL. Effect of carotid endarterectomy on cerebral blood flow and its response to hypercapnia. Br J Surg. 1987;74:994–996. doi: 10.1002/bjs.1800741112. [DOI] [PubMed] [Google Scholar]
- Blockley NP, Driver ID, Francis ST, Fisher JA, Gowland PA. An improved method for acquiring cerebrovascular reactivity maps. Magn Reson Med. 2011;65:1278–1286. doi: 10.1002/mrm.22719. [DOI] [PubMed] [Google Scholar]
- Brian JE., Jr Carbon dioxide and the cerebral circulation. Anesthesiology. 1998;88:1365–1386. doi: 10.1097/00000542-199805000-00029. [DOI] [PubMed] [Google Scholar]
- Bright MG, Bulte DP, Jezzard P, Duyn JH. Characterization of regional heterogeneity in cerebrovascular reactivity dynamics using novel hypocapnia task and BOLD fMRI. Neuroimage. 2009;48:166–175. doi: 10.1016/j.neuroimage.2009.05.026. [DOI] [PMC free article] [PubMed] [Google Scholar]
- Bright MG, Murphy K. Reliable quantification of BOLD fMRI cerebrovascular reactivity despite poor breath-hold performance. Neuroimage. 2013;83C:559–568. doi: 10.1016/j.neuroimage.2013.07.007. [DOI] [PMC free article] [PubMed] [Google Scholar]
- Casey K, Duffin J, McAvoy GV. The effect of exercise on the central-chemoreceptor threshold in man. J Physiol. 1987;383:9–18. doi: 10.1113/jphysiol.1987.sp016392. [DOI] [PMC free article] [PubMed] [Google Scholar]
- Claassen JA, Zhang R, Fu Q, Witkowski S, Levine BD. Transcranial Doppler estimation of cerebral blood flow and cerebrovascular conductance during modified rebreathing. J Appl Physiol. 2007;102:870–877. doi: 10.1152/japplphysiol.00906.2006. [DOI] [PubMed] [Google Scholar]
- Dahl A, Russell D, Rootwelt K, Nyberg-Hansen R, Kerty E. Cerebral vasoreactivity assessed with transcranial Doppler and regional cerebral blood flow measurements. Dose, serum concentration, and time course of the response to acetazolamide. Stroke. 1995;26:2302–2306. doi: 10.1161/01.str.26.12.2302. [DOI] [PubMed] [Google Scholar]
- Duffin J. Measuring the respiratory chemoreflexes in humans. Resp Physiol Neurobiol. 2011;177:71–79. doi: 10.1016/j.resp.2011.04.009. [DOI] [PubMed] [Google Scholar]
- Fan J-L, Burgess KR, Basnyat R, Thomas KN, Peebles KC, Lucas SJE, Lucas RAI, Donnelly J, Cotter JD, Ainslie PN. Influence of high altitude on cerebrovascular and ventilatory responsiveness to CO2. J Physiol. 2010;588:539–549. doi: 10.1113/jphysiol.2009.184051. [DOI] [PMC free article] [PubMed] [Google Scholar]
- Feihl F, Perret C. Permissive hypercapnia. How permissive should we be. Am J Respir Crit Care Med. 1994;150:1722–1737. doi: 10.1164/ajrccm.150.6.7952641. [DOI] [PubMed] [Google Scholar]
- Fierstra J, Machina M, Battisti-Charbonney A, Duffin J, Fisher JA, Minkovich L. End-inspiratory rebreathing reduces the end-tidal to arterial PCO2 gradient in mechanically ventilated pigs. Intensive Care Med. 2011;37:1543–1550. doi: 10.1007/s00134-011-2260-y. [DOI] [PubMed] [Google Scholar]
- Floyd TF, Clark JM, Gelfand R, Detre JA, Ratcliffe S, Guvakov D, Lambertsen CJ, Eckenhoff RG. Independent cerebral vasoconstrictive effects of hyperoxia and accompanying arterial hypocapnia at 1 ATA. J Appl Physiol. 2003;95:2453–2461. doi: 10.1152/japplphysiol.00303.2003. [DOI] [PubMed] [Google Scholar]
- Fortune JB, Bock D, Kupinski AM, Stratton HH, Shah DM. Human cerebrovascular response to oxygen and carbon dioxide as determined by internal carotid artery duplex scanning. J Trauma. 1992;32:618–627. (Discussion pp. 627–618) [PubMed] [Google Scholar]
- Glodzik L, Rusinek H, Brys M, Tsui WH, Switalski R, Mosconi L, Mistur R, Pirraglia E, De Santi S, Li Y, Goldowsky A, De Leon MJ. Framingham cardiovascular risk profile correlates with impaired hippocampal and cortical vasoreactivity to hypercapnia. J Cereb Blood Flow Metab. 2011;31:671–679. doi: 10.1038/jcbfm.2010.145. [DOI] [PMC free article] [PubMed] [Google Scholar]
- Gooskens I, Schmidt EA, Czosnyka M, Piechnik SK, Smielewski P, Kirkpatrick PJ, Pickard JD. Pressure-autoregulation, CO2 reactivity and asymmetry of haemodynamic parameters in patients with carotid artery stenotic disease. A clinical appraisal. Acta Neurochir (Wien) 2003;145:527–532. doi: 10.1007/s00701-003-0045-y. [DOI] [PubMed] [Google Scholar]
- Grenier B, Verchere E, Mesli A, Dubreuil M, Siao D, Vandendriessche M, Cales J, Maurette P. Capnography monitoring during neurosurgery: reliability in relation to various intraoperative positions. Anesth Analg. 1999;88:43–48. doi: 10.1097/00000539-199901000-00009. [DOI] [PubMed] [Google Scholar]
- Grossmann WM, Koeberle B. The dose–response relationship of acetazolamide on the cerebral blood flow in normal subjects. Cerebrovasc Dis. 2000;10:65–69. doi: 10.1159/000016027. [DOI] [PubMed] [Google Scholar]
- Gur AY, Bova I, Bornstein NM. Is impaired cerebral vasomotor reactivity a predictive factor of stroke in asymptomatic patients. Stroke. 1996;27:2188–2190. doi: 10.1161/01.str.27.12.2188. [DOI] [PubMed] [Google Scholar]
- Hajjar I, Zhao P, Alsop D, Novak V. Hypertension and cerebral vasoreactivity: a continuous arterial spin labelling magnetic resonance imaging study. Hypertension. 2010;56:859–864. doi: 10.1161/HYPERTENSIONAHA.110.160002. [DOI] [PMC free article] [PubMed] [Google Scholar]
- Harper AM. The inter-relationship between aPco-2 and blood pressure in the regulation of blood flow through the cerebral cortex. Acta Neurol Scand Suppl. 1965;14:94–103. doi: 10.1111/j.1600-0404.1965.tb01964.x. [DOI] [PubMed] [Google Scholar]
- Hasegawa Y, Yamaguchi T. Long-term prognosis and blood flow reactivity to acetazolamide in atherothrombotic brain ischemia] Rinsho Shinkeigaku. 1993;33:169–174. [PubMed] [Google Scholar]
- Hoge RD, Atkinson J, Gill B, Crelier GR, Marrett S, Pike GB. Stimulus-dependent BOLD and perfusion dynamics in human V1. Neuroimage. 1999;9:573–585. doi: 10.1006/nimg.1999.0443. [DOI] [PubMed] [Google Scholar]
- Hoskins PR. Measurement of arterial blood flow by Doppler ultrasound. Clin Phys Physiol Meas. 1990;11:1–26. doi: 10.1088/0143-0815/11/1/001. [DOI] [PubMed] [Google Scholar]
- Iadecola C, Nedergaard M. Glial regulation of the cerebral microvasculature. Nat Neurosci. 2007;10:1369–1376. doi: 10.1038/nn2003. [DOI] [PubMed] [Google Scholar]
- Ito S, Mardimae A, Han J, Duffin J, Wells G, Fedorko L, Minkovich L, Katznelson R, Meineri M, Arenovich T, Kessler C, Fisher JA. Non-invasive prospective targeting of arterial PCO2 in subjects at rest. J Physiol. 2008;586:3675–3682. doi: 10.1113/jphysiol.2008.154716. [DOI] [PMC free article] [PubMed] [Google Scholar]
- Jensen D, Mask G, Tschakovsky ME. Variability of the ventilatory response to Duffin's modified hyperoxic and hypoxic rebreathing procedure in healthy awake humans. Respir Physiol Neurobiol. 2010;170:185–197. doi: 10.1016/j.resp.2009.12.007. [DOI] [PubMed] [Google Scholar]
- Jones NL, Robertson DG, Kane JW. Difference between end-tidal and arterial PCO2 in exercise. J Appl Physiol. 1979;47:954–960. doi: 10.1152/jappl.1979.47.5.954. [DOI] [PubMed] [Google Scholar]
- Kastrup A, Kruger G, Glover GH, Neumann-Haefelin T, Moseley ME. Regional variability of cerebral blood oxygenation response to hypercapnia. Neuroimage. 1999;10:675–681. doi: 10.1006/nimg.1999.0505. [DOI] [PubMed] [Google Scholar]
- Kastrup A, Kruger G, Neumann-Haefelin T, Moseley ME. Assessment of cerebrovascular reactivity with functional magnetic resonance imaging: comparison of CO2 and breath holding. Magn Reson Imaging. 2001;19:13–20. doi: 10.1016/s0730-725x(01)00227-2. [DOI] [PubMed] [Google Scholar]
- Kety SS, Schmidt CF. The effects of altered arterial tension of carbon dioxide and oxygen on cerebral blood flow and cerebral oxygen consumption of normal men. J Clin Invest. 1948;27:484–492. doi: 10.1172/JCI101995. [DOI] [PMC free article] [PubMed] [Google Scholar]
- Kuroda S, Houkin K, Kamiyama H, Mitsumori K, Iwasaki Y, Abe H. Long-term prognosis of medically treated patients with internal carotid or middle cerebral artery occlusion: can acetazolamide test predict it. Stroke. 2001;32:2110–2116. doi: 10.1161/hs0901.095692. [DOI] [PubMed] [Google Scholar]
- Lee JY, Lee YS. Vasomotor reactivity in middle cerebral artery stenosis. J Neurol Sci. 2011;301:35–37. doi: 10.1016/j.jns.2010.11.008. [DOI] [PubMed] [Google Scholar]
- Liu Z, Vargas F, Stansbury D, Sasse SA, Light RW. Comparison of the end-tidal arterial PCO2 gradient during exercise in normal subjects and in patients with severe COPD. Chest. 1995;107:1218–1224. doi: 10.1378/chest.107.5.1218. [DOI] [PubMed] [Google Scholar]
- Lucas SJ, Tzeng YC, Galvin SD, Thomas KN, Ogoh S, Ainslie PN. Influence of changes in blood pressure on cerebral perfusion and oxygenation. Hypertension. 2010;55:698–705. doi: 10.1161/HYPERTENSIONAHA.109.146290. [DOI] [PubMed] [Google Scholar]
- Lundar T, Lindegaard KF, Froysaker T, Aaslid R, Grip A, Nornes H. Dissociation between cerebral autoregulation and carbon dioxide reactivity during nonpulsatile cardiopulmonary bypass. Ann Thorac Surg. 1985;40:582–587. doi: 10.1016/s0003-4975(10)60353-0. [DOI] [PubMed] [Google Scholar]
- McDonald MJ, Montgomery VL, Cerrito PB, Parrish CJ, Boland KA, Sullivan JE. Comparison of end-tidal CO2 and Paco2 in children receiving mechanical ventilation. Pediatr Crit Care Med. 2002;3:244–249. doi: 10.1097/00130478-200207000-00008. [DOI] [PubMed] [Google Scholar]
- MacKenzie ET, Farrar JK, Fitch W, Graham DI, Gregory PC, Harper a M. Effects of hemorrhagic hypotension on the cerebral circulation. I. Cerebral blood flow and pial arteriolar caliber. Stroke. 1979;10:711–718. doi: 10.1161/01.str.10.6.711. [DOI] [PubMed] [Google Scholar]
- Mahony PJ, Panerai RB, Deverson ST, Hayes PD, Evans DH. Assessment of the thigh cuff technique for measurement of dynamic cerebral autoregulation. Stroke. 2000;31:476–480. doi: 10.1161/01.str.31.2.476. [DOI] [PubMed] [Google Scholar]
- Mandell DM, Han JS, Poublanc J, Crawley AP, Fierstra J, Tymianski M, Fisher JA, Mikulis DJ. Quantitative measurement of cerebrovascular reactivity by blood oxygen level-dependent MR imaging in patients with intracranial stenosis: preoperative cerebrovascular reactivity predicts the effect of extracranial-intracranial bypass surgery. AJNR Am J Neuroradiol. 2011;32:721–727. doi: 10.3174/ajnr.A2365. [DOI] [PMC free article] [PubMed] [Google Scholar]
- Mandell DM, Han JS, Poublanc J, Crawley AP, Stainsby JA, Fisher JA, Mikulis DJ. Mapping cerebrovascular reactivity using blood oxygen level-dependent MRI in Patients with arterial steno-occlusive disease: comparison with arterial spin labelling MRI. Stroke. 2008;39:2021–2028. doi: 10.1161/STROKEAHA.107.506709. [DOI] [PubMed] [Google Scholar]
- Mardimae A, Balaban DY, Machina MA, Han JS, Katznelson R, Minkovich LL, Fedorko L, Murphy PM, Wasowicz M, Naughton F, Meineri M, Fisher JA, Duffin J. The interaction of carbon dioxide and hypoxia in the control of cerebral blood flow. Pflugers Arch. 2012;464:345–351. doi: 10.1007/s00424-012-1148-1. [DOI] [PubMed] [Google Scholar]
- Mark CI, Fisher JA, Pike GB. Improved fMRI calibration: precisely controlled hyperoxic versus hypercapnic stimuli. Neuroimage. 2011;54:1102–1111. doi: 10.1016/j.neuroimage.2010.08.070. [DOI] [PubMed] [Google Scholar]
- Mark CI, Slessarev M, Ito S, Han J, Fisher JA, Pike GB. Precise control of end-tidal carbon dioxide and oxygen improves BOLD and ASL cerebrovascular reactivity measures. Magn Reson Med. 2010;64:749–756. doi: 10.1002/mrm.22405. [DOI] [PubMed] [Google Scholar]
- Markus HS, Harrison MJ. Estimation of cerebrovascular reactivity using transcranial Doppler, including the use of breath-holding as the vasodilatory stimulus. Stroke. 1992;23:668–673. doi: 10.1161/01.str.23.5.668. [DOI] [PubMed] [Google Scholar]
- Miller RM, Tenney SM. Dead space ventilation in old age. J Appl Physiol. 1956;9:321–327. doi: 10.1152/jappl.1956.9.3.321. [DOI] [PubMed] [Google Scholar]
- Murphy K, Harris a D, Wise RG. Robustly measuring vascular reactivity differences with breath-hold: normalising stimulus-evoked and resting state BOLD fMRI data. Neuroimage. 2011;54:369–379. doi: 10.1016/j.neuroimage.2010.07.059. [DOI] [PubMed] [Google Scholar]
- Nishimura S, Suzuki A, Hatazawa J, Nishimura H, Shirane R, Yasui N, Yoshimoto T. Cerebral blood-flow responses to induced hypotension and to CO2 inhalation in patients with major cerebral artery occlusive disease: a positron-emission tomography study. Neuroradiology. 1999;41:73–79. doi: 10.1007/s002340050709. [DOI] [PubMed] [Google Scholar]
- O’Croinin D, Ni Chonghaile M, Higgins B, Laffey JG. Bench-to-bedside review: Permissive hypercapnia. Crit Care. 2005;9:51–59. doi: 10.1186/cc2918. [DOI] [PMC free article] [PubMed] [Google Scholar]
- Okazawa H, Yamauchi H, Sugimoto K, Toyoda H, Kishibe Y, Takahashi M. Effects of acetazolamide on cerebral blood flow, blood volume, and oxygen metabolism: a positron emission tomography study with healthy volunteers. J Cereb Blood Flow Metab. 2001;21:1472–1479. doi: 10.1097/00004647-200112000-00012. [DOI] [PubMed] [Google Scholar]
- Panerai RB. Assessment of cerebral pressure autoregulation in humans – a review of measurement methods. Physiol Meas. 1998;19:305–338. doi: 10.1088/0967-3334/19/3/001. [DOI] [PubMed] [Google Scholar]
- Paulson OB, Hasselbalch SG, Rostrup E, Knudsen GM, Pelligrino D. Cerebral blood flow response to functional activation. J Cereb Blood Flow Metab. 2011;30:2–14. doi: 10.1038/jcbfm.2009.188. [DOI] [PMC free article] [PubMed] [Google Scholar]
- Potkin RT, Swenson ER. Resuscitation from severe acute hypercapnia. Determinants of tolerance and survival. Chest. 1992;102:1742–1745. doi: 10.1378/chest.102.6.1742. [DOI] [PubMed] [Google Scholar]
- Poulin MJ, Fatemian M, Tansley JG, O’Connor DF, Robbins PA. Changes in cerebral blood flow during and after 48 h of both isocapnic and poikilocapnic hypoxia in humans. Exp Physiol. 2002;87:633–642. doi: 10.1113/eph8702437. [DOI] [PubMed] [Google Scholar]
- Poulin MJ, Liang PJ, Robbins PA. Dynamics of the cerebral blood flow response to step changes in end- tidal PCO2 and PCO2 in humans. J Appl Physiol. 1996;81:1084–1095. doi: 10.1152/jappl.1996.81.3.1084. [DOI] [PubMed] [Google Scholar]
- Prause G, Hetz H, Lauda P, Pojer H, Smolle-Juettner F, Smolle J. A comparison of the end-tidal-CO2 documented by capnometry and the arterial pCO2 in emergency patients. Resuscitation. 1997;35:145–148. doi: 10.1016/s0300-9572(97)00043-9. [DOI] [PubMed] [Google Scholar]
- Prisman E, Slessarev M, Han J, Poublanc J, Mardimae A, Crawley A, Fisher J, Mikulis D. Comparison of the effects of independently-controlled end-tidal PCO2 and PO2 on blood oxygen level-dependent (BOLD) MRI. J Magn Reson Imaging. 2008;27:185–191. doi: 10.1002/jmri.21102. [DOI] [PubMed] [Google Scholar]
- Raichle ME, Plum F. Hyperventilation and cerebral blood flow. Stroke. 1972;3:566–575. doi: 10.1161/01.str.3.5.566. [DOI] [PubMed] [Google Scholar]
- Ratnatunga C, Adiseshiah M. Increase in middle cerebral artery velocity on breath holding: a simplified test of cerebral perfusion reserve. Eur J Vasc Surg. 1990;4:519–523. doi: 10.1016/s0950-821x(05)80795-9. [DOI] [PubMed] [Google Scholar]
- Read DJ. A clinical method for assessing the ventilatory response to carbon dioxide. Australas Ann Med. 1967;16:20–32. doi: 10.1111/imj.1967.16.1.20. [DOI] [PubMed] [Google Scholar]
- Ringelstein EB, Sievers C, Ecker S, Schneider PA, Otis SM. Noninvasive assessment of CO2-induced cerebral vasomotor response in normal individuals and patients with internal carotid artery occlusions. Stroke. 1988;19:963–969. doi: 10.1161/01.str.19.8.963. [DOI] [PubMed] [Google Scholar]
- Ringelstein EB, Van Eyck S, Mertens I. Evaluation of cerebral vasomotor reactivity by various vasodilating stimuli: comparison of CO2 to acetazolamide. J Cereb Blood Flow Metab. 1992;12:162–168. doi: 10.1038/jcbfm.1992.20. [DOI] [PubMed] [Google Scholar]
- Robbins PA, Conway J, Cunningham DA, Khamnei S, Paterson DJ. A comparison of indirect methods for continuous estimation of arterial PCO2 in men. J Appl Physiol. 1990;68:1727–1731. doi: 10.1152/jappl.1990.68.4.1727. [DOI] [PubMed] [Google Scholar]
- Robbins PA, Swanson GD, Howson MG. A prediction-correction scheme for forcing alveolar gases along certain time courses. J Appl Physiol. 1982a;52:1353–1357. doi: 10.1152/jappl.1982.52.5.1353. [DOI] [PubMed] [Google Scholar]
- Robbins PA, Swanson GD, Micco AJ, Schubert WP. A fast gas-mixing system for breath-to-breath respiratory control studies. J Appl Physiol. 1982b;52:1358–1362. doi: 10.1152/jappl.1982.52.5.1358. [DOI] [PubMed] [Google Scholar]
- Russell GB, Graybeal JM. Reliability of the arterial to end-tidal carbon dioxide gradient in mechanically ventilated patients with multisystem trauma. J Trauma. 1994;36:317–322. doi: 10.1097/00005373-199403000-00006. [DOI] [PubMed] [Google Scholar]
- Russo G, Lodi CA, Ursino M. Quantitative assessment of cerebral vascular reserve by means of transcranial Doppler ultrasound and rebreathing maneuver: bedside test and mathematical modelling. Neurol Sci. 2000;21:292–302. doi: 10.1007/s100720070066. [DOI] [PubMed] [Google Scholar]
- St Croix CM, Cunningham DA, Kowalchuk JM, McConnell AK, Kirby AS, Scheuermann BW, Petrella RJ, Paterson DH. Estimation of arterial PCO2 in the elderly. J Appl Physiol. 1995;79:2086–2093. doi: 10.1152/jappl.1995.79.6.2086. [DOI] [PubMed] [Google Scholar]
- Saito H, Ogasawara K, Suzuki T, Kuroda H, Kobayashi M, Yoshida K, Kubo Y, Ogawa A. Adverse effects of intravenous acetazolamide administration for evaluation of cerebrovascular reactivity using brain perfusion single-photon emission computed tomography in patients with major cerebral artery steno-occlusive diseases. Neurol Med Chir (Tokyo) 2011;51:479–483. doi: 10.2176/nmc.51.479. [DOI] [PubMed] [Google Scholar]
- Sasse SA, Berry RB, Nguyen TK, Light RW, Mahutte CK. Arterial blood gas changes during breath-holding from functional residual capacity. Chest. 1996;110:958–964. doi: 10.1378/chest.110.4.958. [DOI] [PubMed] [Google Scholar]
- Sato K, Sadamoto T, Hirasawa A, Oue A, Subudhi AW, Miyazawa T, Ogoh S. Differential blood flow responses to CO2 in human internal and external carotid and vertebral arteries. J Physiol. 2012;590:3277–3290. doi: 10.1113/jphysiol.2012.230425. [DOI] [PMC free article] [PubMed] [Google Scholar]
- Scouten A, Schwarzbauer C. Paced respiration with end-expiration technique offers superior BOLD signal repeatability for breath-hold studies. Neuroimage. 2008;43:250–257. doi: 10.1016/j.neuroimage.2008.03.052. [DOI] [PubMed] [Google Scholar]
- Silvestrini M, Vernieri F, Pasqualetti P, Matteis M, Passarelli F, Troisi E, Caltagirone C. Impaired cerebral vasoreactivity and risk of stroke in patients with asymptomatic carotid artery stenosis. JAMA. 2000;283:2122–2127. doi: 10.1001/jama.283.16.2122. [DOI] [PubMed] [Google Scholar]
- Silvestrini M, Vernieri F, Troisi E, Passarelli F, Matteis M, Pasqualetti P, Rossini PM, Caltagirone C. Cerebrovascular reactivity in carotid artery occlusion: possible implications for surgical management of selected groups of patients. Acta Neurol Scand. 1999;99:187–191. doi: 10.1111/j.1600-0404.1999.tb07342.x. [DOI] [PubMed] [Google Scholar]
- Skow RJ, Mackay CM, Tymko MM, Willie CK, Smith KJ, Ainslie PN, Day TA. Differential cerebrovascular CO reactivity in anterior and posterior cerebral circulations. Respir Physiol Neurobiol. 2013;189:76–86. doi: 10.1016/j.resp.2013.05.036. [DOI] [PubMed] [Google Scholar]
- Slessarev M, Han J, Mardimae A, Prisman E, Preiss D, Volgyesi G, Ansel C, Duffin J, Fisher JA. Prospective targeting and control of end-tidal CO2 and O2 concentrations. J Physiol. 2007;581:1207–1219. doi: 10.1113/jphysiol.2007.129395. [DOI] [PMC free article] [PubMed] [Google Scholar]
- Sommer LZ, Iscoe S, Robicsek A, Kruger J, Silverman J, Rucker J, Dickstein J, Volgyesi GA, Fisher JA. A simple breathing circuit minimizing changes in alveolar ventilation during hyperpnoea. Eur Respir J. 1998;12:698–701. doi: 10.1183/09031936.98.12030698. [DOI] [PubMed] [Google Scholar]
- Somogyi RB, Vesely AE, Preiss D, Prisman E, Volgyesi G, Azami T, Iscoe S, Fisher JA, Sasano H. Precise control of end-tidal carbon dioxide levels using sequential rebreathing circuits. Anaesth Intensive Care. 2005;33:726–732. doi: 10.1177/0310057X0503300604. [DOI] [PubMed] [Google Scholar]
- Spano VR, Mandell DM, Poublanc J, Sam K, Battisti-Charbonney A, Pucci O, Han JS, Crawley AP, Fisher JA, Mikulis DJ. CO2 blood oxygen level-dependent MR mapping of cerebrovascular reserve in a clinical population: Safety, tolerability, and technical feasibility. Radiology. 2012;266:592–598. doi: 10.1148/radiol.12112795. [DOI] [PubMed] [Google Scholar]
- Steinback CD, Salzer D, Medeiros PJ, Kowalchuk J, Shoemaker JK. Hypercapnic vs. hypoxic control of cardiovascular, cardiovagal, and sympathetic function. Am J Physiol Regul Integr Comp Physiol. 2009;296:R402–R410. doi: 10.1152/ajpregu.90772.2008. [DOI] [PubMed] [Google Scholar]
- Steiner LA, Balestreri M, Johnston AJ, Coles JP, Chatfield DA, Pickard JD, Menon DK, Czosnyka M. Effects of moderate hyperventilation on cerebrovascular pressure-reactivity after head injury. Acta Neurochir Suppl. 2005;95:17–20. doi: 10.1007/3-211-32318-x_4. [DOI] [PubMed] [Google Scholar]
- Stock M, Kontrisova K, Dieckmann K, Bogner J, Poetter R, Georg D. Development and application of a real-time monitoring and feedback system for deep inspiration breath hold based on external marker tracking. Med Phys. 2006;33:2868–2877. doi: 10.1118/1.2219775. [DOI] [PubMed] [Google Scholar]
- Swanson GD, Bellville JW. Step changes in end-tidal CO2: methods and implications. J Appl Physiol. 1975;39:377–385. doi: 10.1152/jappl.1975.39.3.377. [DOI] [PubMed] [Google Scholar]
- Symon L. Experimental evidence for ‘intracerebral steal’ following CO2 inhalation. Scand J Clin Lab Invest Suppl. 1968;102:XIII:A. [PubMed] [Google Scholar]
- Symon L. The concept of intracerebral steal. Int Anesthesiol Clin. 1969;7:597–615. doi: 10.1097/00004311-196907030-00009. [DOI] [PubMed] [Google Scholar]
- Tan CO. Defining the characteristic relationship between arterial pressure and cerebral flow. J Appl Physiol. 2012;113:1194–1200. doi: 10.1152/japplphysiol.00783.2012. [DOI] [PMC free article] [PubMed] [Google Scholar]
- Totaro R, Marini C, Baldassarre M, Carolei A. Cerebrovascular reactivity evaluated by transcranial Doppler: reproducibility of different methods. Cerebrovasc Dis. 1999;9:142–145. doi: 10.1159/000015943. [DOI] [PubMed] [Google Scholar]
- Vernieri F, Pasqualetti P, Passarelli F, Rossini PM, Silvestrini M. Outcome of carotid artery occlusion is predicted by cerebrovascular reactivity. Stroke. 1999;30:593–598. doi: 10.1161/01.str.30.3.593. [DOI] [PubMed] [Google Scholar]
- Vernieri F, Tibuzzi F, Pasqualetti P, Rosato N, Passarelli F, Rossini PM, Silvestrini M. Transcranial Doppler and near-infrared spectroscopy can evaluate the hemodynamic effect of carotid artery occlusion. Stroke. 2004;35:64–70. doi: 10.1161/01.STR.0000106486.26626.E2. [DOI] [PubMed] [Google Scholar]
- Vorstrup S, Brun B, Lassen NA. Evaluation of the cerebral vasodilatory capacity by the acetazolamide test before EC-IC bypass surgery in patients with occlusion of the internal carotid artery. Stroke. 1986;17:1291–1298. doi: 10.1161/01.str.17.6.1291. [DOI] [PubMed] [Google Scholar]
- Willie CK, Macleod DB, Shaw a D, Smith KJ, Tzeng YC, Eves ND, Ikeda K, Graham J, Lewis NC, Day TA, Ainslie PN. Regional brain blood flow in man during acute changes in arterial blood gases. J Physiol. 2012;590:3261–3275. doi: 10.1113/jphysiol.2012.228551. [DOI] [PMC free article] [PubMed] [Google Scholar]
- Wintermark M, Sesay M, Barbier E, Borbely K, Dillon WP, Eastwood JD, Glenn TC, Grandin CB, Pedraza S, Soustiel JF, Nariai T, Zaharchuk G, Caille JM, Dousset V, Yonas H. Comparative overview of brain perfusion imaging techniques. Stroke. 2005;36:e83–e99. doi: 10.1161/01.STR.0000177884.72657.8b. [DOI] [PubMed] [Google Scholar]
- Wise RG, Pattinson KT, Bulte DP, Chiarelli PA, Mayhew SD, Balanos GM, O’Connor DF, Pragnell TR, Robbins PA, Tracey I, Jezzard P. Dynamic forcing of end-tidal carbon dioxide and oxygen applied to functional magnetic resonance imaging. J Cereb Blood Flow Metab. 2007;27:1521–1532. doi: 10.1038/sj.jcbfm.9600465. [DOI] [PubMed] [Google Scholar]
- Yamanaka MK, Sue DY. Comparison of arterial-end-tidal PCO2 difference and dead space/tidal volume ratio in respiratory failure. Chest. 1987;92:832–835. doi: 10.1378/chest.92.5.832. [DOI] [PubMed] [Google Scholar]
- Yonas H, Smith HA, Durham SR, Pentheny SL, Johnson DW. Increased stroke risk predicted by compromised cerebral blood flow reactivity. J Neurosurg. 1993;79:483–489. doi: 10.3171/jns.1993.79.4.0483. [DOI] [PubMed] [Google Scholar]