

Abstract
Western blotting has been used for protein analyses in a wide range of tissue samples for >30 years. Fundamental to Western blotting success are a number of important considerations, which unfortunately are often overlooked or not appreciated. Firstly, lowly expressed proteins may often be better detected by dramatically reducing the amount of sample loaded. Single cell (fibre) Western blotting demonstrates the ability to detect proteins in small sample sizes, 5–10 μg total mass (1–3 μg total protein). That is an order of magnitude less than often used. Using heterogeneous skeletal muscle as the tissue of representation, the need to undertake Western blotting in sample sizes equivalent to single fibre segments is demonstrated. Secondly, incorrect results can be obtained if samples are fractionated and a proportion of the protein of interest inadvertently discarded during sample preparation. Thirdly, quantitative analyses demand that a calibration curve be used. This is regardless of using a loading control, which must be proven to not change with the intervention and also be appropriately calibrated. Fourthly, antibody specificity must be proven using whole tissue analyses, and for immunofluorescence analyses it is vital that only a single protein is detected. If appropriately undertaken, Western blotting is reliable, quantitative, both in relative and absolute terms, and extremely valuable.
 |
Robyn Murphy is a researcher and academic based at La Trobe University in Melbourne Australia. Her broad research interests are in the regulation of skeletal muscle function in health and disease. She has a particular focus on understanding the biochemical properties of muscle at the single cell level. This approach bypasses the ambiguity in findings that typically occur when investigating heterogeneous tissue such as skeletal muscle. Her work is also directed at understanding calcium dependent processes in muscle and the regulation of glycogen metabolism in skeletal muscle. Graham Lamb is a Professor at La Trobe University in Melbourne and holds a Senior Principal Research Fellowship from the National Health and Medical Research Council of Australia. His primary research interests are into molecular mechanisms underpinning the various steps in excitation–contraction coupling in skeletal and cardiac muscle. He and his colleagues pioneered the use of skinned muscle fibres with functional excitation–contraction coupling for investigating muscle function in exercise and disease.
Introduction
In physiology, functional measurements are often coupled with biochemical analyses of tissue. These help us understand the consequences that a particular intervention has on protein(s) of interest. Mechanistic insights can be attained by gauging both the physiological and associated biochemical consequences of given interventions or perturbations of the cellular milieu. In response to some given stimulus, proteins may alter their cellular localisation, undergo post-translational modification(s) or alter in abundance. One of the most commonly used and important biochemical assays in physiology is Western blotting. Proteins are separated using sodium dodecyl sulphate–polyacrylamide gel electrophoresis (SDS–PAGE), transferred to a solid support such as nitrocellulose or PVDF membrane and then analysed using antibodies for specific protein detection. Western blotting, named in 1981 (Burnette, 1981), was first described in 1979 (Towbin et al. 1979). In its original description and as performed by most laboratories, Western blotting is typically a purely semi-quantitative method; however, we have shown that it can be made truly quantitative, either in relative or absolute terms (Mollica et al. 2009; Murphy et al. 2009a, 2011a; Frankenberg et al. 2013). Fundamental to successful Western blotting is consideration of a number of important factors including sample loading amount, sample fractionation, calibration and antibody integrity, which if not appropriately handled may render data meaningless. This review outlines reasons why major discrepancies in results from similar experiments are frequently seen in the literature, and sets out how the key issues can be addressed or highlights particular assumptions that need to be explicitly stated. Key points raised are based around commonly made statements by researchers, falling under four main topics: (i) loading less can improve outcomes in Western blotting; (ii) major problems can occur with sample fractionation; (iii) quantitative analyses require appropriate calibration curves; and (iv) problems frequently arise with antibody specificity.
Loading less to gain more
The abundance of my protein of interest is so low that I must use enriched fractions in order for it to be seen
One reason scientists fractionate tissue is to enrich lowly expressed proteins, thought necessary for their successful detection. Whilst it is logical to suspect that lowly expressed proteins will be more difficult to detect and quantify when amongst more highly expressed proteins, this is not always the case. An analogy here is the difficulty a group of ten red cars might have in crossing a narrow bridge in one minute when 200 white cars are making their way across the same bridge in the same direction. The cars can all make the journey but the red cars are simply outnumbered by the white cars and can't all cross the bridge in time. Whilst some white cars would also miss out on getting to the other side, they still manage to have good representation simply because there are more of them. If, however, there were only 20 white cars and a single red car, then it is possible that all vehicles could get to the other side in the required time. The important point is that there is room for all vehicles on the other side, they just need to be given the optimal conditions to get there – less congestion – so the representation on the other side ends up truly representing the original sample. The same applies for Western blotting. The notion of loading a smaller amount of sample (i.e. 2 instead of 20 μg total protein, analogous to one red car with 20 white cars instead of 10 red cars with 200 white cars), in order to correctly quantify even lowly expressed proteins is one that we use and have shared with other researchers, who have verified the approach works (Perry et al. 2013). Of course some modification is necessary in order to detect proteins when fewer molecules are on the membrane, but this is a simple step of using very sensitive chemiluminescence at the end of a standard Western blotting protocol (Mollica et al. 2009).
I will never have a need to look at single cells; are there any benefits of single cell Western blotting for me?
Even when whole tissue samples are analysed, quantitative analyses are most easily achievable when minimal sample, that is an amount similar to a single cell or muscle fibre segment, is used. Earlier work demonstrated non-linearity of Western blotting when loading as little as 20–40 μg wet weight muscle (5–10 μg total protein; Mollica et al. 2009). The data are shown here in Fig. 1, where it can be seen that the calibration curves reached saturation at 20–50 μg wet weight muscle for the proteins calsequestrin 1 (CSQ1) and AMPK β1, which means that above such loading levels the band intensities underestimate the amount of protein actually present. Single cell Western blotting, such as when using segments of individual skeletal muscle fibres of ∼10–15 μg wet weight, avoids such loading issues, and yet allows measurement of a multitude of different proteins in each sample in its entirety (Murphy, 2011; Murphy et al. 2011b; Dutka et al. 2012; Frankenberg et al. 2013). Use of single cells/fibres also circumvents the major problem of tissue heterogeneity, as exists between metabolically distinct skeletal muscle fibres and in other situations where there is a high degree of variability between neighbouring cells (Owens, 2012). The approach allows full description of individual cell types present in a given tissue or sample.
Figure 1. Detection of CSQ1 and AMPK β1 proteins in rat skeletal muscle.
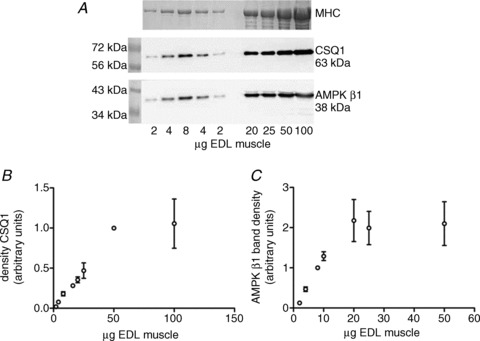
A, total protein from 2–100 μg wet weight rat fast-twitch extensor digitorum longus (EDL) muscle was separated and analysed for CSQ1 and AMPK β1 by Western blotting. The amount of tissue loaded is confirmed by the abundant contractile protein myosin heavy chain (MHC). B and C, calibration curves showing band density versus amount of sample loaded for CSQ1 (B) and AMPK β1 (C), demonstrating that saturation of signal (density) begins at 50 μg wet weight for CSQ1 and 20 μg wet weight for AMPK β1. Each point of the curves represents the average of 3–4 data points and is shown as mean ± SEM. Reprinted from Mollica JP, Oakhill JS, Lamb GD & Murphy RM (2009). Are genuine changes in protein expression being overlooked? Reassessing Western blotting. Analytical Biochemistry 386, 270–275 (Fig. 2). Copyright (2009), with permission from Elsevier.
Problems with sample fractionation
I want to understand if my protein is translocating within a cell, so I must obtain purified fractions or use immunofluorescence to see this translocation
If one wishes to ascertain whether there has been any translocation of a protein of interest, immunofluorescence or purified fractions can be informative. Usually, however, only qualitative data are obtained because the proportion of the total pool of the protein undergoing the translocation typically cannot be ascertained. Experiments using purified fractions can provide quantitative data, but only if the absolute yield and/or the amount of protein lost during protein purification is taken into consideration. Whether 1% or 90% of the total pool translocates is of major physiological and functional relevance. Western blotting provides a means to address this question, but quantitative data are only attained when sample preparation is duly considered. For example, tissue should be examined in its entirety, or if there is any loss or discarding of sample during the sample preparation then it is necessary to ascertain how much of the total pool this represents. It is worth noting that it is possible to measure a sample in its entirety by running each of the various fractions in different lanes across a given Western blot; once any dilutions of the given fractions are taken into account, the density of the relevant band in each lane can be compared to the sum across all lanes, so as to gauge the precise proportion of the protein present in each lane/fraction (Murphy et al. 2011b; Frankenberg et al. 2013). If purified fractions or immunofluorescence are used, the limitation of not knowing how much of the total pool is being examined needs to be stated.
What is the problem with getting rid of cellular debris? I get poor quality Western blots if I don't discard that
During any sample enrichment process it is very likely a proportion of the protein of interest will be lost, hindering the ability to quantitatively determine anything about that protein. In many preparations ‘debris’ is discarded through a simple spin of samples, for example 500–1000 g for 2–5 min or 10,000 g for 5 min if a detergent such as Triton X-100 is used. We have shown such centrifugation of muscle removes ‘debris’ comprising ∼50% of the myosin present and likely a similar proportion of total cellular protein (Murphy et al. 2011a). In that study we also showed that almost two-thirds of the protein of interest, the sarcoplasmic reticulum (SR) Ca2+-binding protein calsequestrin-2 (CSQ2), partitioned into the ‘debris’ fraction. Loss of this amount of sample explained why previous studies reported ∼5-fold underestimation of total CSQ2 content in cardiac SR, highlighting how severely such fractionation can unintentionally affect protein quantitation. A further example is illustrated in Fig. 2. Panels A and B show published data reporting the differential expression of the muscle specific protein caveolin-3 between rat fast-twitch, extensor digitorum longus (EDL) muscle and predominantly slow-twitch soleus muscle (Murphy et al. 2009b). Caveolin-3 was also examined in supernatants obtained from rat EDL and soleus muscles following homogenisation in Tris-Cl buffer–Triton X-100 and spinning at 10,000 g for 5 min. The Western blot (Fig. 2C) and the pooled data (Fig. 2D) show an incorrect result was obtained in this case where parts of the sample were unintentionally discarded prior to analyses. Caveolin-3 may represent an extreme case, as it is localised within cholesterol-rich lipid rafts, which require specific extraction conditions; however, the example demonstrates how incorrect values can be obtained if a fraction rather than whole tissue is examined. This example also highlights that even if all samples are treated in the same manner, there is a possibility the proportion of total signal lost due to sample fractionation is different between the interventions/cases under examination (here EDL versus soleus muscle). Thus, incorrect results can be obtained even though samples were enriched (fractionated) in the same way at the same time. An intervention often employed in studying human muscle physiology is exercise. The changes in cytoplasmic Ca2+ concentrations that occur during and after muscle contractions may affect where a protein resides. The ubiquitous Ca2+-dependent protease, calpain-1, has been shown to bind extremely quickly upon physiologically relevant changes in cytoplasmic [Ca2+] (Murphy et al. 2006). Consequently, the representation of calpain-1 in a supernatant (i.e. cytosolic) fraction may be reduced by an exercise intervention, and presents a further clear case in which fractionation could produce incorrect results. The converse shift occurs with electrical stimulation in the case of the protein glycogen debranching enzyme (GDE; Murphy et al. 2012), as seen in Fig. 3. Only a small proportion of the total GDE pool is diffusible in skeletal muscle fibres obtained from resting muscle (Fig. 3A), whereas the proportion is increased significantly (to 50% of total pool) following fatiguing stimulation (Fig. 3B). Full data can be found in the original paper (Figs 3 and 5 in Murphy et al. 2012).
Figure 2. Detection of caveolin-3 in rat skeletal muscle.
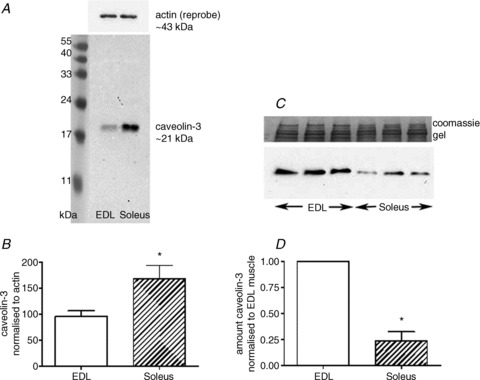
A, caveolin-3 in rat fast-twitch extensor digitorum longus (EDL) and in predominantly slow-twitch soleus muscle fibre segments. B, pooled data, normalised to the abundant contractile protein actin (n= 14). Note: in A and B there was no fractionation of tissue. C and D, when muscle was fractionated (10,000 g spin for 5 min in a Tris–Triton buffer) and the supernatants examined, the apparent abundance of caveolin-3 was incorrect (caveolin amounts expressed relative to that in EDL samples run on a given gel, to allow comparison across gels, n= 6) *Significantly different from EDL (P < 0.05, 2-tailed t test). Panels A and B reprinted from Murphy RM, Mollica JP & Lamb GD (2009b). Plasma membrane removal in rat skeletal muscle fibres reveals caveolin-3 hot-spots at the necks of transverse tubules. Experimental Cell Research 315, 1015–1028 (Fig. 3). Copyright (2010), with permission from Elsevier.
Figure 3. Influence of in vitro stimulation on the localisation of glycogen debranching enzyme in rat skeletal muscle.
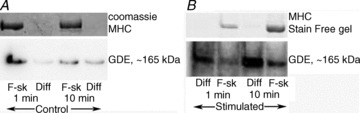
Fibres were collected from rat fast-twitch extensor digitorum longus (EDL) muscle following in vitro electrical stimulation to fatigue (see Murphy et al. 2012 for full details) and from the non-stimulated contralateral (control) muscle. Segments of individual skeletal muscle fibres were mechanically skinned under paraffin oil, and the diffusible constituents collected following washes in physiological-like intracellular solutions for 1 or 10 min. The glycogen debranching enzyme (GDE) present in the wash (Diff) or remaining in the skinned fibre (F-sk) were compared side by side by Western blotting. In the fibres collected from the control muscle the majority of GDE remained in the skinned fibre for both the 1 and 10 min wash cases (A), whereas in the fibres from the stimulated muscle the majority of GDE diffused out into the wash (Diff) in both 1 and 10 min cases (B). Adapted from Figs 3 and 5 of Murphy et al. (2012)), with permission.
Figure 5. Detection of Stim1 in rat whole skeletal muscle preparation using three different antibodies.
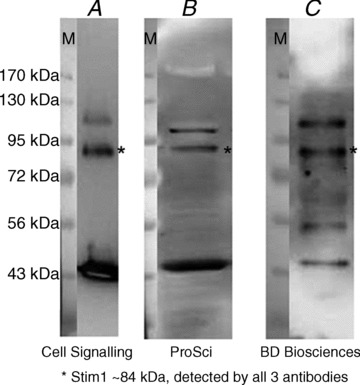
All three antibodies detect multiple proteins; however, they all detect seemingly the same protein based on its migration (molecular weight markers are seen on the superimposed images on the left of each blot, taken as white light images prior to chemiluminescence detection and without moving the membrane). The asterisks indicate the band deemed to be Stim1. As the Western blots show that all the antibodies detect non-specific proteins, it is not possible to use any of them for immunofluorescence detection. This is because, in addition to Stim1, it is likely they would also detect the band at ∼43 kDa and other bands. Given its migration and its abundance in muscle, it is possible that the 43 kDa band represents the abundant protein actin. Reprinted from Edwards JN, Murphy RM, Cully TR, von Wegner F, Friedrich O & Launikonis BS (2010b). Ultra-rapid activation and deactivation of store-operated Ca2+ entry in skeletal muscle, Cell Calcium 47, 458–467 (Supp. Fig. S2). Copyright (2010), with permission from Elsevier.
A final problem with fractionation is when an antibody is being validated for use with immunofluorescence. Immunofluorescence allows visualisation of specific proteins in a tissue sample through the use of antibodies. As for Western blotting, aspects of the technique need to be validated and these will be discussed further below. It is vital that any antibodies used are tested in non-fractionated tissue. Analyses on fractionated samples would not be informative, because protein(s) that the antibody detects non-specifically might be removed from the homogenate, but of course would actually still be present in the whole tissue used for immunofluorescence.
In summary, correct results are most easily obtained when no tissue fractionation is undertaken. The assumed need to undertake fractionation is often unwarranted because even lowly abundant proteins can be successfully detected by simply using less sample and more sensitive signal detection.
Quantitative analyses demand that appropriate calibration is carried out
Do I need a calibration curve, and must it be on every Western blot?
Quantitative biochemical assays typically require a calibration curve that identifies lower and upper limits of detection for each experiment. In Western blotting, a calibration curve can be generated in various ways. Absolute quantification of a protein in a given sample can be achieved by using a calibration curve consisting of known amounts of the purified protein from the same host species (e.g. recombinant or purified from tissue). In this case it is necessary to also validate the Western blotting system to verify that the protein in both its purified form and that present in the given sample are detected with similar efficacy. We perform this additional test by adding purified protein to our sample of interest and assessing the ability of the Western blotting system to detect the protein in all environments (Mollica et al. 2009; Murphy et al. 2009a, 2011a). Once validated, the system can be used to determine the absolute amount of the given protein present in a sample by comparing it to the standard curve generated using known amounts of the protein of interest.
For relative quantification (e.g. determining that there is 1.6 times more of a given protein in sample A compared to sample B) one of two approaches can be used. A range of known standards (e.g. different masses of a particular tissue homogenate) can be run on the same gel as the samples of interest, and the band densities of samples A and B then compared to those on the calibration curve constructed from the range of standards (e.g. Fig. 5 in Murphy et al. 2011a; Fig. 1 in Frankenberg et al. 2013). Alternatively, for both samples A and B, a 3–5 point calibration curve can be constructed using the samples themselves and the slopes of linear regressions for the two samples compared, as described previously (Edwards et al. 2010) and shown again here in Fig. 4. Panels B and C in Fig. 4 demonstrate that even though the signal intensities (band density, y-axis) may each be almost linear relative to the amounts of sample loaded (x-axis), there is often a finite threshold for detection (arrow in panel B), which means that signal intensity is not directly proportional to the amount loaded. As a result it is incorrect to assume that a doubling of density necessarily indicates a doubling in the amount of protein present, emphasising the importance of having a calibration curve on every Western blot. To explain how this non-proportionality can affect outcomes, it is worth focusing on the data for Orai1 in Fig. 4B. In the wild-type (wt) mouse sample the threshold of detection, which is the point on the x-axis where no signal is obtained despite sample being present, falls at ∼3 μg muscle (arrow). For muscle from the mdx mouse the intercept is close to the origin (i.e. ∼zero). Now consider if only 7 μg muscle were compared from mdx and wt animals (red dotted lines) there would appear to be ∼10-fold difference in the Orai1 protein, whereas the outcome would be half that (i.e. ∼5-fold difference) if 17 μg muscle were compared (blue dashed lines). The improvement in the procedure here is that the signals are examined across a range of different sample amounts, and comparing the slopes of the two calibration curves provides a more accurate representation of the relative amounts of Orai1 protein in muscle of mdx and wt animals (as depicted in pooled data in Fig. 4D) than would be obtained by comparing single amounts of the two samples.
Figure 4. Using appropriate calibration procedures to correctly quantify protein levels.
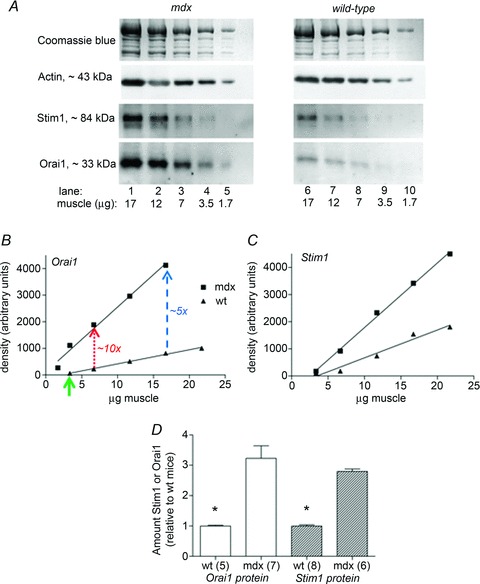
A, Western blots for a range of sample amounts of whole EDL skeletal muscle homogenates, obtained from dystrophic mdx and wild-type (wt) mice, and detection of Stim1 and Orai1, proteins involved in store-operated calcium entry. B and C, calibration curves for examples in A. In B, arrow highlights threshold of detection for Orai1 in muscle from wt mice, and when 7 μg of each tissue was loaded the difference in Orai1 amount between mdx and wt appears to be ∼10-fold (red dotted line), whereas when 17 μg tissue of the same samples was loaded the difference in Orai1 appears to be only ∼5-fold (blue dashed line). D, abundance of Orai1 and Stim1, assessed by comparing the slopes of the respective calibration curves (mdx relative to wt). n indicates number of muscle preparations; *indicates wt significantly different from mdx (P < 0.05). Adapted from Fig. 7 of Edwards et al. (2010a), with permission.
Finally, it is important to note that immunofluorescence images cannot be appropriately calibrated, and consequently that technique does not provide quantitative data.
Is it necessary to use an appropriate housekeeping protein for my Western blots?
Housekeeping proteins are typically used to take into account any variation in loading amounts between samples to be compared. The protein of interest can be normalised to the housekeeping protein and this is often undertaken in addition to the total protein assay prior to Western blotting. It is common to see proteins such as GAPDH or α-tubulin used as ‘housekeeping proteins’ in Western blotting. We stress that, as described for the protein of interest, it is vital that the detection of any housekeeping protein is also assessed against its own calibration curve. A housekeeping protein is often chosen because of its high abundance, and yet this is the very reason why its use can be quite inappropriate. With very abundant proteins the signal intensity may well show saturation at comparatively low sample loading, and using such saturated signals to normalise the primary data would produce a totally incorrect outcome (see Mollica et al. 2009). Furthermore, the use of any housekeeping protein needs to be fully justified, in particular it should be shown not to change with the intervention under examination, which in practice is often difficult and rarely done. The use of a housekeeping protein, however, is not required if the alternative approach described above is used, in which the slopes of linear regressions for individual tissue samples are compared. In many circumstances it is possible to normalise the protein of interest to the total cellular protein, although for reasons already stated, that must be in non-fractionated samples. The introduction of Stain-free gel technology allows total protein to be ascertained in samples prior to the transfer step in Western blotting, as described previously (Murphy et al. 2011a,b). Stain-free technology is particularly useful in circumstances where it is not possible to run a total protein assay. An example is when single cells are analysed and there is typically not enough sample to run a total protein assay in addition to a Western blot. The calibration curve on the Stain-free gel can be used to establish the amount of total protein in each sample. If the researcher chooses to use a housekeeping protein to verify uniform transfer in all lanes, then in addition to having a calibration curve and having established its invariance with treatment, the housekeeping protein needs to be of a similar molecular weight to the protein of interest.
Antibody specificity must be proven in whole tissue analyses
Why can't I just use the antibody datasheet to understand all I need to know about my antibody?
Fundamental to the success of Western blotting and indeed any immuno-based assay, such as immunofluorescence, immunoelectron microscopy and ELISA assays, is the ability for the antibody to detect the protein of interest. A complication for researchers is that reliability of antibodies can be less than perfect. For applications other than Western blotting (e.g. immunofluorescence), the antibody must detect only a single species, as output readings are unable to indicate whether they are reflecting single or multiple species. Western blotting has the advantage that separate bands representing the different proteins are produced by the electrophoretic separation, and so once the correct protein is identified, non-specific protein detection is less problematic. Figure 5 provides an example of validation data, where the asterisked band was identified as the protein of interest. In that example, three commercial antibodies targeting different regions of the stromal-interaction molecule 1 (Stim1) protein were used. Despite non-specific detection of proteins, sometimes with high efficacy such as the band at ∼43 kDa (likely to be the abundant protein actin), it appeared that Stim1 could be identified as the band between the 72 and 95 kDa markers that all three antibodies detected. In summary, antibody datasheets typically do not provide tissue specific data, or comprehensive sample preparation information, and it is imperative that researchers undertake their own antibody validation work on their particular tissue of interest.
I know the molecular weight of my protein, therefore I know which band is my protein of interest. Beware – size is not definitive: anomalous migration of proteins in SDS–PAGE
Even with electrophoretic separation of proteins, positive identification of the protein being detected by antibodies should be undertaken. Anomalous migration in gels can mean proteins do not necessarily migrate at their expected molecular weight. It is also possible the same protein migrates differentially on gels of different constitution. The calcium binding proteins calsequestrin-1 (CSQ1) and calsequestrin-2 (CSQ2) are good examples to discuss. CSQ1 and CSQ2 have predicted molecular weights of 47.8 and 45.3 kDa, respectively; however, in Tris-Cl SDS–PAGE gels using a basic running buffer (pH 8.3), they migrate at ∼63 and 55 kDa, respectively. These migrations are the same for CSQ1 and CSQ2 present as either purified proteins or in whole skeletal muscle homogenates (Murphy et al. 2009a). However, when using Bis-Tris-Cl gels, run at a more neutral pH (pH 7.3), CSQ1 migrates faster (smaller molecular weight) than CSQ2 (Hernandez et al. 2012). The denaturing conditions used in SDS–PAGE, which includes using SDS to bind all proteins and give them an overall negative charge, overriding the native charge that the proteins possess, means that aberrant movement of CSQs is likely due to their highly anionic nature (MacLennan & Wong, 1971). This example highlights that molecular weight and migration in SDS–PAGE gels do not always match, and hence that apparent size should not be the only parameter used to validate a protein.
How do I determine the validity of an antibody for use in immunoassays?
For Western blotting purposes, an antibody can be tested for its positive identification of a purified or overexpressed protein or confirmation of its absence in tissue from knock-out animals (Murphy et al. 2009a; Murphy, 2011; Larkins et al. 2012). However, before it can be used for immunofluorescence, rigid testing of an antibody must be undertaken. One test is to perform the same experiments in samples where the only difference is the absence of the protein of interest (i.e. knock-out animals). The proviso here is that the outcome should not be influenced by any up- or down-regulation of other proteins which might occur as a consequence of protein ablation. Proteomics (e.g. sequencing by mass spectrometry: MS/MS followed by either LC/MS/MS or MALDI-TOF/TOF) can also be used for verification that an antibody is detecting the protein of interest, although it requires relevant expertise for success. Western blotting is a further test that can provide some validation of the antibody, although this is not perfect because it is typically performed using denaturing conditions whereas immunofluorescence detects proteins in their native state. Even so, if Western blotting is used, it is vital that antibodies are tested in non-fractionated tissue over a reasonably large molecular weight range (e.g. 10–300 kDa). This case is illustrated in Fig. 5, where it is clear that if any of those antibodies were used for immunofluorescence they would be likely to detect actin in addition to Stim1 and would therefore give misleading results.
How do I know which antibody to purchase?
We don't believe there is an easy solution to this question. As a start, we believe researchers should include, and reviewers insist on seeing, full antibody details including catalogue number and even batch details, in manuscripts. Also, inclusion of important validation data should be allowed within the body of work and not forced into supplementary data, which is perhaps less accessible and/or is less accessed by readers. From experience and in speaking with colleagues, a real concern is variability between different batches of the same antibody. Including batch details in manuscripts would also help researchers make a case to companies that an antibody is not as sold. This might also force the commercial companies to supply valid datasheets, where data from the actual batch of antibody being sold is provided, along with references where the actual antibody described has been used.
Conclusion
In our laboratories, single cell (fibre) Western blotting is routinely performed, and one of the main undertakings has been to develop techniques for quantitative assessment of numerous proteins in the same segment of skeletal muscle fibres (Murphy, 2011; Dutka et al. 2012; Thomassen et al. 2013). We are able to detect various proteins, of large and small molecular weights, of differing structures and various localisations in skeletal muscle. Using a uniform approach, these proteins are efficiently extracted, separated using SDS–PAGE, transferred to membrane and detected with their specific antibodies (Mollica et al. 2009; Murphy, 2011). The greatest advantage of this approach is that proteins can be examined quantitatively because only small sample sizes are used. ‘Single cell Western blotting’ provides the platform to work within a non-saturating range, a crucial aspect of the technique. Quantitative analyses are valid when whole (non-fractionated) samples are assessed, a calibration curve is included on each Western blot, and the integrity of the antibody is validated.
Acknowledgments
We wish to thank Professor Glenn McConell (Victoria University) for critically evaluating the manuscript. Also, thank you to the members of our research laboratories who read the manuscript.
Glossary
Abbreviations
- AMPK β1
AMP kinase β1
- CSQ1 and 2
calsequestrin 1 and 2
- EDL
extensor digitorum longus
- GDE
glycogen debranching enzyme
- MHC
myosin heavy chain
- SDS–PAGE
sodium dodecyl sulphate–polyacrylamide gel electrophoresis
- SR
sarcoplasmic reticulum
- Stim1
stromal-interaction molecule 1
- wt
wild-type
Additional information
Competing interests
The authors report no conflict of interest.
References
- Burnette WN. “Western blotting”: electrophoretic transfer of proteins from sodium dodecyl sulfate–polyacrylamide gels to unmodified nitrocellulose and radiographic detection with antibody and radioiodinated protein A. Anal Biochem. 1981;112:195–203. doi: 10.1016/0003-2697(81)90281-5. [DOI] [PubMed] [Google Scholar]
- Dutka TL, Lamboley CR, McKenna MJ, Murphy RM, Lamb GD. Effects of carnosine on contractile apparatus Ca2+-sensitivity and sarcoplasmic reticulum Ca2+ release in human skeletal muscle fibers. J Appl Physiol. 2012;112:728–736. doi: 10.1152/japplphysiol.01331.2011. [DOI] [PubMed] [Google Scholar]
- Edwards JN, Friedrich O, Cully TR, von Wegner F, Murphy RM, Launikonis BS. Upregulation of store-operated Ca2+ entry in dystrophic mdx mouse muscle. Am J Physiol Cell Physiol. 2010a;299:C42–C50. doi: 10.1152/ajpcell.00524.2009. [DOI] [PubMed] [Google Scholar]
- Edwards JN, Murphy RM, Cully TR, von Wegner F, Friedrich O, Launikonis BS. Ultra-rapid activation and deactivation of store-operated Ca2+ entry in skeletal muscle. Cell Calcium. 2010b;47:458–467. doi: 10.1016/j.ceca.2010.04.001. [DOI] [PubMed] [Google Scholar]
- Frankenberg NT, Lamb GD, Vissing K, Murphy RM. Sub-cellular fractionation reveals HSP72 does not associate with SERCA in human skeletal muscle following damaging eccentric and concentric exercise. J Appl Physiol. 2013 doi: 10.1152/japplphysiol.00161.2013. (in press) [DOI] [PubMed] [Google Scholar]
- Hernandez A, Schiffer TA, Ivarsson N, Cheng AJ, Bruton JD, Lundberg JO, Weitzberg E, Westerblad H. Dietary nitrate increases tetanic [Ca2+]i and contractile force in mouse fast-twitch muscle. J Physiol. 2012;590:3575–3583. doi: 10.1113/jphysiol.2012.232777. [DOI] [PMC free article] [PubMed] [Google Scholar]
- Larkins NT, Murphy RM, Lamb GD. Absolute amounts and diffusibility of HSP72, HSP25 and αB-crystallin in fast- and slow-twitch skeletal muscle fibers of rat. Am J Physiol Cell Physiol. 2012;302:C228–C239. doi: 10.1152/ajpcell.00266.2011. [DOI] [PubMed] [Google Scholar]
- MacLennan DH, Wong PT. Isolation of a calcium-sequestering protein from sarcoplasmic reticulum. Proc Natl Acad Sci U S A. 1971;68:1231–1235. doi: 10.1073/pnas.68.6.1231. [DOI] [PMC free article] [PubMed] [Google Scholar]
- Mollica JP, Oakhill JS, Lamb GD, Murphy RM. Are genuine changes in protein expression being overlooked? Reassessing Western blotting. Anal Biochem. 2009;386:270–275. doi: 10.1016/j.ab.2008.12.029. [DOI] [PubMed] [Google Scholar]
- Murphy RM. Enhanced technique to measure proteins in single segments of human skeletal muscle fibers: fiber type dependence of AMPK alpha1 and beta1. J Appl Physiol. 2011;110:820–825. doi: 10.1152/japplphysiol.01082.2010. [DOI] [PubMed] [Google Scholar]
- Murphy RM, Larkins NT, Mollica JP, Beard NA, Lamb GD. Calsequestrin content and SERCA determine normal and maximal Ca2+ storage levels in sarcoplasmic reticulum of fast- and slow-twitch fibres of rat. J Physiol. 2009a;587:443–460. doi: 10.1113/jphysiol.2008.163162. [DOI] [PMC free article] [PubMed] [Google Scholar]
- Murphy RM, Mollica JP, Beard NA, Knollmann BC, Lamb GD. Quantification of calsequestrin 2 (CSQ2) in sheep cardiac muscle and Ca2+-binding protein changes in CSQ2 knockout mice. Am J Physiol Heart Circ Physiol. 2011a;300:H595–H604. doi: 10.1152/ajpheart.00902.2010. [DOI] [PMC free article] [PubMed] [Google Scholar]
- Murphy RM, Mollica JP, Lamb GD. Plasma membrane removal in rat skeletal muscle fibers reveals caveolin-3 hot-spots at the necks of transverse tubules. Exp Cell Res. 2009b;315:1015–1028. doi: 10.1016/j.yexcr.2008.11.022. [DOI] [PubMed] [Google Scholar]
- Murphy RM, Verburg E, Lamb GD. Ca2+ activation of diffusible and bound pools of μ-calpain in rat skeletal muscle. J Physiol. 2006;576:595–612. doi: 10.1113/jphysiol.2006.114090. [DOI] [PMC free article] [PubMed] [Google Scholar]
- Murphy RM, Vissing K, Latchman H, Lamboley C, McKenna MJ, Overgaard K, Lamb GD. Activation of skeletal muscle calpain-3 by eccentric exercise in humans does not result in its translocation to the nucleus or cytosol. J Appl Physiol. 2011b;11:1448–1458. doi: 10.1152/japplphysiol.00441.2011. [DOI] [PubMed] [Google Scholar]
- Murphy RM, Xu H, Latchman H, Larkins NT, Gooley PR, Stapleton DI. Single fiber analyses of glycogen-related proteins reveal their differential association with glycogen in rat skeletal muscle. Am J Physiol Cell Physiol. 2012;303:C1146–C1155. doi: 10.1152/ajpcell.00252.2012. [DOI] [PubMed] [Google Scholar]
- Owens B. The single life. Nature. 2012;491:27–29. doi: 10.1038/491027a. [DOI] [PubMed] [Google Scholar]
- Perry CG, Kane DA, Lanza IR, Neufer PD. Methods for assessing mitochondrial function in diabetes. Diabetes. 2013;62:1041–1053. doi: 10.2337/db12-1219. [DOI] [PMC free article] [PubMed] [Google Scholar]
- Thomassen M, Murphy RM, Bangsbo J. Fibre type-specific change in FXYD1 phosphorylation during acute intense exercise in humans. J Physiol. 2013;591:1523–1533. doi: 10.1113/jphysiol.2012.247312. [DOI] [PMC free article] [PubMed] [Google Scholar]
- Towbin H, Staehelin T, Gordon J. Electrophoretic transfer of proteins from polyacrylamide gels to nitrocellulose sheets – procedure and some applications. Proc Natl Acad Sci U S A. 1979;76:4350–4354. doi: 10.1073/pnas.76.9.4350. [DOI] [PMC free article] [PubMed] [Google Scholar]