

Abstract
The major source of serotonin (5-HT) in the body is the enterochromaffin (EC) cells lining the intestinal mucosa of the gastrointestinal tract. Despite the fact that EC cells synthesise ∼95% of total body 5-HT, and that this 5-HT has important paracrine and endocrine roles, no studies have investigated the mechanisms of 5-HT release from single primary EC cells. We have developed a rapid primary culture of guinea-pig and human EC cells, allowing analysis of single EC cell function using electrophysiology, electrochemistry, Ca2+ imaging, immunocytochemistry and 3D modelling. Ca2+ enters EC cells upon stimulation and triggers quantal 5-HT release via L-type Ca2+ channels. Real time amperometric techniques reveal that EC cells release 5-HT at rest and this release increases upon stimulation. Surprisingly for an endocrine cell storing 5-HT in large dense core vesicles (LDCVs), EC cells release 70 times less 5-HT per fusion event than catecholamine released from similarly sized LDCVs in endocrine chromaffin cells, and the vesicle release kinetics instead resembles that observed in mammalian synapses. Furthermore, we measured EC cell density along the gastrointestinal tract to create three-dimensional (3D) simulations of 5-HT diffusion using the minimal number of variables required to understand the physiological relevance of single cell 5-HT release in the whole-tissue milieu. These models indicate that local 5-HT levels are likely to be maintained around the activation threshold for mucosal 5-HT receptors and that this is dependent upon stimulation and location within the gastrointestinal tract. This is the first study demonstrating single cell 5-HT release in primary EC cells. The mode of 5-HT release may represent a unique mode of exocytosis amongst endocrine cells and is functionally relevant to gastrointestinal sensory and motor function.
Key points
Enterochromaffin (EC) cells are enteroendocrine cells that synthesise ∼95% of the body's total serotonin (5-HT).
Although 5-HT release from EC cells plays a number of important physiological roles, primary EC cells have not been studied at the single cell level.
This study provides the first functional characterisation of single primary guinea-pig and human EC cells.
EC cells release 5-HT from large dense core vesicles in a calcium-dependent manner with kinetics surprisingly resembling release from synaptic vesicles.
3D modelling indicates that the quantity of 5-HT released per vesicle fusion event is physiologically relevant to GI tract function in terms of the concentrations needed to activate local 5-HT receptors.
These findings represent significant advances in our understanding of EC cell function and will be of broad interest to researchers in endocrine cell biology, gastroenterology, neuroscience, exocytosis and glucose control.
Introduction
Enterochromaffin (EC) cells are enteroendocrine cells providing ∼95% of total body 5-HT (Gershon & Tack, 2007). Enteroendocrine cells collectively represent the largest endocrine organ in our body and EC cells are the major enteroendocrine cell. Gut-derived 5-HT serves diverse endocrine roles in blood clotting, liver regeneration, bone formation (Karsenty & Gershon, 2011), embryo development (Cote et al. 2007), glucose homeostasis (Sumara et al. 2012) and the increased β-cell mass that prevents gestational diabetes (Kim et al. 2010). EC cell 5-HT also serves multiple paracrine roles in the gastrointestinal (GI) tract by modulating peristaltic and secretory reflexes as well as activating extrinsic sensory nerves (Gershon & Tack, 2007; Keating & Spencer, 2010; Spencer et al. 2011). EC cells respond to luminal stimuli including distension, acid and glucose to activate 5-HT3 receptors on vagal mucosal afferent fibres (Blackshaw & Grundy, 1993; Lee et al. 2011). 5-HT3 receptor antagonists are used clinically to reduce the nausea and vomiting caused by chemotherapy-induced surges in EC cell 5-HT release that activate mucosal vagal afferent fibres innervating the brainstem vomiting centres (Gershon & Tack, 2007). Altered EC cell 5-HT levels have been implicated in functional gastrointestinal disorders such as irritable bowel syndrome (IBS) and inflammatory bowel disease (IBD). 5-HT4 receptor agonists have been used to treat chronic constipation (Gershon & Tack, 2007) and inhibition of TPH1, the rate-limiting enzyme in gut-derived serotonin biosynthesis, has clinical benefits in patients with non-constipating IBS (Brown et al. 2011). EC cell 5-HT release is increased in inflammatory bowel disorders such as Crohn's disease (Kidd et al. 2009) or experimental models of colitis (Bertrand et al. 2010) and 5-HT availability is a negative effector of the severity of inflammation in rodent models of IBD (Bischoff et al. 2009; Ghia et al. 2009; Haub et al. 2010).
Despite their importance, however, primary EC cells have yet to be studied at the single cell level. Previous investigations utilised cell lines derived from pancreatic carcinomas (Kim et al. 2001; Braun et al. 2007) or the human small intestinal carcinoid-derived neoplasia (Kidd et al. 2007), but how closely their function represents primary EC cell function is questionable. Results from studies of primary EC cell function using whole tissue or isolated crypts (Lomax et al. 1999; Nozawa et al. 2009; Keating & Spencer, 2010) are confounded by indirect effects from non-EC cells, such as neurons, epithelial cells and myocytes, in these preparations, or by gut wall contraction, which is a major stimulus of EC cell 5-HT release (Keating & Spencer, 2010). While enzyme-linked immunosorbent assay (ELISA) assays of 5-HT release from primary human EC cell cultures have illustrated responses to a number of physiological stimuli (Kidd et al. 2008), no study has yet demonstrated the cellular mechanisms by which 5-HT is released from primary single EC cells.
The aims of this present study are to characterise the mechanisms underlying the release of 5-HT from primary EC cells, and to compare these mechanisms between the human and the commonly studied animal model of GI function, the guinea-pig, and to compare this with release from other endocrine cells. We additionally have developed sophisticated three-dimensional models of the diffusion of 5-HT released from EC cell populations throughout the GI tract to understand what the implications of the EC cell release mechanisms would be for activation of 5-HT receptors located on mucosal nerve endings.
Methods
Primary culture and purification of guinea-pig and human EC cells
Adult guinea-pigs were killed humanely by stunning with a blow to the head followed by severing of the carotid arteries, as approved by the Flinders University Animal Welfare Committee. Four to six centimetres of distal colon was removed and EC cell isolation and purification was conducted using an approach modified from those previously published (Schafermeyer et al. 2004; Kidd et al. 2006). The mucosal layer of the colon was scraped off, minced and washed once in Buffer A (in mm: 140 NaCl, 5 KCl, 2 CaCl2, 1 MgCl2, 10 Hepes, 5 d-glucose, pH 7.4). The tissue was then digested in trypsin–EDTA (0.05%) with collagenase A (1 mg ml−1, Roche Diagnostics GmbH, Mannheim, Germany) at 37°C for 30 min with continuous agitation. An equal volume of growth medium (DMEM containing 10% FBS, 1%l-glutamine and 1% penicillin–streptomycin) stopped this reaction. The suspension was filtered through a 40 μm steel mesh filter and centrifuged (Sigma, 6K15, USA) at 1000 ×g. The resultant pellet was resuspended in 1 ml of growth medium and layered onto a Percoll density gradient formed according to manufacturer's instructions. After centrifuging at 1100 ×g for 8 min with slow braking, EC cells were harvested at a density of approximately 1.07 g l−1, washed once with growth medium and plated onto 6 cm2 pre-treated cell culture dishes (Iwaki, from VWR Intl Pty Ltd, Murrarrie, QLD, Australia). EC cells were maintained in growth medium for 2–4 days. All chemicals were from Sigma-Aldrich (St. Louis, MO, USA) unless otherwise stated. Human colon tissue samples were obtained with prior informed consent from patients undergoing elective colectomy at the Flinders Medical Centre under the approval of the Southern Adelaide Clinical Human Research Ethics Committee. Cultures were obtained from four female patients aged 54–88 years old. Approximately 2 cm2 of mucosa was dissected from areas of colon well removed from the site of tumours. As the surgery is performed to remove all neoplasia from the patient, we are confident that obtaining tissue so distal from the neoplasia represents normal tissue. This tissue was processed as described above and EC cells plated and studied in the first 24 h post culture. EC cell viability was measured by incubating cells with Trypan Blue (0.2% final concentration) for 5–10 min at 37°C followed by a cell count on a haemocytometer. Cells were considered viable if they completely excluded the dye. All results are from at least three separate cell cultures.
Immunocytochemical analysis of EC cell purification
EC cells were grown for 24 h on glass coverslips previously coated with 10 μg ml−1 each of poly-d-lysine and laminin (Sigma-Aldrich) in growth medium. Cells were fixed for 18–20 h in Zamboni's fixative at 4°C followed by serial 5 min washes as follows: 4 × 80% EtOH, 2 × 100% EtOH, 3 × DMSO, 4 × PBS. Fixed cells were incubated for 30 min in 10% normal donkey serum diluted in antibody diluent (290 mm NaCl, 7.5 mm Na2HPO4, 2.6 mm Na2HPO4.2H2O, 0.1% NaN3 in distilled water, pH 7.1), followed by incubation for 24 h in a humid chamber with goat monoclonal antibody against 5-HT (Jackson Immunoresearch, West Grove, PA, USA, 1:400) or sheep monoclonal antibody against TPH-1 (Millipore, Billerica, MA, USA, Cat. No. AB1541, 1:200). After three washes with PBS, the cells were incubated with donkey anti-goat IgG or donkey anti-sheep IgG tagged with Cy3 (Jackson Immunoresearch, 1:200 and DAPI (Sigma-Aldrich, 1:500) for 2 h in a humid chamber. Cells were then washed 3 times with PBS and the coverslips mounted onto glass slides in buffered glycerol. Fluorescence was visualised on a Leica TCS SP5 Spectral confocal microscope. The purity of the EC cell culture was calculated by assessing the proportion of DAPI-positive cells which were 5-HT-positive. Using this approach we calculated that the cells in these cultures were 98% 5-HT-positive.
Carbon fibre amperometric analysis of 5-HT release
Release of 5-HT from single EC cells was measured using carbon fibre amperometry (Keating et al. 2008). A carbon fibre electrode (ProCFE, Dagan Corporation, Minneapolis, MN, USA) was placed directly above an EC cell and +400 mV applied to the electrode under voltage clamp conditions as this is the oxidation peak for 5-HT. Current due to 5-HT oxidation was recorded using an EPC-9 amplifier and Pulse software (HEKA Electronic, Germany) with the current sampled at 100 kHz and low-pass filtered at 3 kHz. For quantitative analysis files were converted to Axon Binary Files (ABF Utility, version 2.1, Synaptosoft, USA) and secretory spikes analysed (Mini Analysis, version 6.0.1, Synaptosoft, USA). The standard bath solution was Buffer A. High K+-containing solution was the same as Buffer A except that 70 mm K+ replaced an equimolar amount of NaCl. To analyse the effect of Ca2+ entry on 5-HT release, cells were exposed to 70 mm K+ in the absence of external Ca2+. All solutions were applied to cells using a gravity perfusion system at 34–37°C.
For recordings from EC cells, amperometric spikes were selected for analysis of event frequency if spike amplitude exceeded 10 pA. For spike frequency calculations we counted spikes occurring within 60 s of the start of stimulation. For kinetic analysis of spikes only those events that were not overlapping were included. Rise time of each spike was calculated from the 50–90% rising phase. Chromaffin cells and chromaffin cell amperometry data were obtained from adult mice as previously described (Zanin et al. 2011). All spikes that met our selection criteria were included in calculating the median values of each spike parameter for each recording. The averages of these median values were then used to compare each parameter between cell populations (Colliver et al. 2001). This provides a parametric data set which was subsequently tested for statistical differences using an unpaired Student's t test. For comparisons of spike kinetics in unstimulated and stimulated cells, we pooled all the spike data as we could not obtain a meaningful median value in many unstimulated cell recordings due to the low number of spikes. These data sets were compared using a Mann–Whitney test for non-parametric data sets. P < 0.05 was taken as the lowest level of statistical significance. All data presented are shown as means ± SEM and all data are from at least three different cell cultures.
Ca2+ currents
Changes in EC cell Ca2+ level were measured at 34–37°C using previously described methods (Zanin et al. 2011). Whole-cell perforated patch clamp was performed using a EPC-10 patch clamp amplifier and PatchMaster software (HEKA Electronik, Lambrecht/Pfalz, Germany). Patch pipettes were pulled from borosilicate glass and fire polished, with a resistance of 3–5 MΩ. Patch clamping was performed in the whole-cell configuration for measurement of Ca2+ currents, using an internal solution containing (in mm): 135 caesium glutamate, 9 NaCl, 10 Hepes, 0.5 TEA-Cl, pH 7.2. External solution contained (in mm): 150 NaCl, 2.8 KCl, 10 Hepes, 2 MgCl2, 10 CaCl2, 10 glucose, (pH 7.4). Calcium currents were elicited in the voltage-clamp mode using a voltage step protocol, in which voltage was stepped from a holding potential of −80 mV to voltages between −80 and 50 mV (10 mV increments) for 100 ms. Series resistance was compensated at least 70%.
Calcium imaging
EC cells were treated with Fluo-4 (4 μm) in serum-free DMEM for 30 min at 37°C. Cells were washed twice in Buffer A, which also served as the standard bath buffer. Cells were stimulated for 60 s with the same solution as Buffer A except that 70 mm K+ replaced an equimolar amount of NaCl. An electron multiplied (EM-CCD) camera (Cascade II 512, Roper Scientific, Tucson, AZ, USA) was used to record dynamic changes in fluorescence activity from EC cells. Data were acquired at 2 Hz, All imaging data were acquired and analysed using Imaging Workbench (Version 6.0; Indec Biosystems; Santa Clara; CA, USA). All experiments were carried out at 34–37°C.
Measurements of EC cell density throughout the GI tract
Tissues from pre-selected regions of guinea-pig gastrointestinal tract were dissected free and placed in Krebs solution (in mm: 117 NaCl, 5 KCl; 1.2MgSO4, 25 NaHCO3, 1.2 NaH2PO4, 2.5 CaCl2, 10 glucose, bubbled with 95% O2–5% CO2, pH 7.4) containing 1 μm nicardipine. Samples were taken from the mid-oesophagus (oesophagus) and the lower oesophageal sphincter region (cardia), the fundus, corpus and antrum of the stomach, the antral–pyloric border, the pyloric sphincter region and the duodenal–pyloric border, the mid-duodenum, the proximal, mid- and distal ileum, the caecum, the proximal and distal colon and the rectum. The tissues were pinned on Sylgard blocks with maximal stretching and taken through the fixation, clearing and impregnation processes while pinned to these blocks. Tissue was fixed overnight in modified Zamboni's fixative (2% formaldehyde and 15% picric acid in 0.1 m phosphate buffer, pH 7.0) and cleared in dimethyl sulphoxide (DMSO) for 30 min with the solution changed every 10 min. Samples were then dehydrated through an alcohol series comprising 50%, 70% and 95% ethanol for 15 min in each solution and in 100% ethanol for 1 h. The tissues were then impregnated with polyethylene glycol (Sigma-Aldrich, USA), by immersion in PEG 200 followed by PEG 400, for 1 h in each solution at room temperature. The tissues were then placed in a solution of PEG 1000 for 60 min, in vacuo, and with a desiccant (silica gel) at 45–48°C. The tissues were unpinned from the Sylgard blocks, trimmed, oriented in PEG 1400 in a cryo-mould and then embedded in PEG 1400 by hardening at −20°C for 5 min, in vacuo. The blocks were sectioned at 60 μm thickness on a rotary microtome at room temperature. The sections were placed on agarose (Sigma-Aldrich, USA) sheets 3% in phosphate-buffered saline (PBS) and the agarose sheets were placed on chrome alum slides with the sections contacting the slides. The slides, with the agarose sheets, were then dehydrated, in vacuo, with P2O5 for 20 min, placed in PBS on a rocker until the agarose sheets floated free, leaving the sections adhering to the slides. The slides were kept overnight, at room temperature in fresh PBS to further enhance the removal of the PEG from the sections.
Immunoreactivity for 5-HT was revealed by indirect immunofluorescence with sections incubated overnight in goat anti-5-HT (108072, 1:1000, Incstar) primary antibody in a humidified chamber. The primary antisera were visualised using CY3 conjugated donkey anti-goat IgG (Jackson, Pennsylvania, USA, code: 26035, 1:300). The tissues were incubated overnight with the secondary antibodies. The sections were then mounted in bicarbonate-buffered glycerol and analysed. EC cells from each region were clearly identified by their immunoreactivity for 5-HT and counted in three guinea-pigs. A standard sample area of 200 μm × 200 μm was used for cell counts on a Vanox Olympus microscope fitted with epifluorescence. Images were processed using Image J (Bethesda, MD, USA). Sample areas were taken from all levels in the mucosa, oriented to exclude muscularis mucosa or regions that lacked tissue. Ten random samples were taken from each area, from each animal, and cell density per unit volume of tissue calculated in each region. Using a section thickness approximately twelve times the diameter of the EC cells and accurately defining cell morphology minimised sampling errors (Coggeshall & Lekan, 1996).
Simulation model
An explicit finite-differences model (described in more detail below), incorporating release of serotonin from EC cells, diffusion of serotonin, and uptake of serotonin by the SERT was used to simulate 5-HT concentrations within the mucosa of different GI regions.
Single-cell models
Single-cell release models were of dimensions 50 μm per side, discretised in 1 μm steps (see equations below), with the entire volume representing the mucosa layer, and with a single release site at the centre of the volume. This system was simulated for a sufficient amount of time for numerous release events to occur.
Tissue models
Tissue models consisted of a cuboid region of dimensions between 400–1000 μm per side, discretised in 10 μm steps (see equations below: Δx, Δy, Δz= 10 μm). For these models a mucosal cell was assumed to be of dimensions 10 μm × 10 μm × 10 μm, consistent with the approximate measured dimensions of single EC cells. A cuboid layer representing mucosal tissue, of an appropriate thickness for the GI tract region being modelled, was placed within this volume, with a submucosal layer ‘below’ and luminal layer ‘above’. 5-HT release points were randomly distributed throughout the mucosal layer at a density consistent with the experimentally determined EC cell density. 5-HT entry and movement into the submucosal and luminal regions was purely diffusional, with no release sites placed within these regions. To determine steady-state 5-HT concentrations in the mucosa of different GI regions under stimulated or non-stimulated conditions simulations with an initial 5-HT concentration of 0 m at all points were allowed to run until the average mucosal concentration of 5-HT had stabilised, using release frequencies obtained from our own experiments in EC cells.
Contraction models
To model the effects of GI contraction it was assumed that contraction of the tissue would result in a change in EC cell state from ‘unstimulated’ to ‘stimulated’, with a resultant change in 5-HT release rate, and the reverse during relaxation (Spencer et al. 2011). Therefore modelling of this process consisted of changing the 5-HT release parameters at a rate consistent with the contraction–relaxation rate described experimentally (Table 1). These simulations were initially run in the ‘relaxed’ (non-stimulated release) state until steady state had been achieved, at which point a series of contraction and relaxation events were simulated.
Table 1.
The various parameters used to create our models simulating the diffusion of 5-HT released from EC cells throughout the surrounding mucosa
| Model parameter | Value | Reference |
|---|---|---|
| EC cell vesicle release rate parameter (λ) (stimulated) | 2.007 s−1 | Current paper |
| EC cell vesicle release rate parameter (λ) (non-stimulated) | 0.5767 s−1 | Current paper |
| EC cell 5-HT release amount | 9031 molecules per release event | Current paper |
| 5-HT diffusion coefficient (D) – free fluid | 5.4 × 10⁻⁶ cm2 s−1 | (Gerhardt & Adams, 1982) |
| 5-HT diffusion coefficient (D) – effective tissue | 1.98 × 10⁻⁶ cm2 s−1 | Based on tortuosity constant of 1.65 (Rice & Nicholson, 1986; see text for further comment) |
| Volume fraction | 0.17 | (Rice & Nicholson, 1986; see text for further comment) |
| Contraction model – contraction time | 88 s | (Spencer et al. 2011) |
| SERT Km | 605 nm | (Miller et al. 2001) |
| SERT Vmax | 38 pmol min−1 (106 cells)−1 | (Miller et al. 2001) |
Model parameters
Parameters utilised for the modelling are shown in Table 1, and are all based on experimentally determined parameters from the literature or from the current paper. To account for the diffusion properties of the complex media, which is the extracellular space of the GI layers, we have included both tortuosity and volume fraction effects in our model (Sykova & Nicholson, 2008). The effective diffusion coefficient for 5-HT in tissue was calculated based on the 5-HT diffusion in CNS tissue, which found a tortuosity constant of 1.65 for 5-HT (representing an effective diffusion coefficient in tissue approximately 3× smaller than that in aqueous solution) (Rice & Nicholson, 1986). This effective tissue diffusion constant was used for the mucosal and submucosal layers of the model, whilst diffusion within the luminal layer utilised a diffusion coefficient consistent with that reported for 5-HT in aqueous solution. Within the cellular layers of the mucosa and submucosa a volume fraction of 0.17, again based on properties of 5-HT diffusion in the CNS (Rice & Nicholson, 1986), was used for calculation of the 5-HT concentration within the extracellular compartment of the tissue. All concentration values reported within the current paper refer to concentrations within this extracellular compartment, which are the relevant concentrations with regard to 5-HT uptake and receptor activation.
Models were written in the Python programming language (http://www.python.org), utilising the NumPy/SciPy libraries (Jones et al. 2001).
Model derivation
The diffusion (or heat) equation for a three-dimensional system is:
where
describes the concentration of 5-HT at position (x, y, z) at time t and D is the diffusion coefficient.
This equation can be extended to incorporate chemical source(s)/sink(s):
where  gives the concentration of chemical added to point (x, y, z) and time t.
We have solved this system numerically using an explicit finite differences model, where the approximate solution at the grid points is given by:
In brief, the domain was discretised in x, y, z and t:
 |
and the derivatives expressed in terms of finite differences (using a forward difference for  and a central difference for
  ,
,  and
and  ), such that:
and:
Likewise for  and
and  . Substituting into the diffusion equation:
 |
Solving for  then gives us:
Stability
The explicit finite difference model described above is conditionally stable, providing that:
In all models the spatial discretisation parameters  were determined as described previously, and then the time discretisation, Δt, was determined to ensure that this condition was fulfilled at all times.
SERT uptake
Uptake by the serotonin reuptake transporter (SERT) was modelled as a Michaelis–Menten process:
where Vmax is the SERT uptake rate at saturating 5-HT concentrations and Km is the Michaelis constant for the SERT.
5-HT release
5-HT release was modelled as a Poisson process:
where:
 is the number of events in the time interval
  , with rate parameter λ representing the expected number of release events per unit time.
Statistical analysis
All data are presented as means ± SEM. Error bars represent SEM. Analyses of significant differences between means were performed using two-tailed Student's t tests or the Mann–Whitney test when comparing two groups of parametric or non-parametric data sets. n indicates the number of independent cultures or animals used. In all cases, significant differences are indicated as follows: *P < 0.05, **P < 0.01, ***P < 0.001.
Results
Isolation and purification of EC cells
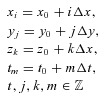
We purified EC cells from guinea-pig colon and maintained them in primary culture (Fig. 1A). Immunolabelling confirmed these cells as 5-HT-containing EC cells (Fig. 1B) with a purity of >98% (Fig. 1C). 5-HT expression in the cytoplasm is punctate (Fig. 1D) and these cells also contain Tph1 (Fig. 1E), further confirming them as EC cells. Cell viability was >98% for the first 48 h in culture (Fig. 1F).
Figure 1. Isolation and purification of primary EC cells.
Low magnification of EC cells in culture labelled with a 5-HT antibody and viewed under brightfield (A) and immunofluorescence (B). Red arrows illustrate 5-HT staining in these cells. C, cells staining positively for both 5-HT and the nuclear marker DAPI, demonstrating >98% pure EC cell culture (n= 3 cultures, ***P < 0.001). D, higher magnification of these cells using confocal microscopy observed in brightfield (top left), the nuclear stain DAPI (blue), punctuate cytoplasmic 5-HT immunoreactivity (red) and the merged image. Scale = 8 μm. E, these cells also contain the EC cell marker Tph1. Scale = 5 μm. F, viability assay demonstrates cells are healthy in culture (n= 4 cell cultures).
Stimulation of purified primary EC cells causes Ca2+ entry and 5-HT release
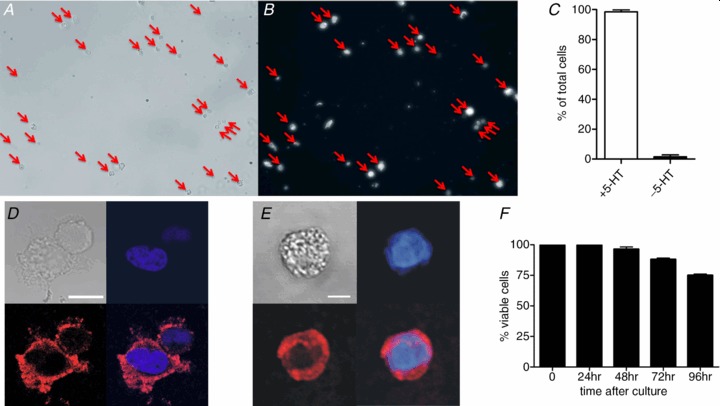
Whole-cell patch clamp demonstrated voltage-gated Ca2+ channels in EC cells (Fig. 2A) which peak at 20–30 mV (Fig. 2B). Ca2+ imaging in cells loaded with Fluo-4 demonstrated that membrane depolarisation with either 70 mm K+ or acetylcholine (10 μm) induced Ca2+ entry (Fig. 2C). Thus, EC cell stimulation causes the entry of Ca2+, the main physiological trigger of secretion. We then used carbon fibre amperometry to measure 5-HT release from single EC cells. Carbon fibre probes were held at the oxidation peak for 5-HT, +400 mV (Fig. 2E, inset), and placed adjacent to a single EC cell. Individual amperometric peaks indicative of single vesicle release of 5-HT were observed under basal and stimulatory (70 mm K+) conditions (Fig. 2D). Similar results were observed with acetylcholine (10 μm, Fig. 3D). To confirm our oxidation currents represented 5-HT release, we incubated EC cells for 24 h with an inhibitor of Tph, LP533401 (1 μm, Dalton USA), which results in almost complete suppression of 5-HT synthesis (Yadav et al. 2010). These cells (Fig. 2E) showed significantly reduced release (Fig. 2F, P < 0.001), confirming that these oxidation peaks represent single 5-HT release events from primary EC cells.
Figure 2. Stimulation of primary EC cells causes Ca2+ entry and 5-HT release.
A, Ca2+ currents elicited from −80 mV holding potential, stepped for 100 ms to −20 mV to +30 mV in 10 mV increments. B, current density–voltage relationship of these Ca2+ currents (n= 6). C, example trace of Ca2+ entry in a single cell stimulated with 70 mm K+ (dashed line, Scale = 10 s and 5 fluorescence points). Inset, average EC cell fluorescence change in response to 70 mm K+ or acetylcholine (ACh, 10 μm, n= 13 cells for both groups). D, amperometry measures 5-HT release from single EC cells. 70 mm K+ solution (dashed line) triggers 5-HT release from single vesicles as indicated by individual current spikes. E, inset, oxidation current in 5-HT (10 μm) when voltage is ramped from 0 to 0.8 V using cyclic voltammetry demonstrates +400 mV as the peak oxidation current for 5-HT. Scale bar = 100 pA. Cells treated for 24 h with the Tph inhibitor LP533401 (1 μm) have almost no 5-HT release (E) and this decrease is significant (F; ***P < 0.001, n= 9–12 cells). Scale bars in C and D represent 100 pA and 20 s.
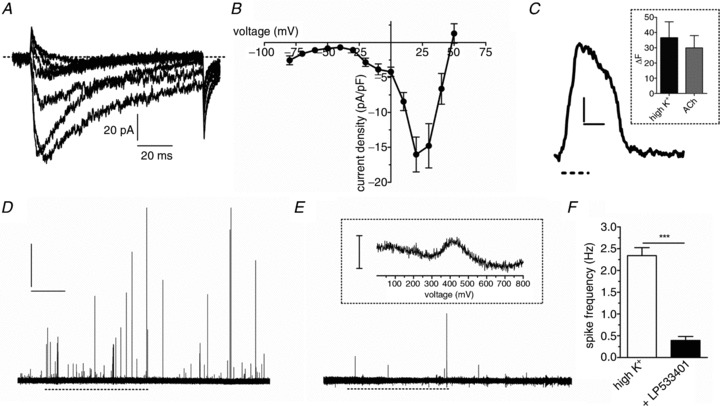
Figure 3. EC cell 5-HT release is dependent on external Ca2+ entry via voltage-gated Ca2+ channels.
K+ at 70 mm (dashed line) triggers 5-HT release in the presence of external Ca2+ (A) and in the same cell when external Ca2+ is removed (B). C, a similar effect is seen in cells exposed to the L-type Ca2+ channel antagonist nicardipine (2 μm). Scale bars in A represent 20 pA and 10 s and apply to A, B and C. D, quantification of spike frequency demonstrates that 70 mm K+ (n= 18 paired recordings, *P < 0.05) and acetylcholine (ACh, n= 16 paired recordings, **P < 0.01) increase the number of 5-HT release events and high K+-induced release is reduced in the absence of external Ca2+ (n= 6 paired recordings, **P < 0.01) or presence of nicardipine (n= 8 paired recordings, **P < 0.01).
EC cell 5-HT release is dependent on external Ca2+ entry through L-type Ca2+ channels
A reduced number of 5-HT release events were observed when EC cells were stimulated in the absence of external Ca2+ (Fig. 3A and B). Blocking L-type Ca2+ channels with nicardipine (2 μm) also reduced release event frequency (Fig. 3C). Thus, 5-HT release from EC cells is largely dependent on Ca2+ entry, with one major avenue being through L-type Ca2+ channels (Fig. 3D).
Single 5-HT release events occur with rapid kinetics in EC cells
Individual current peaks in amperometric recordings represent the release of oxidisable substances from a single vesicle (Fig. 4A). Vesicle size is a major determinant of vesicle release kinetics (Albillos et al. 1997; Zhang & Jackson, 2010) so we compared single EC cell events to those in the more commonly studied endocrine cell, the adrenal chromaffin cell, which releases catecholamines from similarly sized large dense core vesicles (LDCVs; Nilsson et al. 1987; Pothos et al. 2002). This comparison demonstrates that the amount released per exocytosis event was much smaller in EC cells (Fig. 4B). Comparisons of frequency distribution of spike width at half-maximum height (half-width, Fig. 4C), rise time (Fig. 4D) and decay time (Fig. 4E) further confirmed the lack of overlap between these groups. Unexpectedly, the amount of 5-HT released per fusion event was similar to that seen for release of dopamine from much smaller synaptic vesicles (Staal et al. 2004; Table 2).
Figure 4. EC cell 5-HT release occurs with synaptic-like release kinetics.
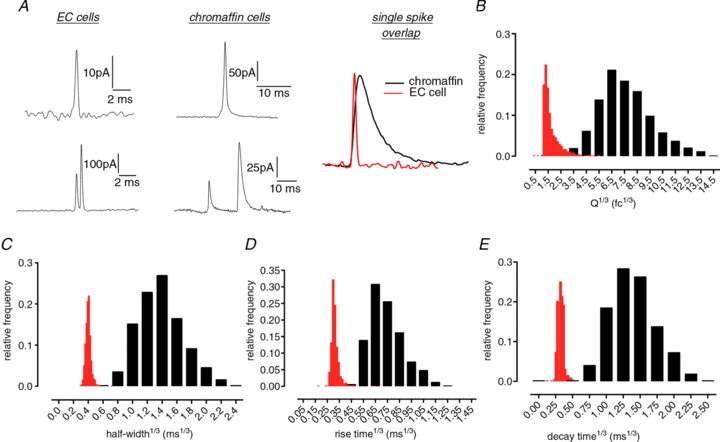
A, individual release events from EC cells are more rapid than those in adrenal chromaffin cells. An example spike from each cell type is overlaid for comparison B, a comparison of spike area distribution illustrates that the amount of EC cell 5-HT released per fusion event represents a separate population to release events from chromaffin cells. Faster release kinetics in EC cells are further illustrated by comparing the frequency distribution of spike half-width (C), rise time (D) or decay time (E) in both cell types. n= 2113 spikes from 24 EC cell recordings and 781 spikes from 16 chromaffin cell recordings. Red bars = EC cell data, black bars = chromaffin cell data.
Table 2.
Amperometric recordings reveal that EC cell release kinetics resembles that in synapses rather than in other endocrine cells
| Guinea-pig EC cells (5-HT) | Human EC cells (5-HT) | Chromaffin cells (adrenaline) | Synapses (dopamine)* | |
|---|---|---|---|---|
| Vesicle diameter (range, nm) | 100–500** | — | 100–500 | 20–50 |
| Molecules released per vesicle | 9031 ± 354 | 9642 ± 337 | ∼700,000 | ∼10,000 |
| Amplitude (pA) | 37.9 ± 1.1 | 49.1 ± 1.6 | ∼80 | ∼35 |
| Half-width (μs) | 96 ± 0.4 | 95 ± 0.4 | ∼3000 | ∼90 |
| Rise time (μs) | 27 ± 0.1 | 27± 0.1 | ∼450 | — |
Amperometric measurements of single vesicle release of 5-HT from EC cells, adrenaline from chromaffin cells and dopamine from ventral midbrain neurons. The amount of EC cell 5-HT released per vesicle is over 70 times less than catecholamine released from similarly sized vesicles in chromaffin cells (Keating et al. 2008).*Dopamine data are from Staal et al. (2004). **Vesicle diameter measurements taken from Nilsson et al. (1987), Cetin et al. (1994) and Fujimiya et al. (1997) for EC cells, Staal et al. (2004) for dopaminergic vesicles and Pothos et al. (2002) for chromaffin cells.
The 5-HT release profile in human and guinea-pig EC cells is identical
We also isolated and cultured human colonic EC cells and measured single 5-HT release events (Fig. 5A). Spike frequency in unstimulated and stimulated cells (Fig. 5B) was similar to that in guinea-pig. The relative number of release events over time was identical in human and guinea-pig EC cells, and was significantly reduced in the absence of external Ca2+ or when L-type Ca2+ channels were blocked (Fig. 5C). Single exocytosis events also occurred in human EC cells (Fig. 5D) and the distribution of spike area was strikingly similar to guinea-pig EC cells (Fig. 5E). To test whether partial release via kiss-and-run fusion might explain the synaptic-like kinetics of 5-HT release in EC cells we inhibited Tph activity for 24 h with LPS533401 (1 μm) to reduce the availability of 5-HT loading into vesicles. If EC cell vesicles release 5-HT via full fusion, this treatment would result in reduced spike charge (Colliver et al. 2000; Pothos et al. 2002; Gong et al. 2003; Sombers et al. 2004). The mean charge of release events was unaltered by this treatment (Fig. 5F), indicating that rapid kiss-and-run, rather than full fusion, may be occurring in EC cells and may explain these rapid release kinetics and low amounts of 5-HT release per fusion event.
Figure 5. Human EC cells also release 5-HT with synaptic kinetics.
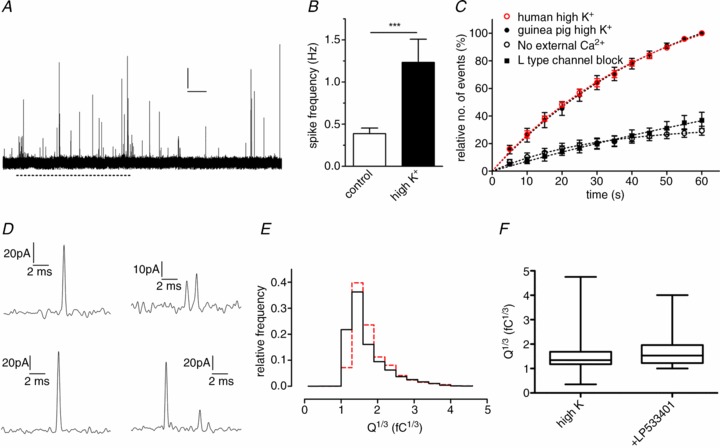
A, an amperometric recording from a human EC cell in response to 70 mm K+ (dashed line) exposure. Scale bar = 20 pA and 10 s. B, average spike frequency is significantly increased by stimulation (n= 21 cells from 4 cultures, ***P < 0.001). C, relative number of events over time is similar in human and guinea-pig EC cells stimulated by 70 mm K+ while lack of external Ca2+ or L-type Ca2+ channel block similarly reduce cumulative spike frequency. D, single amperometric spikes from human EC cells have rapid kinetics. E, the distribution of spike area (Q1/3) in human cells (n= 1542 spikes from 21 recordings, red) is the same as that in guinea-pig cells (n= 2113 spikes from 24 recordings, black). F, reducing 5-HT availability by treatment of guinea-pig EC cells with the Tph inhibitor LP533401 (1 μm) does not affect the amount of 5-HT released per vesicle.
Relevance of EC cell release kinetics for 5-HT signalling
To gauge the physiological relevance of synaptic-like release of 5-HT from EC cells within the surrounding mucosal area, we modelled the three-dimensional diffusion of 5-HT throughout the surrounding tissue in different GI tract regions. This is important to try and relate the synaptic-like amounts of 5-HT released from EC cells with the local concentrations this would create and the relevance this has to the activation threshold of 5-HT receptors present on mucosal nerve endings. We first quantified EC cell density in different gut regions. EC cells were rarely present in the oesophagus but were found at varying densities in the cardia, fundus, pylorus, ileum and colon, with the highest EC cell density in the pylorus (Fig. 6A–G). We then modelled the diffusion of 5-HT released from a single cell to demonstrate the effect of stimulation on diffusion distance (Fig. 6H). Using a more complex multi-cell simulation, we demonstrated that the steady-state 5-HT levels differ in unstimulated and stimulated conditions in different GI tract regions when moving from a starting point of no 5-HT (Fig. 6I). This can be better demonstrated, however, when viewing a three-dimensional model (Fig. 6J), or vertical (Fig. 6K) and horizontal (Fig. 6L) planes as still images or a movie (Supplemental Movie 1). Such analysis revealed regional differences in steady-state 5-HT under stimulated and unstimulated conditions (Fig. 6M). The modelling identified the probability of any space being exposed to 5-HT levels above 1 nm (Fig. 6N), which is close to the Kd for 5-HT binding to 5-HT receptors in mucosa–submucosa membrane preparations (Branchek et al. 1984) and was therefore used as the reference value in our calculations. Given that many 5-HT receptors are activated at 5-HT concentrations between 1–10 nm (Murray et al. 2011) and that 5-HT3 receptors are activated at 5-HT levels above 10 nm, we additionally calculated the probability of any space being exposed to 5-HT levels above 10 nm (Supplemental Fig. S1). Modelling the 5-HT fluctuations that occur at resting contraction rates (Spencer et al. 2011) resulted in rapid changes in 5-HT levels across the 1 nm value (Fig. 6O and Supplemental Movie 2). At higher stimulation frequencies, 5-HT levels remained above this 1 nm threshold (Fig. 6P and Supplemental Movie 3). Thus our models simulating diffusion of 5-HT from populations of EC cells in the mucosa reveal that the amount released per vesicle from EC cells may have physiological relevance. We find that local 5-HT levels depend on EC cell density and release frequency and that these 5-HT levels are very close to the activation threshold of innervating 5-HT receptors and that this threshold may be crossed during GI tract contraction or peristalsis.
Figure 6. Simulated 5-HT diffusion in the GI tract mucosal layer.
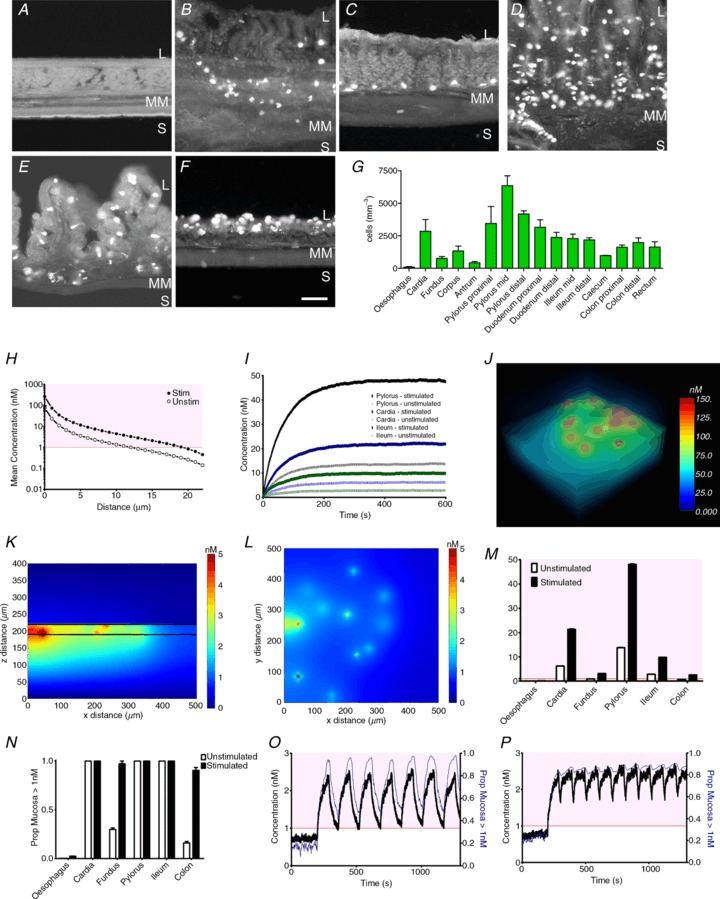
EC cells 5-HT immunoreactivity in six representative regions of the guinea-pig GI tract including the oesophagus (A), cardia (B), fundus (C), pylorus (D), ileum (E) and colon (F). L = lumen, S = serosa, MM = muscularis mucosa; Scale bar in F represents 30 μm and applies to panels A–F. G, average density of EC cells in various sections of the GI tract. H, diffusion of 5-HT after release from a single EC cell in stimulated and unstimulated conditions (n= 6 simulations). I, effect of stimulation on the evolution of steady-state 5-HT concentration (from starting point of 0 mm) in different gut regions. J, 3D image of modelled steady-state 5-HT concentrations at a single time point. K and L, mean 5-HT concentrations throughout the x–z plane (K) and x–y plane in the colon (L). M, average steady-state 5-HT concentrations in different gut regions (n= 5 simulations). N, proportion of cells in different regions exposed to an average 5-HT concentration >1 nm (n= 5 simulations). O, model of contraction-induced alterations in average 5-HT level (black) and proportion of cells exposed to >1 nm 5-HT (blue) in the colon. P, increasing contraction frequency will ultimately lead to constant average 5-HT levels >1 nm (red line) and a higher proportion of cells exposed to >1 nm 5-HT.
Discussion
This study represents the first recordings and characterisation of single primary enterochromaffin cell function in any species. Whilst EC cells constitute the most prevalent enteroendocrine cell within our largest endocrine tissue, they remain poorly understood. We demonstrate that EC cells contain voltage-gated Ca2+ channels, that Ca2+ enters EC cells upon stimulation, and that Ca2+ entry through L-type Ca2+ channels contributes significantly to 5-HT release. Most intriguingly, both guinea-pig and human EC cells release an amount of 5-HT per exocytosis event equivalent to that seen in synaptic release. The amount of 5-HT released per fusion event appears to have physiological relevance in relation to activation of 5-HT receptors within the intestinal mucosa, with modelling of this type of release revealing that different GI tract regions are likely to be exposed to quite variable 5-HT levels within the mucosa.
We have developed a method of rapidly purifying and culturing EC cells from both guinea-pig and human colonic mucosa. Previous methods for EC cell isolation have included using acridine orange staining followed by fluorescence-activated cell sorting (FACS; Kidd et al. 2006) or elutriation and density gradient centrifugation (Schafermeyer et al. 2004). Our approach was modified from that of Schafermeyer et al. (2004), as we felt that a brief enzyme digestion followed by density centrifugation is rapid and more likely to result in single cells healthy enough to allow measurements using sensitive techniques such as whole-cell patch clamp. We have therefore been able to undertake the first single-cell measurements of these important endocrine cells. Our results demonstrate that EC cells behave similarly to many other endocrine cells; they contain voltage-gated Ca2+ channels, they undergo exocytosis and release vesicle contents in a quantal manner, and this exocytosis is Ca2+ dependent. We also find that L-type Ca2+ channels predominantly contribute to 5-HT secretion induced by simple membrane depolarisation caused by increased extracellular potassium. This is similar to previous findings in isolated guinea-pig and human duodenal crypts (Lomax et al. 1999) but might not represent the majority of Ca2+ entry under all conditions. For example, the secretory response in primary human and guinea-pig EC cells may vary in response to nutrient or mechanical stimulation, changes in pH, osmolarity or bile acid. At this stage we cannot make estimates around how much 5-HT release occurs from EC cells in response to these different physiological stimulants and whether the local 5-HT concentrations throughout different areas of the GI tract are different from those modelled in this current manuscript. Future studies in our laboratory will focus on these modes of stimulation, the degree of 5-HT release they stimulate and the possible involvement of other Ca2+ channels in those responses. Given that EC cells are highly sensitive to mechanical stimulation; it is very likely that during their isolation scraping the mucosa, agitation, centrifugation and other manipulations expose them to strong mechanical stimuli. This could alter cell phenotype and function via mechano-transcriptional events, as is probably the case with most cell types studied in primary culture. However, given the 24 h period of rest between primary culture and amperometric recordings from EC cells, we can be reasonably confident that any mechanical disruptions to the cells are no longer a factor in stimulating 5-HT release.
We do, however, observe one major difference in the secretion profile of EC cells compared to other endocrine cells. Our amperometry experiments clearly demonstrate that EC cells release far less 5-HT per vesicle fusion event than that released from other cells containing similarly sized vesicles, such as adrenal chromaffin cells. This may make sense physiologically; as catecholamines released from adrenal chromaffin cells are required in large amounts throughout the circulation during the ‘flight or fight’ response while 5-HT signals locally and is eventually transported into the circulation and primarily into platelets thereafter. The key factor of interest in our observations is the possible mechanisms that underlie the release of such low amounts of neurotransmitter from large dense core vesicles (LDCVs). Vesicle size is a significant factor underlying the different release kinetics of LDCVs and synaptic vesicles (Bruns et al. 2000), with the amount released per vesicle being proportional to vesicle size (Albillos et al. 1997; Zhang & Jackson, 2010). 5-HT is stored in guinea-pig EC cell LDCVs (Nilsson et al. 1987; Cetin et al. 1994; Fujimiya et al. 1997) of similar size to chromaffin cell LDCVs (Pothos et al. 2002; Zanin et al. 2013); however, our data reveal that 70 times less 5-HT is released from EC cell vesicles than catecholamine released from chromaffin vesicles during each exocytosis event. The mechanisms underlying such a difference are unknown. Amperometric spikes recorded from chromaffin cells represent full fusion events, with transient kiss-and-run fusion measured as stand-alone foot signals in these cells. EC cell vesicles may be undergoing full fusion but such vesicles may contain comparatively small amounts of 5-HT per vesicle. This could potentially be due to differences in vesicular pH (Pothos et al. 2002) or VMAT expression to reduce 5-HT loading into EC cell vesicles. Alternatively, only the smallest LDCVs might undergo exocytosis in EC cells, although the mechanism that would govern such a pathway is unclear. Another explanation for this type of release in EC cells may be the exclusive occurrence of kiss-and-run fusion in which transient pore opening and rapid re-closure results in only partial release of 5-HT. Indeed, immunoelectron micrographs of rat duodenal EC cells stimulated by increased intraluminal pressure demonstrates LDCVs that have only partially released their contents (Fujimiya et al. 1997), possibly via kiss-and-run type fusion. This would be in line with our experiments in which inhibition of 5-HT synthesis, which should reduce 5-HT loading into individual vesicles, did not reduce quantal size as is observed in chromaffin cells when vesicle loading is inhibited (Colliver et al. 2000; Pothos et al. 2000, 2002). As this study is the first of its kind in EC cells, or indeed in any cell type derived from gastric stem cells (in contrast to the large number of studies undertaken in neural crest-derived endocrine and neuroendocrine cells), it is also worth considering that previously undescribed mechanisms may control 5-HT release from EC cells. What is clear is that this release mode is consistent between guinea-pig and human EC cells, with the same amount of 5-HT released per fusion event in both species.
To try and understand the physiological relevance of the relatively small amounts of 5-HT released per fusion event in EC cells we created mathematical models to simulate 5-HT diffusion in the mucosal layer. 5-HT released from these cells has three major targets; 5-HT receptors located on intrinsic and extrinsic nerve endings, the serotonin reuptake transporters (SERT) located on enterocytes, and SERT located on local blood vessels for transport into the circulation (Chen et al. 2001). 5-HT receptors can be saturated and desensitised by prolonged exposure to activating 5-HT concentrations. We therefore used the Kd value for 5-HT receptors located within mucosa–submucosa membrane preparations (∼1 nm; Branchek et al. 1984) as a reference point to determine the ramifications of the synaptic-like amounts of 5-HT released during EC cell fusion events. Our three-dimensional modelling of 5-HT diffusion indicates that the amounts of 5-HT released would be sufficient to activate 5-HT receptors within relevant distances of secreting EC cells. We began with a model consisting of a single releasing cell in an empty volume secreting 5-HT with the same kinetics measured in our amperometric recordings. At this single-cell level our model predicts that the average 5-HT concentration remains above 1 nm within 12 μm of the release site in non-stimulated conditions, and within 19 μm of the release site at a release frequency consistent with high K+-evoked EC cell stimulation. While the number of close contacts between EC cells and other structures is variable due to the constant migration of EC cells (O’Hara & Sharkey, 2007), nerve terminals are observed within these distances from EC cells (Wade & Westfall, 1985; Gershon & Tack, 2007). Such pathways are functional with, for example, mucosal 5-HT acting on vagal mucosal afferent fibres via 5-HT3 receptors to control sensory pathways in response to luminal stimuli such as distension and acid (Blackshaw & Grundy, 1993) and isolated guinea-pig colon is activated by 5-HT concentrations as low as 0.1 nm (Ishizawa, 1994), thus highlighting the physiological relevance of our modelling and release data.
While the binding co-efficient for 5-HT to guinea-pig gut plasma membrane is approximately 1 nm (Branchek et al. 1984), the activation thresholds of different 5-HT receptor subtypes in response to 5-HT in the GI tract remains a point of speculation. The different sub-classes of 5-HT receptors have different affinities for their biological ligand (Murray et al. 2011). Typically the dissociation constant for inhibitor binding, Ki, of 5-HT receptors obtained from high affinity radioligand bindings studies lies between 1 and 10 nm (Murray et al. 2011), except for 5-HT3 receptors, which are less sensitive to 5-HT. In the GI tract, 5-HT primarily acts on 5-HT4 and 5-HT3 receptors (Gershon & Tack, 2007). Cloned 5-HT3 receptors have a Ki of 27 nm (Green et al. 1995), while endogenous receptors appear to have a higher Ki of 72 nm in the vagus nerve (Kilpatrick et al. 1989) and 39–190 nm in the cortex (Peroutka & Hamik, 1988; Wong et al. 1989). 5-HT induces relaxation of rat oesophagus with an EC50 of ∼5 nm (Mine et al. 1997) and this effect involves 5-HT4 receptor activation. 5-HT4 receptors are present on intrinsic primary afferent neurons (Poole et al. 2006) and these receptors have a Ki of 6.3 nm (Murray et al. 2011). Our modelling therefore suggests that the amount of 5-HT being released from EC cells has physiological relevance in stimulating primary afferents in the gut. Under stimulated conditions, a single EC cell emits 5-HT at mean concentrations exceeding 10 nm for ∼5 μm from the cell and above 100 nm within 1 μm from a cell.
We then used our modelling approach to identify the relevance of the 5-HT release profile from multiple EC cells within the mucosal layer itself. To do this required knowledge of EC cell density within various regions of the GI tract. We observe varying EC cell densities throughout the gut, with the highest density within the pylorus. It is worth noting that EC cells have been described as either ‘open-type’ cells reaching the luminal surface or ‘closed-type’ cells lacking luminal contact (Kusumoto et al. 1988). As yet, however, functional differences in these morphologically distinct populations have not been demonstrated. For this reason, we felt it was not advisable for the models to include any factors that might be suggested from the anatomical differences in these cell populations. Modelling of 5-HT diffusion from multiple EC cell populations within the mucosal layer indicates, as expected, that mucosal 5-HT concentrations would vary in accordance with EC cell density and stimulation status. Consequently, 5-HT receptors in these different areas of the gut may be differentially activated under resting and stimulated conditions, possibly leading to regional differences in receptor activation and desensitisation. It is also possible that the small amount of 5-HT released from EC cells may minimise desensitisation of local 5-HT receptors. Even within those regions of the mucosa containing lower 5-HT concentrations, our single-cell models predict that physiologically relevant 5-HT levels will still be present within a short distance of EC cells, and hence be relevant to receptors located within such proximity. Additionally, our models predict the existence of ‘hotspots’ of high 5-HT concentration in discrete regions of the mucosa, whose functional significance is not yet clear. We speculate that these differences in cell density could underpin varying roles of EC cell 5-HT in different regions of the GI tract.
Interestingly, our modelling data, combined with single-cell ELISA obtained from human EC cells (Kidd et al. 2008) demonstrate a disparity in the 5-HT concentrations obtained from cultured EC cells and those obtained with amperometry in whole-tissue preparations. We predict average mucosal 5-HT concentrations in the nanomolar range, similar to ELISA measurements from normal and neoplastic human EC cells (Kidd et al. 2008). Our single-cell data are also in line with ELISA measurements of 5-HT release from whole tissue that estimates 5-HT release in the picomolar 5-HT per gram tissue range (Bertrand et al. 2010). However, measurement of 5-HT release from whole tissue, obtained with electrodes calibrated using constant-voltage amperometry in our laboratory and others (Bertrand, 2004, 2006; Bertrand et al. 2010; Keating & Spencer, 2010; Spencer et al. 2011), provide measurements of average mucosal 5-HT concentrations several orders of magnitude higher. Given that 5-HT levels in the millimolar range are expected to desensitise local receptors that are normally activated at physiological levels in the nanomolar range, such concentrations make little sense in relation to their effect on 5-HT receptor activation. There may be several explanations that contribute to such a difference in estimates of EC cell 5-HT release. Firstly, the use of constant-voltage amperometry creates an artificial diffusion gradient toward the electrode that will lead to overestimates of an unknown magnitude of the measured 5-HT concentration. Secondly, whole-tissue recordings are more prone to probe fouling and reduction in electrode sensitivity during long recordings compared to single-cell recordings. Thirdly, recordings in intact tissue measure luminal 5-HT release and maintaining EC cells in culture may cause them to lose any secretory polarity that might exist in vivo and as such affect the comparison being made between in situ vs. in vitro measurements. Additionally, in situ measurements of 5-HT release are likely to be triggered via mechanosensitive pathways in response to either gut contraction (Keating & Spencer, 2010; Spencer et al. 2011) or probing with an amperometry electrode (Bertrand, 2004, 2006; Bertrand et al. 2010). This type of stimulus may initiate far greater levels of 5-HT release than high external K+ or acetylcholine used in our study. We also cannot be sure how many EC cells are located within the vicinity of an amperometry electrode during whole-tissue amperometry experiments. As such, the use of fixed amperometry measurements of 5-HT concentrations in whole-tissue preparations may overestimate the amount of 5-HT released from EC cells.
Our rapid EC cell isolation approach can be used to compare EC cell function in normal and pathological conditions in both human samples and animal models of GI disorders. This would have benefit over whole-tissue measurements that can be confounded by indirect effects on EC cells from other surrounding cell types or by contraction of the GI tract. Single-cell studies, such as those presented here, may facilitate careful dissection of intrinsic mechanisms underlying altered 5-HT release in disorders such as colitis (Bertrand et al. 2010) and Crohn's disease (Kidd et al. 2009) and potentially provide new therapeutic avenues in such circumstances. Our approach will hopefully underpin a new wave of investigations into the precise function and role of these endocrine cells in health and disease. As EC cell-derived 5-HT has important paracrine effects within the gut as well as endocrine effects on tissues including bone, liver and lung (Karsenty & Gershon, 2011), such studies would have relevance both within the GI tract and beyond.
Acknowledgments
The authors would like to thank Melinda Kyloh and Sarah Nicholas for their technical assistance.
Glossary
Abbreviations
- EC
enterochromaffin
- GI
gastrointestinal
- 5-HT
serotonin
- IBS
irritable bowel syndrome
- IBD
inflammatory bowel disease
- LDCVs
large dense core vesicles
- SERT
serotonin reuptake transporter
Additional information
Competing interests
The authors declare no conflict of interests.
Author contributions
R.R., M.D.D. and D.J.K. conceived and designed the experiments. R.R., M.D.D., L.Z. and A.M. collected and analysed the data. T.C.S. and D.A.W. were responsible for acquiring human colonic samples. All calcium imaging experiments were performed in the laboratory of N.J.S. All authors were involved with interpretation of the data. R.R., M.D.D. and D.J.K. wrote the paper and all authors were involved in revising it. All persons designated as authors qualify for authorship, all such people are listed and all authors have approved the final version of the manuscript.
Funding
This work is supported by an Australian Research Council Future Fellowship and Discovery Grant to D.J.K. and a NHMRC Project grant (no. 10257566) to N.J.S.
Supplementary material
Supplemental Movie 1
Supplemental Movie 2
Supplemental Movie 3
Supplemental Fig. S1
References
- Albillos A, Dernick G, Horstmann H, Almers W, Alvarez de Toledo G, Lindau M. The exocytotic event in chromaffin cells revealed by patch amperometry. Nature. 1997;389:509–512. doi: 10.1038/39081. [DOI] [PubMed] [Google Scholar]
- Bertrand PP. Real-time detection of serotonin release from enterochromaffin cells of the guinea-pig ileum. Neurogastroenterol Motil. 2004;16:511–514. doi: 10.1111/j.1365-2982.2004.00572.x. [DOI] [PubMed] [Google Scholar]
- Bertrand PP. Real-time measurement of serotonin release and motility in guinea-pig ileum. J Physiol. 2006;577:689–704. doi: 10.1113/jphysiol.2006.117804. [DOI] [PMC free article] [PubMed] [Google Scholar]
- Bertrand PP, Barajas-Espinosa A, Neshat S, Bertrand RL, Lomax AE. Analysis of real-time serotonin (5-HT) availability during experimental colitis in mouse. Am J Physiol Gastrointest Liver Physiol. 2010;298:G446–G455. doi: 10.1152/ajpgi.00318.2009. [DOI] [PubMed] [Google Scholar]
- Bischoff SC, Mailer R, Pabst O, Weier G, Sedlik W, Li Z, Chen JJ, Murphy DL, Gershon MD. Role of serotonin in intestinal inflammation: knockout of serotonin reuptake transporter exacerbates 2,4,6-trinitrobenzene sulfonic acid colitis in mice. Am J Physiol Gastrointest Liver Physiol. 2009;296:G685–G695. doi: 10.1152/ajpgi.90685.2008. [DOI] [PubMed] [Google Scholar]
- Blackshaw LA, Grundy D. Effects of 5-hydroxytryptamine on discharge of vagal mucosal afferent fibres from the upper gastrointestinal tract of the ferret. J Auton Nerv Syst. 1993;45:41–50. doi: 10.1016/0165-1838(93)90360-7. [DOI] [PubMed] [Google Scholar]
- Branchek T, Kates M, Gershon MD. Enteric receptors for 5-hydroxytryptamine. Brain Res. 1984;324:107–118. doi: 10.1016/0006-8993(84)90627-9. [DOI] [PubMed] [Google Scholar]
- Braun T, Voland P, Kunz L, Prinz C, Gratzl M. Enterochromaffin cells of the human gut: sensors for spices and odorants. Gastroenterology. 2007;132:1890–1901. doi: 10.1053/j.gastro.2007.02.036. [DOI] [PubMed] [Google Scholar]
- Brown PM, Drossman DA, Wood AJ, Cline GA, Frazier KS, Jackson JI, Bronner J, Freiman J, Zambrowicz B, Sands A, Gershon MD. The tryptophan hydroxylase inhibitor LX1031 shows clinical benefit in patients with nonconstipating irritable bowel syndrome. Gastroenterology. 2011;141:507–516. doi: 10.1053/j.gastro.2011.05.005. [DOI] [PMC free article] [PubMed] [Google Scholar]
- Bruns D, Riedel D, Klingauf J, Jahn R. Quantal release of serotonin. Neuron. 2000;28:205–220. doi: 10.1016/s0896-6273(00)00097-0. [DOI] [PubMed] [Google Scholar]
- Cetin Y, Kuhn M, Kulaksiz H, Adermann K, Bargsten G, Grube D, Forssmann WG. Enterochromaffin cells of the digestive system: cellular source of guanylin, a guanylate cyclase-activating peptide. Proc Natl Acad Sci U S A. 1994;91:2935–2939. doi: 10.1073/pnas.91.8.2935. [DOI] [PMC free article] [PubMed] [Google Scholar]
- Chen JJ, Li Z, Pan H, Murphy DL, Tamir H, Koepsell H, Gershon MD. Maintenance of serotonin in the intestinal mucosa and ganglia of mice that lack the high-affinity serotonin transporter: Abnormal intestinal motility and the expression of cation transporters. J Neurosci. 2001;21:6348–6361. doi: 10.1523/JNEUROSCI.21-16-06348.2001. [DOI] [PMC free article] [PubMed] [Google Scholar]
- Coggeshall RE, Lekan HA. Methods for determining numbers of cells and synapses: a case for more uniform standards of review. J Comp Neurol. 1996;364:6–15. doi: 10.1002/(SICI)1096-9861(19960101)364:1<6::AID-CNE2>3.0.CO;2-9. [DOI] [PubMed] [Google Scholar]
- Colliver TL, Hess EJ, Ewing AG. Amperometric analysis of exocytosis at chromaffin cells from genetically distinct mice. J Neurosci Methods. 2001;105:95–103. doi: 10.1016/s0165-0270(00)00359-9. [DOI] [PubMed] [Google Scholar]
- Colliver TL, Pyott SJ, Achalabun M, Ewing AG. VMAT-mediated changes in quantal size and vesicular volume. J Neurosci. 2000;20:5276–5282. doi: 10.1523/JNEUROSCI.20-14-05276.2000. [DOI] [PMC free article] [PubMed] [Google Scholar]
- Cote F, Fligny C, Bayard E, Launay JM, Gershon MD, Mallet J, Vodjdani G. Maternal serotonin is crucial for murine embryonic development. Proc Natl Acad Sci U S A. 2007;104:329–334. doi: 10.1073/pnas.0606722104. [DOI] [PMC free article] [PubMed] [Google Scholar]
- Fujimiya M, Okumiya K, Kuwahara A. Immunoelectron microscopic study of the luminal release of serotonin from rat enterochromaffin cells induced by high intraluminal pressure. Histochem Cell Biol. 1997;108:105–113. doi: 10.1007/s004180050151. [DOI] [PubMed] [Google Scholar]
- Gerhardt G, Adams RN. Determination of diffusion coefficients by flow injection analysis. Analytical Chemistry. 1982;54:2618–2620. [Google Scholar]
- Gershon MD, Tack J. The serotonin signalling system: from basic understanding to drug development for functional GI disorders. Gastroenterology. 2007;132:397–414. doi: 10.1053/j.gastro.2006.11.002. [DOI] [PubMed] [Google Scholar]
- Ghia JE, Li N, Wang H, Collins M, Deng Y, El-Sharkawy RT, Cote F, Mallet J, Khan WI. Serotonin has a key role in pathogenesis of experimental colitis. Gastroenterology. 2009;137:1649–1660. doi: 10.1053/j.gastro.2009.08.041. [DOI] [PubMed] [Google Scholar]
- Gong LW, Hafez I, Alvarez de Toledo G, Lindau M. Secretory vesicles membrane area is regulated in tandem with quantal size in chromaffin cells. J Neurosci. 2003;23:7917–7921. doi: 10.1523/JNEUROSCI.23-21-07917.2003. [DOI] [PMC free article] [PubMed] [Google Scholar]
- Green T, Stauffer KA, Lummis SC. Expression of recombinant homo-oligomeric 5-hydroxytryptamine3 receptors provides new insights into their maturation and structure. J Biol Chem. 1995;270:6056–6061. doi: 10.1074/jbc.270.11.6056. [DOI] [PubMed] [Google Scholar]
- Haub S, Ritze Y, Bergheim I, Pabst O, Gershon MD, Bischoff SC. Enhancement of intestinal inflammation in mice lacking interleukin 10 by deletion of the serotonin reuptake transporter. Neurogastroenterol Motil. 2010;22:826–834. doi: 10.1111/j.1365-2982.2010.01479.x. e229. [DOI] [PMC free article] [PubMed] [Google Scholar]
- Ishizawa M. Contractile responses of longitudinal muscle strip to 5-HT and influences of divalent cations in the guinea-pig isolated colon. J Smooth Muscle Res. 1994;30:65–72. doi: 10.1540/jsmr.30.65. [DOI] [PubMed] [Google Scholar]
- Jones E, Oliphant T, Peterson P. 2001. & others. SciPy: Open Source Scientific Tools for Python.
- Karsenty G, Gershon MD. The importance of the gastrointestinal tract in the control of bone mass accrual. Gastroenterology. 2011;141:439–442. doi: 10.1053/j.gastro.2011.06.011. [DOI] [PMC free article] [PubMed] [Google Scholar]
- Keating DJ, Dubach D, Zanin MP, Yu Y, Martin K, Zhao YF, Chen C, Porta S, Arbones ML, Mittaz L, Pritchard MA. DSCR1/RCAN1 regulates vesicle exocytosis and fusion pore kinetics: implications for Down syndrome and Alzheimer's disease. Hum Mol Genet. 2008;17:1020–1030. doi: 10.1093/hmg/ddm374. [DOI] [PubMed] [Google Scholar]
- Keating DJ, Spencer NJ. Release of 5-hydroxytryptamine from the mucosa is not required for the generation or propagation of colonic migrating motor complexes. Gastroenterology. 2010;138:659–670. doi: 10.1053/j.gastro.2009.09.020. [DOI] [PubMed] [Google Scholar]
- Kidd M, Eick GN, Modlin IM, Pfragner R, Champaneria MC, Murren J. Further delineation of the continuous human neoplastic enterochromaffin cell line, KRJ-I, and the inhibitory effects of lanreotide and rapamycin. J Mol Endocrinol. 2007;38:181–192. doi: 10.1677/jme.1.02037. [DOI] [PubMed] [Google Scholar]
- Kidd M, Gustafsson BI, Drozdov I, Modlin IM. IL1beta- and LPS-induced serotonin secretion is increased in EC cells derived from Crohn's disease. Neurogastroenterol Motil. 2009;21:439–450. doi: 10.1111/j.1365-2982.2008.01210.x. [DOI] [PMC free article] [PubMed] [Google Scholar]
- Kidd M, Modlin IM, Eick GN, Champaneria MC. Isolation, functional characterization, and transcriptome of Mastomys ileal enterochromaffin cells. Am J Physiol Gastrointest Liver Physiol. 2006;291:G778–G791. doi: 10.1152/ajpgi.00552.2005. [DOI] [PubMed] [Google Scholar]
- Kidd M, Modlin IM, Gustafsson BI, Drozdov I, Hauso O, Pfragner R. Luminal regulation of normal and neoplastic human EC cell serotonin release is mediated by bile salts, amines, tastants, and olfactants. Am J Physiol Gastrointest Liver Physiol. 2008;295:G260–G272. doi: 10.1152/ajpgi.00056.2008. [DOI] [PubMed] [Google Scholar]
- Kilpatrick GJ, Jones BJ, Tyers MB. Binding of the 5-HT3 ligand, [3H]GR65630, to rat area postrema, vagus nerve and the brains of several species. Eur J Pharmacol. 1989;159:157–164. doi: 10.1016/0014-2999(89)90700-0. [DOI] [PubMed] [Google Scholar]
- Kim H, Toyofuku Y, Lynn FC, Chak E, Uchida T, Mizukami H, Fujitani Y, Kawamori R, Miyatsuka T, Kosaka Y, Yang K, Honig G, van der Hart M, Kishimoto N, Wang J, Yagihashi S, Tecott LH, Watada H, German MS. Serotonin regulates pancreatic beta cell mass during pregnancy. Nat Med. 2010;16:804–808. doi: 10.1038/nm.2173. [DOI] [PMC free article] [PubMed] [Google Scholar]
- Kim M, Cooke HJ, Javed NH, Carey HV, Christofi F, Raybould HE. D-Glucose releases 5-hydroxytryptamine from human BON cells as a model of enterochromaffin cells. Gastroenterology. 2001;121:1400–1406. doi: 10.1053/gast.2001.29567. [DOI] [PubMed] [Google Scholar]
- Kusumoto Y, Grube D, Sato AG, Kaneda K, Nakamae E. Cytology and arrangement of enterochromaffin (EC) cells in the human stomach. Arch Histol Cytol. 1988;51:271–276. doi: 10.1679/aohc.51.271. [DOI] [PubMed] [Google Scholar]
- Lee J, Cummings BP, Martin E, Sharp JW, Graham JL, Stanhope KL, Havel PJ, Raybould HE. Glucose-sensing by gut endocrine cells and activation of the vagal afferent pathway is impaired in a rodent model of type 2 diabetes mellitus. Am J Physiol Regul Integr Comp Physiol. 2011;302:657–666. doi: 10.1152/ajpregu.00345.2011. [DOI] [PMC free article] [PubMed] [Google Scholar]
- Lomax RB, Gallego S, Novalbos J, Garcia AG, Warhurst G. L-Type calcium channels in enterochromaffin cells from guinea pig and human duodenal crypts: an in situ study. Gastroenterology. 1999;117:1363–1369. doi: 10.1016/s0016-5085(99)70286-6. [DOI] [PubMed] [Google Scholar]
- Miller GM, Yatin SM, De La Garza R, 2nd, Goulet M, Madras BK. Cloning of dopamine, norepinephrine and serotonin transporters from monkey brain: relevance to cocaine sensitivity. Brain Res Mol Brain Res. 2001;87:124–143. doi: 10.1016/s0169-328x(00)00288-6. [DOI] [PubMed] [Google Scholar]
- Mine Y, Yoshikawa T, Oku S, Nagai R, Yoshida N, Hosoki K. Comparison of effect of mosapride citrate and existing 5-HT4 receptor agonists on gastrointestinal motility in vivo and in vitro. J Pharmacol Exp Ther. 1997;283:1000–1008. [PubMed] [Google Scholar]
- Murray KC, Stephens MJ, Ballou EW, Heckman CJ, Bennett DJ. Motoneuron excitability and muscle spasms are regulated by 5-HT2B and 5-HT2C receptor activity. J Neurophysiol. 2011;105:731–748. doi: 10.1152/jn.00774.2010. [DOI] [PMC free article] [PubMed] [Google Scholar]
- Nilsson O, Dahlstrom A, Geffard M, Ahlman H, Ericson LE. An improved immunocytochemical method for subcellular localization of serotonin in rat enterochromaffin cells. J Histochem Cytochem. 1987;35:319–326. doi: 10.1177/35.3.3819375. [DOI] [PubMed] [Google Scholar]
- Nozawa K, Kawabata-Shoda E, Doihara H, Kojima R, Okada H, Mochizuki S, Sano Y, Inamura K, Matsushime H, Koizumi T, Yokoyama T, Ito H. TRPA1 regulates gastrointestinal motility through serotonin release from enterochromaffin cells. Proc Natl Acad Sci U S A. 2009;106:3408–3413. doi: 10.1073/pnas.0805323106. [DOI] [PMC free article] [PubMed] [Google Scholar]
- O’Hara JR, Sharkey KA. Proliferative capacity of enterochromaffin cells in guinea-pigs with experimental ileitis. Cell Tissue Res. 2007;329:433–441. doi: 10.1007/s00441-007-0430-6. [DOI] [PubMed] [Google Scholar]
- Peroutka SJ, Hamik A. [3H]Quipazine labels 5-HT3 recognition sites in rat cortical membranes. Eur J Pharmacol. 1988;148:297–299. doi: 10.1016/0014-2999(88)90579-1. [DOI] [PubMed] [Google Scholar]
- Poole DP, Xu B, Koh SL, Hunne B, Coupar IM, Irving HR, Shinjo K, Furness JB. Identification of neurons that express 5-hydroxytryptamine4 receptors in intestine. Cell Tissue Res. 2006;325:413–422. doi: 10.1007/s00441-006-0181-9. [DOI] [PubMed] [Google Scholar]
- Pothos EN, Larsen KE, Krantz DE, Liu Y, Haycock JW, Setlik W, Gershon MD, Edwards RH, Sulzer D. Synaptic vesicle transporter expression regulates vesicle phenotype and quantal size. J Neurosci. 2000;20:7297–7306. doi: 10.1523/JNEUROSCI.20-19-07297.2000. [DOI] [PMC free article] [PubMed] [Google Scholar]
- Pothos EN, Mosharov E, Liu KP, Setlik W, Haburcak M, Baldini G, Gershon MD, Tamir H, Sulzer D. Stimulation-dependent regulation of the pH, volume and quantal size of bovine and rodent secretory vesicles. J Physiol. 2002;542:453–476. doi: 10.1113/jphysiol.2002.018630. [DOI] [PMC free article] [PubMed] [Google Scholar]
- Rice ME, Nicholson C. Serotonin migration in the neuronal microenvironment. Ann N Y Acad Sci. 1986;481:381–382. doi: 10.1111/j.1749-6632.1986.tb27139.x. [DOI] [PubMed] [Google Scholar]
- Schafermeyer A, Gratzl M, Rad R, Dossumbekova A, Sachs G, Prinz C. Isolation and receptor profiling of ileal enterochromaffin cells. Acta Physiol Scand. 2004;182:53–62. doi: 10.1111/j.1365-201X.2004.01299.x. [DOI] [PubMed] [Google Scholar]
- Sombers LA, Hanchar HJ, Colliver TL, Wittenberg N, Cans A, Arbault S, Amatore C, Ewing AG. The effects of vesicular volume on secretion through the fusion pore in exocytotic release from PC12 cells. J Neurosci. 2004;24:303–309. doi: 10.1523/JNEUROSCI.1119-03.2004. [DOI] [PMC free article] [PubMed] [Google Scholar]
- Spencer NJ, Nicholas SJ, Robinson L, Kyloh M, Flack N, Brookes SJ, Zagorodnyuk VP, Keating DJ. Mechanisms underlying distension-evoked peristalsis in guinea pig distal colon: is there a role for enterochromaffin cells. Am J Physiol Gastrointest Liver Physiol. 2011;301:G519–G527. doi: 10.1152/ajpgi.00101.2011. [DOI] [PubMed] [Google Scholar]
- Staal RG, Mosharov EV, Sulzer D. Dopamine neurons release transmitter via a flickering fusion pore. Nat Neurosci. 2004;7:341–346. doi: 10.1038/nn1205. [DOI] [PubMed] [Google Scholar]
- Sumara G, Sumara O, Kim JK, Karsenty G. Gut-derived serotonin is a multifunctional determinant to fasting adaptation. Cell Metab. 2012;16:588–600. doi: 10.1016/j.cmet.2012.09.014. [DOI] [PMC free article] [PubMed] [Google Scholar]
- Sykova E, Nicholson C. Diffusion in brain extracellular space. Physiol Rev. 2008;88:1277–1340. doi: 10.1152/physrev.00027.2007. [DOI] [PMC free article] [PubMed] [Google Scholar]
- Wade PR, Westfall JA. Ultrastructure of enterochromaffin cells and associated neural and vascular elements in the mouse duodenum. Cell Tissue Res. 1985;241:557–563. doi: 10.1007/BF00214576. [DOI] [PubMed] [Google Scholar]
- Wong DT, Robertson DW, Reid LR. Specific [3H]LY278584 binding to 5-HT3 recognition sites in rat cerebral cortex. Eur J Pharmacol. 1989;166:107–110. doi: 10.1016/0014-2999(89)90689-4. [DOI] [PubMed] [Google Scholar]
- Yadav VK, Balaji S, Suresh PS, Liu XS, Lu X, Li Z, Guo XE, Mann JJ, Balapure AK, Gershon MD, Medhamurthy R, Vidal M, Karsenty G, Ducy P. Pharmacological inhibition of gut-derived serotonin synthesis is a potential bone anabolic treatment for osteoporosis. Nat Med. 2010;16:308–312. doi: 10.1038/nm.2098. [DOI] [PMC free article] [PubMed] [Google Scholar]
- Zanin MP, Mackenzie KD, Peiris H, Pritchard MA, Keating DJ. RCAN1 regulates vesicle recycling and quantal release kinetics via effects on calcineurin activity. J Neurochem. 2013;124:290–299. doi: 10.1111/jnc.12086. [DOI] [PubMed] [Google Scholar]
- Zanin MP, Phillips L, Mackenzie KD, Keating DJ. Aging differentially affects multiple aspects of vesicle fusion kinetics. PLoS One. 2011;6:e27820. doi: 10.1371/journal.pone.0027820. [DOI] [PMC free article] [PubMed] [Google Scholar]
- Zhang Z, Jackson MB. Membrane bending energy and fusion pore kinetics in Ca2+-triggered exocytosis. Biophys J. 2010;98:2524–2534. doi: 10.1016/j.bpj.2010.02.043. [DOI] [PMC free article] [PubMed] [Google Scholar]
Associated Data
This section collects any data citations, data availability statements, or supplementary materials included in this article.