

Abstract
The role of OPA1, a GTPase dynamin protein mainly involved in the fusion of inner mitochondrial membranes, has been studied in many cell types, but only a few studies have been conducted on adult differentiated tissues such as cardiac or skeletal muscle cells. Yet OPA1 is highly expressed in these cells, and could play different roles, especially in response to an environmental stress like exercise. Endurance exercise increases energy demand in skeletal muscle and repeated activity induces mitochondrial biogenesis and activation of fusion–fission cycles for the synthesis of new mitochondria. But currently no study has clearly shown a link between mitochondrial dynamics and biogenesis. Using a mouse model of haploinsufficiency for the Opa1 gene (Opa1+/−), we therefore studied the impact of OPA1 deficiency on the adaptation ability of fast skeletal muscles to endurance exercise training. Our results show that, surprisingly, Opa1+/− mice were able to perform the same physical activity as control mice. However, the adaptation strategies of both strains after training differed: while in control mice mitochondrial biogenesis was increased as expected, in Opa1+/− mice this process was blunted. Instead, training in Opa1+/− mice led to an increase in endurance capacity, and a specific adaptive response involving a metabolic remodelling towards enhanced fatty acid utilization. In conclusion, OPA1 appears necessary for the normal adaptive response and mitochondrial biogenesis of skeletal muscle to training. This work opens new perspectives on the role of mitochondrial dynamics in skeletal muscle cells and during adaptation to stress.
Key points
OPA1 is a mitochondrial protein well known to play a fundamental role in the fusion of the inner membrane, in the organization of mitochondrial cristae and in apoptosis.
Although the function of mitochondrial dynamics is becoming well understood, its impact on mitochondrial biogenesis is poorly studied, especially in differentiated adult tissues.
Here we report a novel finding that in fast skeletal muscles OPA1 deletion impairs training-induced mitochondrial biogenesis.
However, our data reveal that Opa1+/− skeletal muscles after training possess better exercise endurance capacity, obviously due to a modification of mitochondrial fatty acid utilization.
Thus OPA1 deficiency induces a unique pattern of adaptation to endurance training in fast skeletal muscles.
Introduction
In eukaryotic cells, mitochondria are involved in many essential cellular processes. Changes in their viability and function are the cause of severe multi-syndromic diseases. To fulfil their different roles, mitochondria possess dynamic capabilities, fundamental for their biogenesis. Fusion and fission are crucial processes involved in mitochondrial dynamics. The fusion machinery is composed of three large GTPases, the mitofusins (MFN1, MFN2) and the dynamin-related protein OPA1, while fission depends on the GTPase proteins DRP1 and FIS1. Disruption of the mitochondrial balance of fusion–fission, such as a defect in fusion, leads to developmental neurodegenerative diseases in humans (Olichon et al. 2006; Chan, 2006). Opa1 gene mutations have been identified as causing autosomal dominant optic atrophy (ADOA) and are associated with a variety of clinical phenotypes (myopathy, encephalopathy, deafness, etc.) and with mechanisms involving mitochondrial DNA (mtDNA) maintenance disorders (Hudson et al. 2008; Amati-Bonneau et al. 2008, Yu-Wai-Man et al. 2010a).
OPA1 is found in the intermembrane space, on the inner mitochondrial membrane facing the intermembrane space and in the cristae (Olichon et al. 2002). It may exist as diverse splice and proteolytic variants (Olichon et al. 2002; Suen et al. 2008). OPA1 primary function is the fusion of the inner mitochondrial membranes, but it is also involved in additional functions, such as protection against apoptosis through mitochondrial cristae remodelling, control of mtDNA stability and maintenance of mitochondrial respiratory function (Olichon et al. 2002; Chen & Chan, 2005; Frezza et al. 2006; Elachouri et al. 2011; Agier et al. 2012). OPA1 deletion in mice is lethal, thus showing the importance of these processes during development.
Understanding of OPA1 function is complicated by the fact that studies on gain and loss of function have led to conflicting results. Mitochondrial fragmentation or elongation has been observed depending on the experimental system (Olichon et al. 2003, 2007; Chen et al. 2005; Piquereau et al. 2012; Agier et al. 2012). Interestingly, OPA1 deficiency does not abolish outer membrane fusion but does lead to the possible accumulation of multi-matrix structures reflecting fusion of the outer membrane without that of the inner mitochondrial membrane, as shown in both the ex vivo (Song et al. 2009) and in vivo (Piquereau et al. 2012) setting.
Using a mouse model of haploinsufficiency for the Opa1 gene, obtained by a deletion of 27 AA in the GTPase domain (Alavi et al. 2007, 2009), we previously showed that cardiac mitochondria of Opa1+/− mice have altered mitochondrial structure, decreased sensitivity to calcium but normal respiratory function (Piquereau et al. 2012). The hearts of Opa1+/− mice have normal cardiac function at baseline but develop more serious cardiac hypertrophy and earlier ventricular dysfunction following pressure overload (Piquereau et al. 2012). One possible explanation is that the defect in cardiac adaptation could be linked to the abnormal or retarded formation of new mitochondria during adaptive cardiac hypertrophy, due to the involvement of OPA1 in mitochondrial biogenesis.
Mitochondrial biogenesis is a complex process that is defined as the growth and division of pre-existing mitochondria. Correct mitochondrial biogenesis relies on the spatiotemporally coordinated synthesis and import of more than 1000 proteins encoded by the nuclear genome, some of which are assembled with proteins encoded by the mitochondrial DNA within newly synthesized phospholipid membranes of the inner and outer mitochondrial membranes, and finally fission of newly formed mitochondria. All these processes have to be tightly regulated in order to meet the tissue requirements (Ventura-Clapier et al. 2008).
To explore in more detail the role of OPA1 in mitochondrial biogenesis, we studied the skeletal muscle adaptations of Opa1+/− mice to endurance exercise training. It is well known that under such physiological stress, mitochondrial biogenesis is activated to fulfil the new energetic status of these muscles (Adhihetty et al. 2003). We thus hypothesized that OPA1 deficiency may alter the adaptation to exercise endurance training. The results show that Opa1+/− mice have the same exercise and training capacity as control mice. After training, Opa1+/− mice exhibited altered mitochondrial ultrastructure and biogenesis. Surprisingly, endurance capacity was increased in Opa1+/− trained mice. This correlated with a higher capacity to utilize fatty acid, suggesting a unique adaptive strategy to training.
Methods
Animals
The heterozygous Opa1329−355del strain (abbreviated Opa1+/−) has been initially described in (Alavi et al. 2007). Mice were housed in an environmentally controlled laboratory with a 12 h–12 h light–dark cycle with food and water ad libitum. Investigations were done in accordance with European Community legislation relating to the care and use of animals (Directive 2010/63/EU), and the corresponding French legislation (French decree no. 92–284, June 27, 2007). Experiments were conduced on 6- to 8-month-old male mice. At the end of the experimental period, animals were killed by cervical dislocation. Cardiac, soleus, plantaris, and the white superficial part of gastrocnemius muscles were isolated, washed in ice-cold calcium free Krebs buffer, weighed and rapidly frozen and kept at −80°C, or immediately used to assess mitochondrial function.
Behaviour testing
Tests were conducted on 6-month-old Opa1+/+ (n= 12) and Opa1+/− (n= 12) male mice. All animals were exposed to a series of behavioural tests designed to assess a range of anxiety-, depression-, stress-related behaviours and agility capabilities. The tests were administered in the following order: open field, elevated plus maze, tail suspension test and rotarod test with a minimum of 3 days between each test. All behavioural testing took place between 10.00 h and 14.00 h. To eliminate odour cues, all testing equipment was thoroughly cleaned after each animal with benzalkonium chloride diluted 100-fold.
The open field protocol
This test has been developed to measure differences in ambulatory activity as a measure of rat emotional reactivity. In addition to information on motor activity, this test can predict anxiolytic activity due to the protocol ‘approach-avoidance’ created. This test was performed as described previously (Dulawa et al. 2004). Motor activity was quantified in four Plexiglas open field boxes measuring 43 × 43 cm2 and having a white background (MED Associates, Georgia, VT, USA). Two sets of 16 pulse-modulated infrared photo beams were placed on opposite walls 2.5 cm apart to record x–y ambulatory movements of mice. The test was performed in the dark over a 30 min session; first of all mice were acclimatized to dark for 15 min, then placed in a corner of the boxes. Activity chambers were linked to a computer for data sampling at 100 ms resolution. Computer-defined grid lines divided each open field into centre and surrounding regions, with each of four lines being 11 cm from each wall. Dependent measures were the number of entries into the various regions of the boxes, the distance travelled in the centre, total time spent in the centre, and distance travelled in the centre divided by total distance travelled. Overall motor activity was quantified as the total distance travelled (cm).
The elevated plus maze test
Anxiety behaviour was measured by the degree of avoidance of the labyrinth's open spaces. The elevated plus maze was performed as previously described (Ramboz et al. 1998; Lira et al. 2003). The elevated plus maze consisted of a plus-shaped apparatus with two open and two closed arms (30 × 6 cm); each with an open roof, elevated about 50 cm from the floor. Testing took place in bright ambient light conditions (800–900 lux). Mice were placed into the central area facing one closed arm and allowed to explore the maze for 5 min. They were recorded by a video camera positioned above the maze and scored by videotracking (Anymaze software, Bioseb, Vitrolles, France). Parameters recorded were: time spent in different parts of the maze and the number of entries in these areas. The total number of entries in all the labyrinth areas was an index of animal locomotion.
The tail suspension test
The tail suspension test is a mouse behavioural test useful in the screening of potential antidepressant drugs, and in assessing of other manipulation that are expected to affect depression related behaviours. The test was performed as previously described (Mayorga et al. 2001; David et al. 2009). A device was used consisting of six boxes of suspension (Bioseb, Vitrolles, France), which was connected to a computer to quantify the duration of immobility and energy values during agitation. The duration of immobility provides an indicator of the level of resignation. The tails of suspended mice were taped to a hook connected to a vibration sensor; recording duration was 6 min.
The rotarod test
Mouse motor coordination and balance was recorded as previously described (Stemmelin et al. 2008; Minasyan et al. 2009). The rotarod was composed of a plastic rod 3.2 cm in diameter, 50 cm long, elevated 22.5 cm from the floor, and divided into five compartments, that allows simultaneous testing of five mice. The surface of the rod was lightly roughened to minimize missteps (hind leg slips). Mice were placed on the rod for 3 min at slow rotational speed (4 r.p.m.). Rotational speed gradually accelerated up to 40 r.p.m. If the mouse fell, it got back to its positions on the rod as many times as necessary until the end of the test. The latency to fall from the bar (in seconds) was measured manually and used as an indicator of motor coordination, and the number of falls as an indicator of their balance. Mice were scored by a highly trained observer blind to the genotype of the mice.
Voluntary wheel running
For voluntary activity, Opa1+/+ (n= 21) and Opa1+/− (n= 20) animals were housed in individual plexiglas cages (Bionox, Ancy, France) equipped with running wheel and free access to food and water (Momken et al. 2004, 2005). The running-wheel system consisted of a 31.8 cm diameter wheel with a 5 cm wide running surface, connected to a direct current (DC) generator allowing slight loading of the wheel (25 × 10−3 N m) at mean maximal speed, with a continuous recording of the output voltage of the DC generator made using a computer for a period of 8 weeks. Instantaneous speed, calculated from the voltage and the resistive load on the DC generator, enabled calculation of the daily running distance. All daily parameters were averaged over each week for each animal.
Forced treadmill activity
Prior to the experiments, all mice were acclimatized to the rodent treadmill and running exercise by 12 min activity in the treadmill apparatus (Habouzit et al. 2009), 4 days before the day of the experiment (D–4; running for 2 min at 10 m min−1, 4 min at 13 m min−1, 2 min at 15 m min−1, 2 min at 16.5 m min−1 and 2 min at 18 m min−1 at a 4% slope), and 3 days before the day of the experiment (D–3; running for 2 min at 13 m min−1, 2 min at 16 m min−1, 2 min at 18 m min−1, 4 min at 20 m min−1 and 2 min at 22 m min−1 at a 4% slope). Compressed air, triggered by a photocell at the end of each lane, was used, if necessary, to maintain the running motivation during acclimatization and experiments.
On the day of the experiment (D+0), to measure the maximal aerobic running performance, all animals were briefly warmed up by running 10 m min−1 for 6 min. Then animals were exercised until they were no longer able to maintain the increasing speed of the treadmill. Treadmill speed was increased by 3.3 m min−1 every 1.5 min to reach 30 m min−1 at a 4% slope, and then treadmill speed was increased by 3.3 m min−1 every min at a 4% slope. This allowed the maximal aerobic speed (MAS) to be determined for each animal.
Exercised animals were rested for 48 h before the second experiment (i.e. on D+2) involving exhaustive running exercise. To measure the maximal endurance performance, each animal was briefly warmed up by running 10 m min−1 for 6 min at a 4% slope. Then, treadmill speed was slowly increased during a period of 6 min until it reached 60% of MAS for a 4% slope for each animal. After warming up, animals were exercised at 60% of their MAS until exhaustion. Sedentary Opa1+/+ (n= 16), Opa1+/− (n= 15), and trained Opa1+/+ (n= 9) and Opa1+/− (n= 7) mice were used.
Enzyme assay
Complete enzyme extractions from small pieces of frozen tissues were done in an ice-cold buffer (50 mg ml−1; containing (in mm): Hepes 5 (pH 8.7), EGTA 1, DTT 1, and 0.1% Triton X-100) using a Bertin Precellys 24 homogenizer (Bertin, Montigny-le-Bretonneux, France). Protein concentration was assessed using the bicinchoninic acid assay. Total activities of cytochrome oxidase (COX, citrate synthase (CS), creatine kinase (CK), adenylate kinase (AK), β-hydroxyacyl-CoA dehydrogenase (HADHA) and LDH were assayed (30°C, pH 7.5) using standard spectrophotometric assays. Activities were given as μmol min−1 (g protein)−1 (μmol min−1, international units, IU). CK isoenzymes were separated using agarose (1%) gel electrophoresis performed at 250 V for 90 min. Individual isoenzymes were resolved by incubation of the gels with a coupled enzyme system (Momken et al. 2005).
Western blot experiments
Protein extracts (50 μg) from white gastrocnemius muscle of 8-month-old Opa1+/+ and Opa1+/− mice were loaded on 10% sodium dodecyl sulfate polyacrylamide gels, separated for 120 min at 150 V and subsequently transferred to Hybond nitrocellulose membranes (Amersham) using a Bio-Rad blot system for 90 min at 150 V. Thereafter, blots were blocked for 60 min in 5% milk in phosphate buffered saline and Tween at room temperature, followed by incubation with different primary antibodies (OPA1: BD Biosciences, San Jose, California, USA 612606, CS: Abcam, Cambridge, MA, USA 96600, GAPDH: Cell Signaling, Danvers, MA, USA 2118, Oxphos Complexes: MitoSciences, Eugene, Oregon, USA 604, CPT1, Santa Cruz, Dallas, Texas, USA 139482, CPT2: personal gift from Carina Pripp-Buus, Institut Cochin, Paris) overnight at 4°C. After washing, the membranes were incubated with the appropriate secondary antibodies for 60 min at room temperature and revealed using a chemiluminescent substrate (Immobilion Western HRP, Millipore). Light emission was recorded using a chemiluminescent detection system (ChemiDoc XRS; Bio-Rad) and quantified by image-analysis software (Quantity One Bio-Rad). Protein content was normalized to GAPDH or β-actin (markers of cytoplasm) or to CS (a marker of mitochondria).
Mitochondrial (mtDNA) and nuclear (nDNA) DNA content
Total DNA was extracted from white gastrocnemius. Briefly, muscles were minced in 500 μl of buffer 1 (TrisHCl 10 mm, NaCl 10 mm, EDTA 25 mm, SDS 1%, proteinase K 0.4 mg ml−1, pH 7.5) with cleaned scissors and incubated overnight at 37°C. After addition of 50 μl of saturated NaCl solution, the homogenates were centrifuged at 500 g for 15 min. Isopropanol (50 μl) was added to supernatants which were then incubated for 45 min at −20°C. After a centrifugation at 16000 g for 20 min, the pellets were kept, washed with ethanol 70%, resuspended in buffer 2 and finally warmed at 70°C. mtDNA content was measured by real-time quantitative PCR (RT-qPCR) using SYBR®Green technology with specific primers for a mitochondrial sequence (Dloop, forward primer ATAGCCGTCAAGGCATGAAA, reverse primer GATTGGGTTTTGCGGACTAA) and for a nuclear gene (B2M (beta-2-microgobulin), forward primer TGGTAAAGCAAAGAGGCCTAA, reverse primer AGAAGTAGCCACAGGGTTGG). The difference between the threshold cycle (Ct) of nuclear gene and mtDNA sequence (ΔCt) was used to assess the mtDNA/nDNA ratio, which was calculated using the following formula: 2(2 –ΔCt) (for details see Dimmock et al. 2010).
Mitochondrial respiration
Respiratory parameters of total mitochondrial population were studied in situ as previously described (Kuznetsov et al. 2008). Fibres of plantaris and white gastrocnemius muscles were separated under a binocular microscope in skinning (S) solution (below) at 4°C, and permeabilized in the same solution with 50 μg ml−1 of saponin for 30 min. Then, adenine nucleotides and creatine phosphate were eliminated by 10 min washing in respiration (R) solution (below) at 4°C. Experiments were performed on washed fibres under continuous stirring in an oxygraphic cell (Strathkelvin Instruments, UK), equipped with a Clark electrode, containing 3 ml of solution R with additional substrates at 22°C. After the experiments, fibres were collected and dried. Respiration rates were expressed as μmol O2 min (g dry weight)−1.
Solutions S and R both contained (in mm): EGTA–CaEGTA buffer 10 (free Ca2+ concentration 100 nm), free Mg2+ 1, taurine 20, DTT 0.5, and imidazole 20 (pH 7.1). Ionic strength was adjusted to 160 mm by addition of CH3KO3S. Solution S also contained MgATP 5 and PCr 15, whereas solution R contained 3 mm KH2PO4 and 2 mg ml−1 fatty acid-free BSA.
The experimental protocol used was based on substrate utilization pathways. Firstly basal mitochondrial respiration rate was determined using 2 mm ADP and 5 mm malate (V0). Secondly fatty acid oxidation rate was determined using palmitoyl-coenzyme A + carnitine (100 μm+ 2 mm), followed by the measurement of respiration rate with pyruvate (1 mm). Lastly to determine the maximal capacity of the respiratory chain (complexes I, II, III, IV), glutamate (10 mm) and succinate (15 mm) were added to maximally activate complex I and II (Vmax). Fatty acid utilization was calculated by subtracting V0 from the fatty acid oxidation rate. Fatty acid utilization was expressed as a percentage of Vmax.
Electron microscopy
Samples of the white gastrocnemius muscles from 8-month-old mice were prepared for electron microscopy as previously described in (Novotova et al. 2006). Isolated muscles were stretched by 30% of their resting length in nominally calcium-free Krebs solution, and fixed with 2% glutaraldehyde in cacodylate buffer (150 mm sodium cacodylate, 2.0 mm CaCl2; pH 7.3) for 30 min. Four samples of each muscle were dissected from superficial regions around the central part of the muscle and fixed again for 45 min with 2% glutaraldehyde in cacodylate buffer, post-fixed for 45 min with 1% OsO4 in cacodylate buffer, and contrasted overnight with a saturated solution of uranyl acetate in H2O. The samples were embedded in Durcupan (Fluka AG, Switzerland). Ultrathin (58–60 nm) longitudinal or transversal sections, were cut by Powere-Tome MT-XL ultramicrotome (RMC/Sorvall, Tucson, USA), placed on copper grids covered with formvar, and contrasted by lead citrate. The sections were examined with JEM 1200 electron microscope (Jeol, Japan). Images were recorded using a Gatan Dual Vision 300W CCD camera (Gatan Inc., USA).
EM quantification of individual mitochondrial surface in Opa1+/+ and Opa1+/− white gastrocnemius muscles was performed using Image J software on 18 slices (randomly chosen, magnification 50,000×) per animal (5 different animals for trained and 2 for sedentary animals) as previously (Piquereau et al. 2012). The mean value of individual mitochondrial surface was obtained on the whole population of mitochondria (for each group), and the distribution of these mitochondrial surfaces calculated for each animal in each group.
RT-qPCR analysis
Total muscle RNA (RNAm) was extracted from 10 mg frozen tissue samples using a standard procedure with Bertin Precellys 24 and ice-cold Trizol reagent (Invitrogen) for extraction. Then, RNAm was precipitated by ethanol and resuspended in RNase-free water. RNA was quantified and checked for purity using the ratio of its absorbance at 260 and 280 nm. Oligo-dT first strand complementary DNA was synthesized from 1 μg total RNA according to the protocol provided with the iScipt cDNA synthesis kit (Bio-Rad).
Quantification of mRNA via production of cDNA was assessed using the SYBR Green method as previously described (Piquereau et al. 2010) on a CFX96 (Bio-Rad).
Each PCR amplification was performed with 12.5 ng of cDNA in a total reaction volume of 15 μl. The reaction mixtures consisted of 5 μl diluted template, 3 μl Master Mix (Roche) and 0.75 μm forward and reverse primers (Table 1). After 10 min of Taq polymerase activation, amplification was allowed to proceed for 45 cycles: each cycle consisting of denaturation at 95°C for 10 s, annealing at specific temperature (Table 1) for 5 s and extension at 72°C for 7 s. Quantification of test sample concentration was assessed using the SYBR Green method on a LightCycler rapid thermal cycler (Roche Diagnostics) and was achieved using a linear standard curve constructed from the analysis of a fivefold serial dilution from cDNA of sedentary Opa1+/+. Primers were designed to be specific for a different exon of the target gene sequence, thereby eliminating the possibility of amplifying genomic DNA; primer sequences are presented in Table 1. A basic local alignment search tool (BLAST) search performed for each set of primers revealed that sequence homology was obtained only for the target gene. HK2 was chosen as housekeeping gene as its expression did not differ between groups.
Table 1.
Primers and conditions for real-time PCR amplification
| Genes | GeneBank No. | Forward primers (5′>3′) Reverse primers (5′>3′) | PCR product size (pb) | Annealing temperature (°C) |
|---|---|---|---|---|
| ACADM | NM_007382 | CCG TTC CCT CTC ATC AAA AG | 129 | 60 |
| ACA CCC ATA CGC CAA CTC TT | ||||
| CD36 | NM_007643 | CCA CTG TGT ACA GAC AGT TTT GG | 195 | 60 |
| GCT CAA AGA TGG CTC CAT TG | ||||
| CPT1β | NM_009948 | TCA CCT GGG CTA CAC GGA GA | 219 | 65 |
| TCG GGG CTG GTC CTA CAC TT | ||||
| COX I | NC_006914 | CAC TAA TAA TCG GAG CCC CA | 129 | 60 |
| TTC ATC CTG TTC CTG CTC CT | ||||
| COX IV | NM_017202 | TGG GAG TGT TGT GAA GAG TGA | 273 | 58 |
| GCA GTG AAG CCG ATG AAG AAC | ||||
| CS | NM_130755 | CAA GAT TGT GCC CAA TAT CCT C | 111 | 60 |
| TTC ATC TCC GTC ATG CCA TA | ||||
| DRP1 | NM_053655 | CTG ACG CTT GTG GAT TTA CC | 277 | 58 |
| CCC TTC CCA TCA ATA CAT CC | ||||
| ERRα | NM_001008511 | TCA AGG AGG GTG TGC GTC TG | 296 | 65 |
| CTT GGC CCA GCT GAT GGT GA | ||||
| FIS1 | NM_025562 | GCC TGG TTC GAA GCA AAT AC | 116 | 60 |
| CAC GGC CAG GTA GAA GAC AT | ||||
| GLUT4 | NM_009204 | CCG TGG CCT CCT ATG AGA TAC T | 122 | 64 |
| AGG CAC CCC GAA GAT GAG T | ||||
| HADHA | NM_178878 | GTA TCT TCG CCA GCA ACA CA | 208 | 60 |
| ACC ACA ATG ATG ACC TTC CC | ||||
| HK2 | NM_013820 | TTT CAC CTT CTC GTT CCC CT | 175 | 60 |
| GTC ATT CAC CAC AGC CAC AA | ||||
| MCIP1 | NM_019466 | CAG CGA AAG TGA GAC CAG GG | 309 | 60 |
| ACG GGG GTG GCA TCT TCT AC | ||||
| MFN1 | NM_024200 | TGC CCT CTT GAG AGA TGA CC | 182 | 60 |
| AGA GCC GCT CAT TCA CCT TA | ||||
| MFN2 | NM_133201 | GGG GCC TAC ATC CAA GAG AG | 115 | 60 |
| CCT TGG ACA GGT ACC CTT TG | ||||
| NRF1 | NM_010938 | TTA CTC TGC TGT GGC TGA TGG | 92 | 60 |
| CCT CTG ATG CTT GCG TCG TCT | ||||
| OPA1 | NM_133752 | TCA GCA AAG CTT ACA TGC AGA | 180 | 60 |
| TGC TTG GAC TGG CTA CAT TTT | ||||
| PDK4 | NM_013743 | CCT TCA CAC CTT CAC CAC AT | 189 | 60 |
| AAA GAG GCG GTC AGT AAT CC | ||||
| PGC1α | NM_008904 | CAC CAA ACC CAC AGA GAA CAG | 210 | 58 |
| GCA GTT CCA GAG AGT TCC ACA | ||||
| PPARα | NM_011144 | AAG TGC CTG TCT GTC GGG AT | 161 | 62 |
| GCT TCG TGG ATT CTC TTG CC | ||||
| PPARβδ | NM_011145 | GCC TCC ATC GTC AAC AAA GA | 230 | 60 |
| TCT ACC TGG GGC ACA TTC AT | ||||
| Tfam | NM_009360 | GCT GAT GGG TAT GGA GAA G | 161 | 56 |
| GAG CCG AAT CAT CCT TTG C |
ACADM, acyl-coenzyme A dehydrogenase medium chain; CD36, cluster of differentiation 36; CPT1β, muscle isoform of carnitine palmitoyl transferase I; COX I, cytochrome c oxidase subunit I; COX IV, cytochrome c oxidase subunit IV; CS, citrate synthase; DRP1, dynamin-1-like protein; ERRα, estrogen related receptor alpha; FIS1, mitochondrial fission 1 protein; GLUT4, glucose transporter type 4; HADHA, hydroxyacyl-coenzyme A dehydrogenase subunit alpha; HK2, hexokinase 2; MCIP1, regulator of calcineurin 1; MFN, 1 and 2 mitofusin 1 and 2; NRF,1 nuclear respiratory factor 1; OPA1, optic atrophy type 1; PDK, pyruvate dehydrogenase kinase; PGC, peroxisome proliferator activated receptor gamma co-activator; PPARα and βδ, peroxisome proliferator-activated receptor α and βδ; Tfam, mitochondrial transcription factor A.
Statistics analysis
All data are presented as means ± SEM, and significance was set at P < 0.05. Two-way ANOVA was used to study the global effect of training activity and OPA1 genotype, followed by Newman–Keuls post hoc test when appropriate to determine individual differences. For voluntary activity measurements, paired Student's t test was applied. *indicates Opa1+/− versus Opa1+/+, # indicates active versus sedentary, $ indicates global effect of genotype or training.
Results
Characterization of sedentary Opa1+/− mice
Sedentary Opa1+/− mice evidenced a slight but highly significant lower body and heart weight compared to their control littermates (Table 2). Before starting training experiments, we checked to see that the ubiquitous mutation of OPA1 had no impact on global mice behaviour, which could influence the results of the running wheel experiments. Six-month-old Opa1+/+ and Opa1+/− male mice were therefore exposed to a series of behavioural tests that ranged in stress in order to estimate their stress resistance, degree of anxiety and agility (Fig. 1). No difference was observed in any parameters during the open field test (Fig. 1A and B) and in the elevated plus maze test (Fig. 1C, D and E). Furthermore, in the tail suspension test, both strains had the same period of immobility-enduring discomfort (Fig. 1F). Finally, motor coordination and balance capabilities of the mice were estimated using an accelerod. Again, no difference was observed between the two mouse strains (Fig. 1G). Thus, we concluded that OPA1 deficiency has no major impact on mouse behaviour.
Table 2.
Anatomical data
| Sedentary | Trained | ||||||
|---|---|---|---|---|---|---|---|
| Opa1+/+ | Opa1+/− | Opa1+/+ | Opa1+/− | Genotype | Training | Interaction | |
| BW (g) | 33.6 ± 0.6 | 29.7 ± 0.4*** | 32.5 ± 0.9 | 30.0 ± 0.5* | $$$ | n.s. | n.s. |
| HW (mg) | 178.9 ± 7.5 | 154.1 ± 6.1* | 178.1 ± 5.6 | 169.9 ± 5.0 | $$ | n.s. | n.s. |
| LVW (mg) | 111.5 ± 4.9 | 95.4 ± 1.6** | 113.3 ± 3.5 | 107.2 ± 2.4# | $$ | n.s. | n.s. |
| Soleus W (mg) | 9.9 ± 0.3 | 9.1 ± 0.3 | 12.2 ± 0.4### | 10.9 ± 0.5*## | $$ | $$$ | n.s. |
| Plantaris W (mg) | 21.3 ± 0.9 | 21.8 ± 1.1 | 22.1 ± 1.1 | 19.9 ± 1.2 | n.s. | n.s. | n.s. |
| Tibia length (cm) | 1.80 ± 0.01 | 1.81 ± 0.01 | 1.80 ± 0.01 | 1.79 ± 0.01 | n.s. | n.s. | n.s. |
| BW/TL (g cm−1) | 18.7 ± 0.2 | 16.4 ± 0.2*** | 18.0 ± 0.4 | 16.8 ± 0.2** | $$$ | n.s. | n.s. |
| HW/BW (mg g−1) | 5.3 ± 0.2 | 5.2 ± 0.2 | 5.5 ± 0.2 | 5.7 ± 0.2 | n.s. | n.s. | n.s. |
| LVW/BW (mg g−1) | 3.34 ± 0.17 | 3.18 ± 0.07 | 3.5 ± 0.09 | 3.57 ± 0.07# | n.s. | $$ | n.s. |
| SW/BW (mg g−1) | 0.30 ± 0.01 | 0.29 ± 0.01 | 0.38 ± 0.01### | 0.36 ± 0.02### | n.s. | $$$ | n.s. |
| PW/BW (mg g−1) | 0.63 ± 0.03 | 0.72 ± 0.03 | 0.68 ± 0.04 | 0.67 ± 0.04 | n.s. | n.s. | n.s. |
BW, body weight; HW, heart weight; LVW, left ventricular weight; SW, soleus weight; PW, plantaris weight; TL, tibia length. Sedentary Opa1+/+ (n= 17), Opa1+/− (n= 16); trained Opa1+/+ (n= 19), Opa1+/− (n= 17) 8-month-old mice. Values are means ± SEM. Significant differences: *,#,$P < 0.05, **,##,$$P < 0.01, ***,###,$$$P < 0.001. *=Opa1+/− versus Opa1+/+, #= active versus sedentary, $= global effect of genotype or training.
Figure 1. Similar behaviour of Opa1+/+ and Opa1+/− mice.
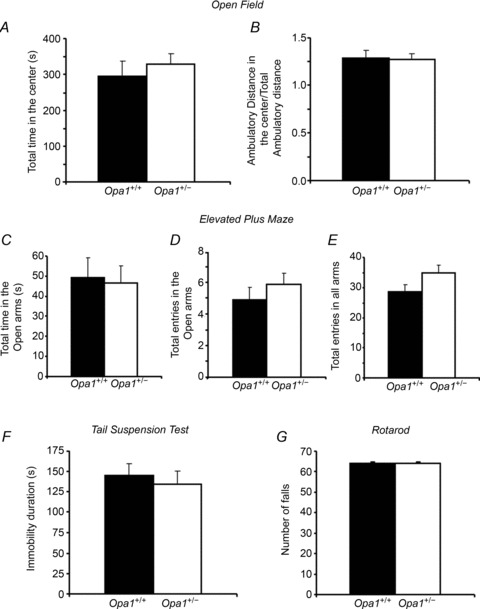
A and B, effects of OPA1 deficiency on anxiety behaviours in the open field test. Anxiety is measured as mean of the total time spent in the centre in seconds (A). Locomotor activity is measured as total ambulatory distance travelled (B). C–E, effects of OPA1 deficiency on anxiety behaviours in the elevated plus maze. Anxiety is expressed as mean total time in the open arms (C), as mean total entries in the open arms (D) and as mean total entries in all arms as an index of their locomotion (E). F, effects of OPA1 deficiency on behaviour in the tail suspension test. Results are expressed as mean of immobility duration (in seconds) as their resignation indices. G, effects of OPA1 deficiency in the rotarod test. The number of falls during accelerating rotarod test as balance capabilities indicator. Values are means ± SEM. Sedentary Opa1+/+ (n= 12) and Opa1+/− (n= 12) 6-month-old animals.
Additional experiments were also performed to verify that mutant mice possessed the same capacity to exercise at basal level. Therefore, animals were tested for their MAS and their endurance by forced treadmill activity (Fig. 2A). Both groups reached the same maximal aerobic velocity and had the same endurance time. No difference was also observed at the metabolic level since circulating glucose, cholesterol and triglycerides measured in blood samples taken before and after exhaustion was reached were identical (data not shown). We therefore concluded that sedentary Opa1+/− mice had no major behavioural disorder and possessed the same physical aerobic capacity as control mice.
Figure 2. Similar training capacity of Opa1+/+ and Opa1+/− mice but increased endurance performance in trained Opa1+/− mice.
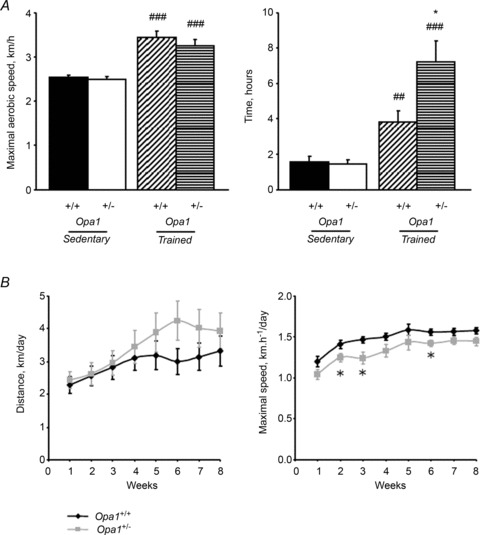
A, forced activity of 6-month-old or after 2 months of training Opa1+/− and Opa1+/+ animals expressed as means of maximal running speed (left panel) or running time before exhaustion (right panel). Values are means ± SEM. Significantly different: *P < 0.05, ##P < 0.01, ###P < 0.001. *=Opa1+/− versus Opa1+/+, #= active versus sedentary. Sedentary Opa1+/+ (n= 16), Opa1+/− (n= 15), trained Opa1+/+ (n= 9) and Opa1+/− (n= 7) mice. B, voluntary wheel running capacity of Opa1+/+ (n= 21) and Opa1+/− (n= 20) 6-month-old animals expressed as daily running distance (left panel) or maximal running speed (right panel) over a 8 week period. Values are means ± SEM. *Significantly different from Opa1+/+, P < 0.05.
Response of Opa1+/− mice to training
The impact of OPA1 mutation on mouse voluntary exercise was estimated by monitoring the weekly averaged running distance of Opa1+/+ and Opa1+/− mice and the maximal speed reached in the wheel (Fig. 2B). In both groups, we observed a progressive increase in these parameters with time, with no significant difference between animals. Only small differences were observed for the maximal speed at weeks 2, 3 and 6, but globally OPA1 deficiency did not alter the ability of the mice to perform voluntary running activity and to train.
Although both groups of animals seemed to be able to perform the same physical activity, it was possible that their endurance capacity differed after prolonged training. Thus, we measured the maximal running capacity and running time before exhaustion in 8-month-old animals using the same forced treadmill test at the end of the training period on (Fig. 2A). As expected, training improved these parameters in both groups due to its beneficial effect on the physical capacity of animals. But, surprisingly, the endurance capacity of Opa1+/− mice increased five times after training and much more than for Opa1+/+ mice (two-fold increase, P < 0.01; Fig. 2A, right panel) with a strong genotype effect (P < 0.001). Thus, after training, Opa1+/− mice became better adapted to forced exercise than control mice.
Data given in Table 2 show the effect of OPA1 mutation and training on anatomical parameters of sedentary and trained mice. Eight-month-old Opa1+/− mice had lower body weights and body weight-to-tibia lengths compared to Opa1+/+ mice. When normalized to body weight, no difference was observed in organ weights between sedentary mice. After training, body weight was not changed. Left ventricular weight hypertrophy was only observed in Opa1+/− mice, while soleus hypertrophy occurred in both groups of animals (training effect P < 0.001). No effect of training was observed on plantaris muscle weight. Thus, the main anatomical effect of OPA1 deficiency in response to exercise was cardiac hypertrophy, which may reflect an adaptation of Opa1+/− mice to sustained voluntary exercise.
Mitochondrial adaptation of trained Opa1+/− skeletal muscle
Exercise training is expected to increase mitochondrial biogenesis. We first measured the level of OPA1 protein in the four groups of animals (Fig. 3A). White gastrocnemius muscle was used for this purpose. Results showed that Opa1+/− mouse skeletal muscle had a 50% reduction of OPA1 protein, as expected, with no change in protein variants. After training, OPA1 protein content was significantly increased in Opa1+/+ mice, but not in Opa1+/− mice. CS protein content, a marker of mitochondrial mass, was also increased after training, but to a lower extent in Opa1+/− mice compared to Opa1+/+ mice. These results revealed possible alteration of mitochondrial biogenesis in Opa1+/− mice. We thus studied in more detail mitochondrial biogenesis and function in order to understand how Opa1+/− mice adapt to exercise training.
Figure 3. Decreased expression of mitochondrial proteins following training in Opa1+/− mice.
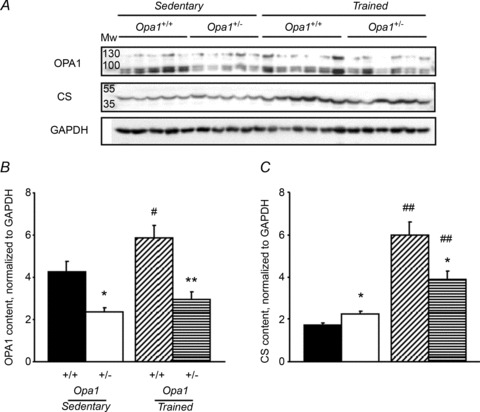
A, original recording of OPA1 and CS protein content. GAPDH was used for normalization. Each lane was loaded with 50 μg of total white gastrocnemius muscle extracts of 8-month-old sedentary or active Opa1+/+ and Opa1+/− mice. B, OPA1 content normalized to GAPDH. C, CS content normalized to GAPDH. Values are means ± SEM. Significant differences: #P < 0.05, ##P < 0.01 trained versus sedentary, *P < 0.05, **P < 0.01. Opa1+/− versus Opa1+/+ for sedentary or trained mice. Sedentary Opa1+/+ (n= 5), Opa1+/− (n= 5), trained Opa1+/+ (n= 6) and Opa1+/− (n= 6) 8-month-old mice.
Citrate synthase (CS) and cytochrome oxidase (COX) activities were measured to further assess muscle mitochondrial mass before and after training (Fig. 4A). OPA1 haploinsufficiency did not alter these activities in the basal state, nor after training, in oxidative muscles (ventricle and soleus). By contrast, in fast skeletal muscles (plantaris and white gastrocnemius) of both mouse strains, training induced an increase in CS and COX activities. This increase was, however, blunted in Opa1+/− mice, again suggesting possible alteration of mitochondrial biogenesis in response to training. The same behaviour was observed for mitochondrial complexes in the white gastrocnemius muscle (Fig. 4B). Finally, we assessed mtDNA/nDNA content (Fig. 3C). Measurements revealed a slight decrease in sedentary Opa1+/− animals compared to Opa1+/+ mice and a significant increase after training only in the Opa1+/+ mice.
Figure 4. Mitochondrial protein and mtDNA content following training in Opa1+/− mice.
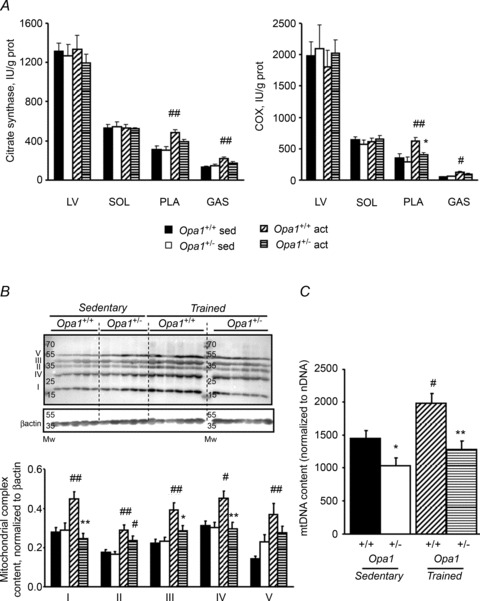
A, citrate synthase (CS) and cytochrome oxidase (COX) activities. Activities were measured spectrophotometrically in left ventricle (LV), soleus (SOL), plantaris (PLA) and white gastrocnemius (GAS) muscles of sedentary and trained mice. B, original recording of subunits of mitochondrial complexes in GAS (upper lane). Proteins were normalized to β-actin (lower lane). C, ratio of mitochondrial to nuclear DNA content. Sedentary Opa1+/+ (n= 5), Opa1+/− (n= 5), trained Opa1+/+ (n= 6), and Opa1+/− (n= 6) 8-month-old mice. Values are means ± SEM. Significant differences: #P < 0.05, ##P < 0.01 trained versus sedentary, *P < 0.05, **P < 0.01 Opa1+/− versus Opa1+/+ for sedentary or trained mice.
To understand at which step mitochondrial biogenesis was disturbed in Opa1+/− mice, we next measured the expression of genes involved in mitochondrial dynamics and biogenesis in white gastrocnemius muscle (Fig. 5A). In sedentary animals, none of the mRNA levels of genes involved in mitochondrial dynamic were modified, showing no clear compensation for OPA1 deficiency. Exercise training clearly activated the transcription cascade of mitochondrial biogenesis, including the genes involved in mitochondrial dynamics, with OPA1 similarly activated in both mouse strains. A training effect was observed for all genes except for MCIP1, the marker of calcineurin activation and Tfam, while a genotype effect was observed only for PGC-1α. Interestingly, in this glycolytic muscle a large induction of mRNA levels was observed after training for all the genes involved in fatty acid and carbohydrate utilization (Fig. 5B) except for PDK4, but again without significant differences between strains except for HADHA and PDK4. In conclusion, OPA1 deficiency had no major impact on the response to exercise training at the transcription level of genes involved in mitochondrial dynamics, biogenesis, and substrate utilization.
Figure 5. Increased mitochondrial biogenesis in white gastrocnemius muscle.
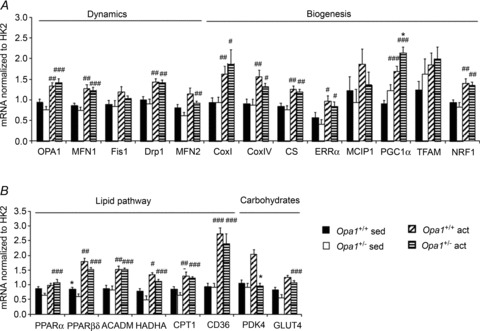
A and B, mRNA expression levels of proteins. A, proteins involved in mitochondrial dynamics and biogenesis. B, proteins in glucose and lipid utilization pathways. mRNA levels were normalized to mRNA level of HK2. Values are means ± SEM. Significant differences: *,#P < 0.05, **, ##P < 0.01, ***, ###P < 0.001. *=Opa1+/− versus Opa1+/+,#= active versus sedentary. 6-month-old, 2-month trained.
Mitochondrial morphology of Opa1+/− skeletal muscle
Because OPA1 deficiency can affect mitochondrial morphology, we also studied the mitochondrial network organization in the white gastrocnemius of the four groups of animals (Fig. 6). Muscle fibres of control Opa1+/+ mice displayed typical ultrastructural features of fast glycolytic fibres. Myofibrils were arranged in register, with triads present near the I- and A-band boundaries. Profiles of mitochondria in longitudinal sections were small, with mitochondria localized at the sides of the I-bands near the Z-lines. Ultrastructural analysis of the control fibres revealed the presence of tubular aggregates intercalated between myofibrils and under the sarcolemma. Mitochondrial ultrastructure was normal with a regular arrangement of cristae and a homogeneous matrix (Fig. 6A). In Opa1+/− mice, the ultrastructure of muscle fibres was slightly disordered in some regions of the fibres due to an irregular arrangement of the sarcomeres. Electron microscopic analysis revealed regions with regularly arranged mitochondria near the Z-lines but the size of mitochondria appeared heterogeneous compared to the control. Some mitochondria were devoid of cristae and matrix (Fig. 6B and D), and signs of mitochondrial destruction were often observed (Fig. 6C and D). A specific feature of muscle fibres of Opa1+/− mice was the presence of large mitochondria. The ultrastructure of giant mitochondria was modified. Disappearance of cristae in these mitochondria was accompanied by formation of irregular vacuoles (Fig. 6E). In some large mitochondria, altered cristae morphology, as well as the absence of outer mitochondrial membranes was found (Fig. 6F).
Figure 6. Altered ultrastructure of trained Opa1+/− white gastrocnemius muscle.
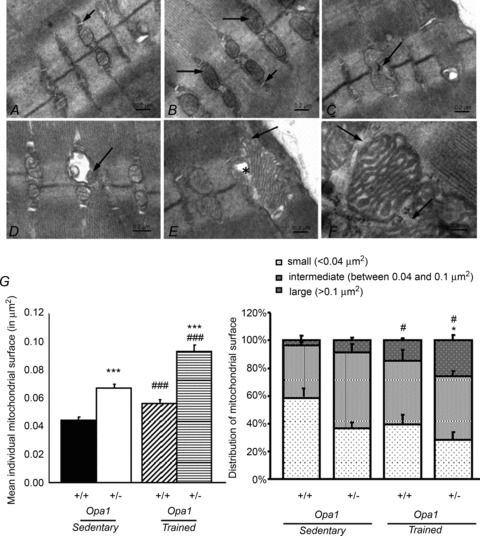
A, control mice. Skeletal muscle shows normal mitochondria with abundant cristae, there is absence of ultrastructural changes inside mitochondria. Mitochondria are placed in their para-Z-disc distribution between the myofibrils, small arrow – triad. B–F, Opa1+/− mice. B, the electron micrograph shows slightly dilated mitochondria, some mitochondria deprived of cristae (arrows); small arrow – triad. C, a slightly dilated mitochondrion with regression of cristae and signs of mitochondrial destruction (arrow). D, a vesicular swollen mitochondrion with remnants of matrix compartment (arrow). E, a giant subsarcolemmal mitochondrion showing fragmentation and disappearance of cristae (arrow). The loss of matrix in the mitochondrion is accompanied by the presence of irregular vacuoles (*). F, high magnification of mitochondria with remodelled morphology of cristae, and evidence of disrupted outer mitochondrial membrane (arrows). G, quantification of individual mitochondrial surface in Opa1+/+ and Opa1+/− mice before and after training by analysis of EM white gastrocnemius tissue images. Left panel, average of individual mitochondrial surface estimated on 18 slices per animal (5 different animals for trained and 2 for sedentary animals). Right panel, distribution of individual mitochondrial surface between small (<0.04 μm2), intermediate (between 0.04 and 0.1 μm2) or large (>0.1 μm2) mitochondria. Values are means ± SEM. Significant differences: *,#P < 0.05, ***,###P < 0.001. *= Opa1+/− versus Opa1+/+, #= active versus sedentary.
Quantitative analysis of EM images was performed, with results presented in Fig. 6G, confirming that, in sedentary and trained animals, mitochondria from Opa1+/− mice were larger than those of control mice. Interestingly, training seemed to induce an increase in mitochondrial size in both mouse strains, which was more pronounced in Opa1+/− mice. Distribution of mitochondrial sizes confirmed the appearance of large mitochondria after training in both mice, which was more pronounced in Opa1+/− mice. The irregular size of mitochondria in Opa1+/− trained mice compared to wild type was evidenced by an increase of the standard deviation of mitochondrial surface (0.035 ± 0.005 for trained Opa1+/+ and 0.052 ± 0.006 for trained Opa1+/−, P < 0.05).
Effect of training on energy metabolism in Opa1+/− mice
Since the lack of OPA1 could influence the response to training of enzymes involved in energy transfer, we measured creatine kinase (CK), adenylate kinase (AK) and lactate dehydrogenase (LDH) activities in the four groups of animals (Table 3). Globally, neither physical activity nor OPA1 deficiency induced major changes in the activities of these enzymes. Interestingly, however, the training-induced increase in activity in plantaris MM-CK and MB-CK isoforms of CK (mi-CK) was three times lower in Opa1+/− mice than in Opa1+/+ mice, consistent with the observation of blunted mitochondrial biogenesis, while LDH activity was slightly decreased in the soleus of Opa1+/− trained mice. Thus, genotype did not appear to have significant effects on intracellular energy transfer, which could explain how the two groups of animals could achieve the same training performances.
Table 3.
Biochemical parameters
| Sedentary | Trained | ||||||
|---|---|---|---|---|---|---|---|
| Opa1+/+ | Opa1+/− | Opa1+/+ | Opa1+/− | Genotype | Training | Interaction | |
| Ventricle | |||||||
| AK | 2283 ± 84 | 2086 ± 75 | 2489 ± 281 | 1798 ± 87* | $ | n.s. | n.s. |
| CK | 2546 ± 163 | 2434 ± 156 | 2851 ± 300 | 2276 ± 101 | n.s. | n.s. | n.s. |
| LDH | 1408 ± 40 | 1408 ± 73 | 1549 ± 160 | 1284 ± 49 | n.s. | n.s. | n.s. |
| Soleus | |||||||
| AK | 3269 ± 138 | 3507 ± 184 | 3353 ± 156 | 3074 ± 111 | n.s. | n.s. | n.s. |
| CK | 5251 ± 241 | 5192 ± 301 | 5275 ± 327 | 4911 ± 131 | n.s. | n.s. | n.s. |
| LDH | 1089 ± 60 | 1145 ± 49 | 931 ± 62 | 902 ± 41* | n.s. | $$ | n.s. |
| Plantaris | |||||||
| AK | 4612 ± 176 | 4992 ± 298 | 5149 ± 188 | 5039 ± 203 | n.s. | n.s. | n.s. |
| CK | 11397 ± 639 | 12741 ± 372 | 11632 ± 280 | 11442 ± 629 | n.s. | n.s. | n.s. |
| mi-CK | 166 ± 18 | 255 ± 53 | 414 ± 34## | 386 ± 33# | n.s. | $$$ | n.s. |
| MM-CK | 11172 ± 636 | 12402 ± 329 | 11265 ± 284 | 10875 ± 705 | n.s. | n.s. | n.s. |
| MB-CK | 59 ± 8 | 84 ± 14 | 86 ± 9 | 93 ± 13 | n.s. | n.s. | n.s. |
| LDH | 2373 ± 73 | 2533 ± 173 | 2379 ± 89 | 2148 ± 94 | n.s. | n.s. | n.s. |
| White gastrocnemius | |||||||
| AK | 4861 ± 298 | 5946 ± 389 | 5682 ± 287 | 4959 ± 327 | n.s. | n.s. | $$ |
| CK | 15129 ± 653 | 16055 ± 1016 | 15961 ± 800 | 13692 ± 718 | n.s. | n.s. | n.s. |
| mi-CK | 118 ± 25 | 103 ± 33 | 150 ± 33 | 146 ± 21 | n.s. | n.s. | n.s. |
| MM-CK | 14937 ± 641 | 15882 ± 1002 | 15717 ± 775 | 13455 ± 720 | n.s. | n.s. | n.s. |
| MB-CK | 74 ± 12 | 70 ± 10 | 95 ± 13 | 91 ± 8 | n.s. | n.s. | n.s. |
| LDH | 2697 ± 123 | 3219 ± 292 | 3217 ± 154 | 2664 ± 175 | n.s. | n.s. | $ |
Sedentary Opa1+/+ (n= 8), Opa1+/− (n= 6); trained Opa1+/+ (n= 9), Opa1+/− (n= 9) mice. AK, adenylate kinase; CK, creatine kinase; mi-CK, MM-CK and MB-CK isoforms of CK; LDH, lactate dehydrogenase. Values are means ± SEM (IU (g protein)−1). Significantly different: *,#,$ P < 0.05, $$P < 0.01, ###,$$$P < 0.001. *=Opa1+/− versus Opa1+/+,#= active versus sedentary, $= global effect of genotype or training.
Finally, the activity of the respiratory chain and the ability of mitochondria to utilize different substrates were studied in fast and mixed skeletal muscles by measuring oxygen consumption before and after training (Table 4). In control mice, training did not improve maximal respiratory capacities of eithre plantaris or white gastrocnemius muscles (Table 4). Opa1+/− trained mice showed an increase in Vmax (+46%) only in plantaris muscle. Fatty acid (FA) utilization, a relevant marker of endurance capacity, was also estimated in the plantaris and white gastrocnemius muscles (Fig. 7A). Interestingly, training had no effect on FA utilization in control mice, but had a significant effect on Opa1+/− trained mice, FA utilization was improved by 47% in plantaris muscle and by 57% in white gastrocnemius muscle. Interaction between genotype and training effects were observed for several parameters relating to FA utilization. No change in pyruvate utilization was observed in plantaris and white gastrocnemius (Table 4). All the results suggest that a training-induced metabolic remodelling occurred in Opa1+/− mice, suggesting a better ability to utilize FA, which could explain the better endurance capacity of Opa1+/− mice after training.
Table 4.
Respiration parameters
| Sedentary | Trained | ||||||
|---|---|---|---|---|---|---|---|
| Opa1+/+ | Opa1+/− | Opa1+/+ | Opa1+/− | Genotype | Training | Interaction | |
| Plantaris | |||||||
| V0 | 0.9 ± 0.2 | 0.5 ± 0.1 | 1.8 ± 0.3 # | 1.1 ± 0.1 * | $ | $$ | ns |
| Vmax | 22.5 ± 2.2 | 18.9 ± 1.4 | 24.8 ± 1.8 | 27.6 ± 3.2 # | ns | $ | ns |
| V FA | 2.2 ± 0.2 | 1.7 ± 0.1 | 1.8 ± 0.2 | 3.7 ± 0.8 **## | ns | $ | $$ |
| V Pyr | 12.9 ± 2.0 | 8.5 ± 1.5 | 11.2 ± 1.5 | 12.7 ± 1.3 | ns | ns | $ |
| White gastrocnemius | |||||||
| V0 | 0.6 ± 0.1 | 0.6 ± 0.1 | 0.5 ± 0.1 | 0.5 ± 0.0 | ns | ns | ns |
| Vmax | 15.0 ± 0.8 | 13.7 ± 0.8 | 15.7 ± 0.6 | 14.5 ± 0.6 | ns | ns | ns |
| V FA | 0.9 ± 0.1 | 0.9 ± 0.2 | 1.0 ± 0.1 | 1.4 ± 0.1 *## | ns | $$ | ns |
| V Pyr | 8.0 ± 0.9 | 8.3 ± 0.4 | 7.3 ± 0.8 | 6.9 ± 0.6 | ns | ns | ns |
Plantaris: sedentary Opa1+/+ (n= 7), Opa1+/− (n= 7); trained Opa1+/+ (n= 7), Opa1+/- (n= 6) mice. White gastrocnemius: sedentary Opa1+/+ (n= 9), Opa1+/− (n= 9); trained Opa1+/+ (n= 17), Opa1+/− (n= 13) mice. V values are means ± SEM (μmol O2 min−1 (g dry wt)−1) V0, respiration rate in malate and ADP. Vmax, maximal respiration rate in FA, pyruvate, glutamate and succinate. V FA, respiration rate in presence of carnitine and palmitoyl-CoA. V Pyr, respiration rate in pyruvate. Significant differences: *,#,$P < 0.05, $$P < 0.01, ###,$$$P < 0.001. *=Opa1+/− versus Opa1+/+,#= active versus sedentary, $= global effect of genotype or training.
Figure 7. Increased fatty acid oxidation rates in trained fast skeletal muscles of Opa1+/− mice.
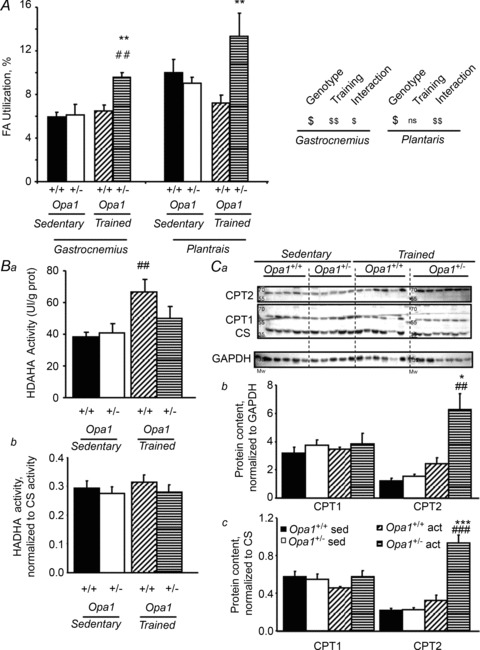
A, respiration rates were measured in saponin-permeabilized fibres of white gastrocnemius and plantaris muscles. Fatty acid utilization rate with carnitine and palmitoyl-CoA is expressed relative to maximal respiration rate with FA, pyruvate, glutamate and succinate. Ba, β-hydroxyacyl-CoA dehydrogenase (HADHA) activity measured spectrophotometrically in white gastrocnemius (GAS) muscles of sedentary and trained mice; Bb, same measurement, normalized to CS activity. Ca, original recording of CPT2 and CPT1 protein content. CS and GAPDH content were used for normalization. Quantification of CPT1 and CPT2, normalized to GAPDH (Cb) or CS (Cc). Values are means ± SEM Significantly different: *P < 0.05. **,##P < 0.01. ***,###P < 0.001. *=Opa1+/− versus Opa1+/+, #= trained versus sedentary.
To understand at which metabolic step FA utilization had been improved, different parameters were measured. HADHA activity, as an index of β-oxidation, was estimated in the four conditions (Fig. 7B), with the results showing a similar profile as for other mitochondrial proteins. Thus, HADHA activity increased more after training in control mice than in Opa1+/− mice, with the increases being proportional to CS increase (Fig. 7B, lower panel). We also measured the content of CPT1 and CPT2, the mitochondrial fatty acid transporters (Fig. 7C). Interestingly, while we observed no major difference in CPT1 content in the four groups, we observed a large increase in CPT2 in Opa1+/− mice. Normalized to CS content, this increase was still present. This result supports our previous observation of an increase in fatty acid utilization in these animals after training.
Discussion
Mutations in the mitochondrial fusion protein OPA1 are responsible for neurodegeneration of the retinal ganglion cells and induce visual defects. These mutations can also affect respiratory chain complexes and mtDNA content in skeletal muscle cells (Yu-Wai-Man et al. 2010b). It has also been shown that patients with mitochondrial disorders present proteolytic processing of OPA1 that could be involved in the alteration of mitochondria function (Duvezin-Caubet et al. 2006). Finally, it is well recognized that exercise training-induced mitochondrial biogenesis causes an increase in fusion and fission protein content (Garnier et al. 2005; Iqbal et al. 2013). However, the impact of endurance exercise training on mitochondrial biogenesis in patients and in animals with OPA1 mutation is not known. We report here that OPA1 haploinsufficiency in mice did not alter running and training capacity, but greatly improved endurance capacity after training. Adaptation to training in OPA1-deficient mice led to a unique response involving a metabolic shift towards higher FA utilization, probably due to impaired mitochondrial biogenesis.
OPA1 deficiency, exercise capacity and adaptation to exercise training
The OPA1 mutations that are responsible for optic atrophy are present in the whole body and may thus be responsible for the cardiac and skeletal muscle alterations. They may also affect exercise capacity. Indeed, heterozygous OPA1 mutations in Drosophila cause a reduced escape response, suggesting abnormal function of the skeletal muscles under stress conditions (Shahrestani et al. 2009). This also suggests that patients bearing OPA1 mutations may have altered exercise capacity. Indeed, in patients with dominant optic atrophy, a deficit of oxidative phosphorylation was evidenced by a decreased rate of post-exercise phosphocreatine resynthesis (Lodi et al. 2004, 2011). However, skeletal muscle mitochondrial mass and properties vary greatly with exercise capacity (Garnier et al. 2005) rendering human data sometimes difficult to interpret. We thus studied the exercise and training capacity of sedentary and trained Opa1+/− mice by voluntary wheel running and forced exercise on a treadmill. Because OPA1 deficiency may induce neurological disorders, we first took care to examine the mouse behaviour and found no major impact of the deficiency on anxiety, emotional reactivity, stress-related behaviours or agility, in line with previous studies (Alavi et al. 2009). We then examined the exercise capacity of untrained mice and found that work or running distance did not differ between control and deficient mice. Among the factors that can influence exercise capacity, mouse weight can play a role. We found a slightly lower body weight of Opa1+/− mice. We then tested the training ability of the mice. The 8 week running programme led to a significant improvement in the performance of mice, which again did not differ between strains. This suggests that exercise and training capacities were not altered by OPA1 deficiency. After training, heart weight increased only in Opa1+/− mice, providing evidence that training induced a more severe cardiac stress in these mice compensated by an increased cardiac weight, as observed in response to a pathological stress (Piquereau et al. 2012).
Endurance exercise performances are mainly dependent on energy metabolism and mitochondrial biogenesis. However, voluntary wheel running represents a moderate type of exercise training. To estimate the maximal endurance exercise abilities of the mice, we performed a forced treadmill running-to-exhaustion test before and after training. To compare the endurance abilities, we carefully matched the maximal aerobic running performance at which the animals ran on the treadmill. Again, in sedentary animals, there was no difference in MAS or running time. However, surprisingly, while training induced a similar increase in MAS of both strains, a striking difference was observed in the time to exhaustion, which was increased more than two-fold in Opa1+/− mice, suggesting a unique adaptive strategy.
OPA1 deficiency, exercise training and mitochondrial biogenesis
Currently, only a few studies of mitochondrial dynamics have been conducted on adult differentiated tissues and in response to environmental stress. It has been recognized for a long time that skeletal muscle responds to endurance exercise with an increase in the capacity for aerobic metabolism. This includes increases in both mass and volume of mitochondria, increased enzymes involved in fatty acid metabolism, of the citric acid cycle, and the components of the respiratory chain (Holloszy, 1975). Exercise training is thus one of the main inductors of mitochondrial biogenesis in skeletal muscle. Remodelling of the mitochondrial network plays a central role in the plasticity of skeletal muscle in response to training (Garnier et al. 2005; Bo et al. 2010). More specifically, endurance training induces an adaptation in the skeletal muscle that requires the coordination of multiple cellular events, with the most dramatic changes occurring at the level of mitochondrial biogenesis. Mitochondrial biogenesis involves not only transcription and translation of mitochondrial proteins, but also a morphological remodelling involving the fusion–fission machinery for separation of daughter mitochondria, and mitochondria affecting correct positioning between myofilaments, under the sarcolemma or around the nucleus. Thus, proper and complete mitochondrial biogenesis requires the coordination and precise succession of molecular and morphological processes.
Starting from the transcriptional machinery, the peroxisome-proliferator activated receptor gamma coactivator-1α (PGC-1α) plays a key role in the control of energy metabolism, mitochondrial biogenesis, oxidative muscle fibre switch and angiogenesis (Wu et al. 1999; Lin et al. 2002; Arany et al. 2008). It induces the transcription and co-activates a number of transcription factors involved in mitochondrial biogenesis, like the nuclear respiratory factors (NRFs) and the oestrogen-related receptors (ERRs), and in fatty acid oxidation, such as the peroxisome proliferator-activated receptors (PPARs). Mitochondrial biogenesis was similarly induced in white gastrocnemius muscle of wild-type and Opa1+/− mice, as evidenced by increased mRNA expression of transcriptional regulators, mitochondrial proteins and fatty acid oxidation enzymes in fast skeletal muscles. This was also the case for proteins involved in mitochondrial dynamics, although with no major impact on the genotype. This evidence accords with the proposal that proteins involved in mitochondrial dynamics are under the control of the mitochondrial biogenesis programme, and are therefore mainly controlled by PGC-1α and its transcription cascade and thus similarly respond to exercise training (Garnier et al. 2005; Cartoni et al. 2005; Bo et al. 2010). Importantly, this shows that the signalling pathways involved in the up-regulation of metabolic genes in response to exercise training were similarly activated in both strains and that OPA1 deficiency did not impact on mitochondrial adaptations at the transcription level. This is in accordance with the similar exercise work performed by the mice over the 8 week experimental period (26.0 ± 3.0 kjoules for WT (n= 21) versus 30.7 ± 3.5 kjoules (n= 20) for Opa1+/− mice).
OPA1 has been involved in mtDNA maintenance in skeletal muscle (Amati-Bonneau et al. 2008; Elachouri et al. 2011). We showed that in Opa1+/− mice, fast skeletal muscle mtDNA content was slightly lower than in Opa1+/+ mice. mtDNA content increased in control mice after training but not in Opa1+/− mice. On the other hand, neither COX activity nor expression of the mtDNA encoded COX subunit (COXI) was altered in sedentary animals, suggesting that the small decrease in mtDNA content was not sufficient to affect mitochondrial protein expression.
At the level of mitochondrial enzymes, exercise training induced a more than 50% increase in CS and COX activities in fast but not in slow muscles, but the effects were different in the two mouse strains. Indeed, CS and COX activities, as well as respiratory chain complexes, CS and OPA1 protein content increased less in fast muscles of Opa1+/− mice despite a similar increase in mRNA levels, suggesting a defective mitochondrial biogenesis process a step beyond transcription, or an alteration in the mitochondrial protein import process. Because OPA1 plays an important role in the fusion–fission mechanisms that are involved in the morphological remodelling of mitochondria during biogenesis, a defect in this process may lead to altered mitochondrial structure and mitochondrial protein degradation.
Surprisingly initially, electron microscopic examination of the fast skeletal muscle revealed mitochondria with irregular sizes, especially after training, and a significant increase in mean mitochondrial size in Opa1+/− mice which was exacerbated after training. This observation is reminiscent of cardiac cells, in which OPA1 deficiency also led to the accumulation of larger mitochondria with multiple inner membranes (Piquereau et al. 2012). It is also consistent with other studies showing that while Mfn2 knock-out mice exhibit mitochondrial fragmentation in neonatal cardiomyocytes, the opposite result, i.e. larger mitochondria, was observed in adult myocardium (Papanicolaou et al. 2011). It was thus proposed that, in the constrained environment of striated muscle, a deficit in OPA1 caused by impairing fusion of inner mitochondrial membranes, would compromise further fission mechanisms. Some mitochondria were devoid of cristae and matrix and this was accompanied by formation of irregular vacuoles, suggesting mitochondrial damage. It has already been shown that OPA1-null cells have severe ultrastructural defects in the mitochondria, including swollen mitochondria and defects in cristae organization, such as concentric inner membranes, which were attributed to the role of OPA1 in cristae maintenance (Olichon et al. 2003; Song et al. 2009; Agier et al. 2012). Thus, OPA1 deficiency could impair the normal process of mitochondrial fission during biogenesis and induce defective mitochondria leading to the release of mitochondrial proteins and their degradation. Therefore, for adequate mitochondrial biogenesis to occur, both correct activation of signalling pathways at transcriptional level and optimal remodelling of mitochondria are required. A deficiency of mitochondrial dynamics proteins such as OPA1 can alter mitochondrial morphological remodelling and lead to incomplete mitochondrial biogenesis.
OPA1 deficiency, exercise performance and metabolic remodelling
Surprisingly, mice lacking OPA1 had increased endurance performances after training, despite defective mitochondrial biogenesis. During exercise, muscle contraction induces an increase in ATP requirement. Carbohydrates and lipids are the primary substrates oxidized to generate the ATP required to sustain muscle contraction. It has long been recognized that endurance capacity depends on mitochondrial content as well as on the use of fatty acids, which provide a high quantity of energy for moderate exercise intensity over prolonged period of time (Holloszy, 1975). While training did not induce an increase in maximal oxidative capacity in the presence of pyruvate and fatty acids in Opa1+/+, maximal respiration was significantly increased in Opa1+/− mice. This was mainly due to an increase in the capacity of fast skeletal muscle to oxidize fatty acids. Long chain fatty acid oxidation capacity depends on fatty acid delivery to the muscle and on mitochondrial capacity for their transport and oxidation. This involves both transcriptional and post-translational regulations (for review see Holloway et al. 2008). It was recently shown that alteration of fatty acid transport in CD36 knock-out mice is sufficient to decrease the endurance time of mice independently of mitochondrial biogenesis and mitochondrial content (McFarlan et al. 2012). Conversely, we found an increased endurance time in Opa1+/− mice that coincided with increased mitochondrial fatty acid utilization, and increased CD36 expression. Interestingly, there was an increase in CPT2, a fatty acid transport protein of the inner mitochondrial membrane, but not in CPT1, a transport protein of the outer membrane, in trained Opa1+/− mice compared to trained Opa1+/+ mice (P < 0.001). This suggests a possible link between OPA1 and CPT2 in the inner mitochondrial membrane. However, adaptation in other metabolic steps and acute regulation of FA utilization could also affect the increased endurance capacity of Opa1+/− mice. Measurement of increased fatty acid utilization in fast skeletal muscle of Opa1 mutants at rest or during exercise should be further explored to gain more insight into adaptive changes in Opa1+/− trained fast skeletal muscle.
In conclusion, OPA1 deficiency is not sufficient by itself to alter exercise capacity in mice. OPA1 appears to be important for mitochondrial biogenesis, especially during endurance training. Impairment of mitochondrial biogenesis in Opa1+/− mice was compensated by the indirect activation of an adaptive pathway leading to better utilization of the fatty acids affecting increasing endurance performance. Such remodelling does not appear to be deleterious in physiological situations, but could be detrimental in situations of disease states or increased workload.
Acknowledgments
We thank Dr R. Fischmeister for continuous support. We thank Valérie Domergue-Dupont and the animal core facility of IFR141 for efficient handling and preparation of the animals and Ladislav Novota for the help with electron microscopy studies. We also thank A Lombes for her help with mtDNA quantification. We are grateful to Bernd Wissinger (Genetics Laboratory, Institute for Ophthalmic Research, Centre for Ophthalmology, University of Tübingen, Germany) for sharing the Opa1+/− mouse line and to Carina Pripp-Buus (Institut Cochin France) for sharing CPT2 antibody. We finally thank James Wilding for careful reading of the manuscript.
Glossary
Abbreviations
- ADOA
autosomal dominant optic atrophy
- AK
adenylate kinase
- CK
creatine kinase
- CS
citrate synthase
- DRP1
dynamin-related protein 1
- FA
fatty acids
- FIS1
fission protein 1
- LDH
lactate dehydrogenase
- MAS
maximal aerobic speed
- MFN
mitofusin
- mtDNA
mitochondrial DNA
- OPA1
optic atrophy-1
- PGC-1
peroxisome proliferator activated receptor gamma co-activator 1
- RNAm
muscle RNA
- RT-qPCR
real-time quantitative PCR
Additional information
Competing interests
None declared.
Author contributions
Conception and design of experiments: F.C., A.P., J.P., M.N., D.D.J., A.G., D.F., R.V.C. and F.J. Collection, analysis and interpretation of data: F.C., A.P., J.P., M.N., D.D.J., A.G., D.F., V.V., R.V.C. and F.J. Drafting the paper and critical revision for important intellectual content: F.C., A.P., J.P., M.N., D.D.J., M.A., V.V., R.V.C. and F.J. All authors have read and approved the final version of the manuscript. Electron microscopy examinations were performed at Institute of Molecular Physiology & Genetics. Behavior tests, voluntary and forced activities were conducted at IFR 141. All other work was done at INSERM, U-769.
Funding
This work was supported by a PhD grant from Region Ile de France to F.C., a VEGA project 2/0116/12 and APVV SK-FR-0021–11 to M.N., a French/Slovak grant Stefanik 17948XC, and Laboratory of Excellence LERMIT. R.V.C. and F.J. are scientists at the Centre National de la Recherche Scientifique.
References
- Adhihetty PJ, Irrcher I, Joseph AM, Ljubicic V, Hood DA. Plasticity of skeletal muscle mitochondria in response to contractile activity. Exp Physiol. 2003;88:99–107. doi: 10.1113/eph8802505. [DOI] [PubMed] [Google Scholar]
- Agier V, Oliviero P, Laine J, L’Hermitte-Stead C, Girard S, Fillaut S, Jardel C, Bouillaud F, Bulteau AL, Lombes A. Defective mitochondrial fusion, altered respiratory function, and distorted cristae structure in skin fibroblasts with heterozygous OPA1 mutations. Biochim Biophys Acta. 2012;1822:1570–1580. doi: 10.1016/j.bbadis.2012.07.002. [DOI] [PubMed] [Google Scholar]
- Alavi MV, Bette S, Schimpf S, Schuettauf F, Schraermeyer U, Wehrl HF, Ruttiger L, Beck SC, Tonagel F, Pichler BJ, Knipper M, Peters T, Laufs J, Wissinger B. A splice site mutation in the murine Opa1 gene features pathology of autosomal dominant optic atrophy. Brain. 2007;130:1029–1042. doi: 10.1093/brain/awm005. [DOI] [PubMed] [Google Scholar]
- Alavi MV, Fuhrmann N, Nguyen HP, Yu-Wai-Man P, Heiduschka P, Chinnery PF, Wissinger B. Subtle neurological and metabolic abnormalities in an Opa1 mouse model of autosomal dominant optic atrophy. Exp Neurol. 2009;220:404–409. doi: 10.1016/j.expneurol.2009.09.026. [DOI] [PubMed] [Google Scholar]
- Amati-Bonneau P, Valentino ML, Reynier P, Gallardo ME, Bornstein B, Boissiere A, Campos Y, Rivera H, de la Aleja JG, Carroccia R, Iommarini L, Labauge P, Figarella-Branger D, Marcorelles P, Furby A, Beauvais K, Letournel F, Liguori R, La Morgia C, Montagna P, Liguori M, Zanna C, Rugolo M, Cossarizza A, Wissinger B, Verny C, Schwarzenbacher R, Martin MA, Arenas J, Ayuso C, Garesse R, Lenaers G, Bonneau D, Carelli V. OPA1 mutations induce mitochondrial DNA instability and optic atrophy ‘plus’ phenotypes. Brain. 2008;131:338–351. doi: 10.1093/brain/awm298. [DOI] [PubMed] [Google Scholar]
- Arany Z, Foo SY, Ma Y, Ruas JL, Bommi-Reddy A, Girnun G, Cooper M, Laznik D, Chinsomboon J, Rangwala SM, Baek KH, Rosenzweig A, Spiegelman BM. HIF-independent regulation of VEGF and angiogenesis by the transcriptional coactivator PGC-1alpha. Nature. 2008;451:1008–1012. doi: 10.1038/nature06613. [DOI] [PubMed] [Google Scholar]
- Bo H, Zhang Y, Ji LL. Redefining the role of mitochondria in exercise: a dynamic remodeling. Ann N Y Acad Sci. 2010;1201:121–128. doi: 10.1111/j.1749-6632.2010.05618.x. [DOI] [PubMed] [Google Scholar]
- Cartoni R, Léger B, Hock MB, Praz M, Crettenand A, Pich S, Ziltener JL, Luthi F, Dériaz O, Zorzano A, Gobelet C, Kralli A, Russell AP. Mitofusins 1/2 and ERRalpha expression are increased in human skeletal muscle after physical exercise. J Physiol. 2005;567:349–358. doi: 10.1113/jphysiol.2005.092031. [DOI] [PMC free article] [PubMed] [Google Scholar]
- Chan DC. Mitochondria: dynamic organelles in disease, aging, and development. Cell. 2006;125:1241–1252. doi: 10.1016/j.cell.2006.06.010. [DOI] [PubMed] [Google Scholar]
- Chen H, Chan DC. Emerging functions of mammalian mitochondrial fusion and fission. Hum Mol Genet. 2005;14:R283–R289. doi: 10.1093/hmg/ddi270. [DOI] [PubMed] [Google Scholar]
- Chen H, Chomyn A, Chan DC. Disruption of fusion results in mitochondrial heterogeneity and dysfunction. J Biol Chem. 2005;280:26185–26192. doi: 10.1074/jbc.M503062200. [DOI] [PubMed] [Google Scholar]
- David DJ, Samuels BA, Rainer Q, Wang JW, Marsteller D, Mendez I, Drew M, Craig DA, Guiard BP, Guilloux JP, Artymyshyn RP, Gardier AM, Gerald C, Antonijevic IA, Leonardo ED, Hen R. Neurogenesis-dependent and -independent effects of fluoxetine in an animal model of anxiety/depression. Neuron. 2009;62:479–493. doi: 10.1016/j.neuron.2009.04.017. [DOI] [PMC free article] [PubMed] [Google Scholar]
- Dimmock D, Tang LY, Schmitt ES, Wong LJ. Quantitative evaluation of the mitochondrial DNA depletion syndrome. Clin Chem. 2010;56:1119–1127. doi: 10.1373/clinchem.2009.141549. [DOI] [PubMed] [Google Scholar]
- Dulawa SC, Holick KA, Gundersen B, Hen R. Effects of chronic fluoxetine in animal models of anxiety and depression. Neuropsychopharmacology. 2004;29:1321–1330. doi: 10.1038/sj.npp.1300433. [DOI] [PubMed] [Google Scholar]
- Duvezin-Caubet S, Jagasia R, Wagener J, Hofmann S, Trifunovic A, Hansson A, Chomyn A, Bauer MF, Attardi G, Larsson NG, Neupert W, Reichert AS. Proteolytic processing of OPA1 links mitochondrial dysfunction to alterations in mitochondrial morphology. J Biol Chem. 2006;281:37972–37979. doi: 10.1074/jbc.M606059200. [DOI] [PubMed] [Google Scholar]
- Elachouri G, Vidoni S, Zanna C, Pattyn A, Boukhaddaoui H, Gaget K, Yu-Wai-Man P, Gasparre G, Sarzi E, Delettre C, Olichon A, Loiseau D, Reynier P, Chinnery PF, Rotig A, Carelli V, Hamel CP, Rugolo M, Lenaers G. OPA1 links human mitochondrial genome maintenance to mtDNA replication and distribution. Genome Res. 2011;21:12–20. doi: 10.1101/gr.108696.110. [DOI] [PMC free article] [PubMed] [Google Scholar]
- Frezza C, Cipolat S, Martins de Brito O, Micaroni M, Beznoussenko GV, Rudka T, Bartoli D, Polishuck RS, Danial NN, De Strooper B, Scorrano L. OPA1 controls apoptotic cristae remodeling independently from mitochondrial fusion. Cell. 2006;126:177–189. doi: 10.1016/j.cell.2006.06.025. [DOI] [PubMed] [Google Scholar]
- Garnier A, Fortin D, Zoll J, N’Guessan B, Mettauer B, Lampert E, Veksler V, Ventura-Clapier R. Coordinated changes in mitochondrial function and biogenesis in healthy and diseased human skeletal muscle. FASEB J. 2005;19:43–52. doi: 10.1096/fj.04-2173com. [DOI] [PubMed] [Google Scholar]
- Habouzit E, Richard H, Sanchez H, Koulmann N, Serrurier B, Monnet R, Ventura-Clapier R, Bigard X. Decreased muscle ACE activity enhances functional response to endurance training in rats, without change in muscle oxidative capacity or contractile phenotype. J Appl Physiol. 2009;107:346–353. doi: 10.1152/japplphysiol.91443.2008. [DOI] [PubMed] [Google Scholar]
- Holloszy JO. Adaptation of skeletal muscle to endurance exercise. Med Sci Sports. 1975;7:155–164. [PubMed] [Google Scholar]
- Holloway GP, Luiken JJ, Glatz JF, Spriet LL, Bonen A. Contribution of FAT/CD36 to the regulation of skeletal muscle fatty acid oxidation: an overview. Acta Physiol (Oxf) 2008;194:293–309. doi: 10.1111/j.1748-1716.2008.01878.x. [DOI] [PubMed] [Google Scholar]
- Hudson G, Amati-Bonneau P, Blakely EL, Stewart JD, He L, Schaefer AM, Griffiths PG, Ahlqvist K, Suomalainen A, Reynier P, McFarland R, Turnbull DM, Chinnery PF, Taylor RW. Mutation of OPA1 causes dominant optic atrophy with external ophthalmoplegia, ataxia, deafness and multiple mitochondrial DNA deletions: a novel disorder of mtDNA maintenance. Brain. 2008;131:329–337. doi: 10.1093/brain/awm272. [DOI] [PubMed] [Google Scholar]
- Iqbal S, Ostojic O, Singh K, Joseph AM, Hood DA. Expression of mitochondrial fission and fusion regulatory proteins in skeletal muscle during chronic use and disuse. Muscle Nerve. 2013 doi: 10.1002/mus.23838. DOI: 10.1002/mus.23838. [DOI] [PubMed] [Google Scholar]
- Kuznetsov AV, Veksler V, Gellerich FN, Saks V, Margreiter R, Kunz WS. Analysis of mitochondrial function in situ in permeabilized muscle fibers, tissues and cells. Nat Protoc. 2008;3:965–976. doi: 10.1038/nprot.2008.61. [DOI] [PubMed] [Google Scholar]
- Lin J, Wu H, Tarr PT, Zhang CY, Wu Z, Boss O, Michael LF, Puigserver P, Isotani E, Olson EN, Lowell BB, Bassel-Duby R, Spiegelman BM. Transcriptional co-activator PGC-1 alpha drives the formation of slow-twitch muscle fibres. Nature. 2002;418:797–801. doi: 10.1038/nature00904. [DOI] [PubMed] [Google Scholar]
- Lira A, Zhou M, Castanon N, Ansorge MS, Gordon JA, Francis JH, Bradley-Moore M, Lira J, Underwood MD, Arango V, Kung HF, Hofer MA, Hen R, Gingrich JA. Altered depression-related behaviors and functional changes in the dorsal raphe nucleus of serotonin transporter-deficient mice. Biol Psychiatry. 2003;54:960–971. doi: 10.1016/s0006-3223(03)00696-6. [DOI] [PubMed] [Google Scholar]
- Lodi R, Tonon C, Valentino ML, Iotti S, Clementi V, Malucelli E, Barboni P, Longanesi L, Schimpf S, Wissinger B, Baruzzi A, Barbiroli B, Carelli V. Deficit of in vivo mitochondrial ATP production in OPA1-related dominant optic atrophy. Ann Neurol. 2004;56:719–723. doi: 10.1002/ana.20278. [DOI] [PubMed] [Google Scholar]
- Lodi R, Tonon C, Valentino ML, Manners D, Testa C, Malucelli E, La Morgia C, Barboni P, Carbonelli M, Schimpf S, Wissinger B, Zeviani M, Baruzzi A, Liguori R, Barbiroli B, Carelli V. Defective mitochondrial adenosine triphosphate production in skeletal muscle from patients with dominant optic atrophy due to OPA1 mutations. Arch Neurol. 2011;68:67–73. doi: 10.1001/archneurol.2010.228. [DOI] [PubMed] [Google Scholar]
- McFarlan JT, Yoshida Y, Jain SS, Han XX, Snook LA, Lally J, Smith BK, Glatz JF, Luiken JJ, Sayer RA, Tupling AR, Chabowski A, Holloway GP, Bonen A. In vivo, fatty acid translocase (CD36) critically regulates skeletal muscle fuel selection, exercise performance, and training-induced adaptation of fatty acid oxidation. J Biol Chem. 2012;287:23502–23516. doi: 10.1074/jbc.M111.315358. [DOI] [PMC free article] [PubMed] [Google Scholar]
- Mayorga AJ, Dalvi A, Page ME, Zimov-Levinson S, Hen R, Lucki I. Antidepressant-like behavioral effects in 5-hydroxytryptamine1A and 5-hydroxytryptamine1B receptor mutant mice. J Pharmacol Exp Ther. 2001;298:1101–1107. [PubMed] [Google Scholar]
- Minasyan A, Keisala T, Zou J, Zhang Y, Toppila E, Syvala H, Lou YR, Kalueff AV, Pyykko I, Tuohimaa P. Vestibular dysfunction in vitamin D receptor mutant mice. J Steroid Biochem Mol Biol. 2009;114:161–166. doi: 10.1016/j.jsbmb.2009.01.020. [DOI] [PubMed] [Google Scholar]
- Momken I, Lechene P, Koulmann N, Fortin D, Mateo P, Doan BT, Hoerter J, Bigard X, Veksler V, Ventura-Clapier R. Impaired voluntary running capacity of creatine kinase-deficient mice. J Physiol. 2005;565:951–964. doi: 10.1113/jphysiol.2005.086397. [DOI] [PMC free article] [PubMed] [Google Scholar]
- Momken I, Lechene P, Ventura-Clapier R, Veksler V. Voluntary physical activity alterations in endothelial nitric oxide synthase knockout mice. Am J Physiol Heart Circ Physiol. 2004;287:H914–H920. doi: 10.1152/ajpheart.00651.2003. [DOI] [PubMed] [Google Scholar]
- Novotova M, Pavlovicova M, Veksler V, Ventura-Clapier R, Zahradnik I. Ultrastructural remodeling of fast skeletal muscle fibers induced by invalidation of creatine kinase. Am J Physiol Cell Physiol. 2006;291:C1279–C1285. doi: 10.1152/ajpcell.00114.2006. [DOI] [PubMed] [Google Scholar]
- Olichon A, Baricault L, Gas N, Guillou E, Valette A, Belenguer P, Lenaers G. Loss of OPA1 perturbates the mitochondrial inner membrane structure and integrity, leading to cytochrome c release and apoptosis. J Biol Chem. 2003;278:7743–7746. doi: 10.1074/jbc.C200677200. [DOI] [PubMed] [Google Scholar]
- Olichon A, Emorine LJ, Descoins E, Pelloquin L, Brichese L, Gas N, Guillou E, Delettre C, Valette A, Hamel CP, Ducommun B, Lenaers G, Belenguer P. The human dynamin-related protein OPA1 is anchored to the mitochondrial inner membrane facing the inter-membrane space. FEBS Lett. 2002;523:171–176. doi: 10.1016/s0014-5793(02)02985-x. [DOI] [PubMed] [Google Scholar]
- Olichon A, Guillou E, Delettre C, Landes T, Arnaune-Pelloquin L, Emorine LJ, Mils V, Daloyau M, Hamel C, Amati-Bonneau P, Bonneau D, Reynier P, Lenaers G, Belenguer P. Mitochondrial dynamics and disease, OPA1. Biochim Biophys Acta. 2006;1763:500–509. doi: 10.1016/j.bbamcr.2006.04.003. [DOI] [PubMed] [Google Scholar]
- Olichon A, Landes T, Arnaune-Pelloquin L, Emorine LJ, Mils V, Guichet A, Delettre C, Hamel C, Amati-Bonneau P, Bonneau D, Reynier P, Lenaers G, Belenguer P. Effects of OPA1 mutations on mitochondrial morphology and apoptosis: relevance to ADOA pathogenesis. J Cell Physiol. 2007;211:423–430. doi: 10.1002/jcp.20950. [DOI] [PubMed] [Google Scholar]
- Papanicolaou KN, Khairallah RJ, Ngoh GA, Chikando A, Luptak I, O'Shea KM, Riley DD, Lugus JJ, Colucci WS, Lederer WJ, Stanley WC, Walsh K. Mitofusin-2 maintains mitochondrial structure and contributes to stress-induced permeability transition in cardiac myocytes. Mol Cell Biol. 2011;31:1309–1328. doi: 10.1128/MCB.00911-10. [DOI] [PMC free article] [PubMed] [Google Scholar]
- Piquereau J, Caffin F, Novotova M, Prola A, Garnier A, Mateo P, Fortin D, Huynh le H, Nicolas V, Alavi MV, Brenner C, Ventura-Clapier R, Veksler V, Joubert F. Down-regulation of OPA1 alters mouse mitochondrial morphology, PTP function, and cardiac adaptation to pressure overload. Cardiovasc Res. 2012;94:408–417. doi: 10.1093/cvr/cvs117. [DOI] [PMC free article] [PubMed] [Google Scholar]
- Piquereau J, Novotova M, Fortin D, Garnier A, Ventura-Clapier R, Veksler V, Joubert F. Postnatal development of mouse heart: formation of energetic microdomains. J Physiol. 2010;588:2443–2454. doi: 10.1113/jphysiol.2010.189670. [DOI] [PMC free article] [PubMed] [Google Scholar]
- Ramboz S, Oosting R, Amara DA, Kung HF, Blier P, Mendelsohn M, Mann JJ, Brunner D, Hen R. Serotonin receptor 1A knockout: an animal model of anxiety-related disorder. Proc Natl Acad Sci U S A. 1998;95:14476–14481. doi: 10.1073/pnas.95.24.14476. [DOI] [PMC free article] [PubMed] [Google Scholar]
- Shahrestani P, Leung HT, Le PK, Pak WL, Tse S, Ocorr K, Huang T. Heterozygous mutation of Drosophila Opa1 causes the development of multiple organ abnormalities in an age-dependent and organ-specific manner. PLoS One. 2009;4:e6867. doi: 10.1371/journal.pone.0006867. [DOI] [PMC free article] [PubMed] [Google Scholar]
- Song Z, Ghochani M, McCaffery JM, Frey TG, Chan DC. Mitofusins and OPA1 mediate sequential steps in mitochondrial membrane fusion. Mol Biol Cell. 2009;20:3525–3532. doi: 10.1091/mbc.E09-03-0252. [DOI] [PMC free article] [PubMed] [Google Scholar]
- Stemmelin J, Cohen C, Terranova JP, Lopez-Grancha M, Pichat P, Bergis O, Decobert M, Santucci V, Francon D, Alonso R, Stahl SM, Keane P, Avenet P, Scatton B, le Fur G, Griebel G. Stimulation of the beta3-Adrenoceptor as a novel treatment strategy for anxiety and depressive disorders. Neuropsychopharmacology. 2008;33:574–587. doi: 10.1038/sj.npp.1301424. [DOI] [PubMed] [Google Scholar]
- Suen DF, Norris KL, Youle RJ. Mitochondrial dynamics and apoptosis. Genes Dev. 2008;22:1577–1590. doi: 10.1101/gad.1658508. [DOI] [PMC free article] [PubMed] [Google Scholar]
- Ventura-Clapier R, Garnier A, Veksler V. Transcriptional control of mitochondrial biogenesis. The central role of PGC-1α. Cardiovasc Res. 2008;79:208–217. doi: 10.1093/cvr/cvn098. [DOI] [PubMed] [Google Scholar]
- Wu Z, Puigserver P, Andersson U, Zhang C, Adelmant G, Mootha V, Troy A, Cinti S, Lowell B, Scarpulla RC, Spiegelman BM. Mechanisms controlling mitochondrial biogenesis and respiration through the thermogenic coactivator PGC-1. Cell. 1999;98:115–124. doi: 10.1016/S0092-8674(00)80611-X. [DOI] [PubMed] [Google Scholar]
- Yu-Wai-Man P, Griffiths PG, Gorman GS, Lourenco CM, Wright AF, Auer-Grumbach M, Toscano A, Musumeci O, Valentino ML, Caporali L, Lamperti C, Tallaksen CM, Duffey P, Miller J, Whittaker RG, Baker MR, Jackson MJ, Clarke MP, Dhillon B, Czermin B, Stewart JD, Hudson G, Reynier P, Bonneau D, Marques W, Jr, Lenaers G, McFarland R, Taylor RW, Turnbull DM, Votruba M, Zeviani M, Carelli V, Bindoff LA, Horvath R, Amati-Bonneau P, Chinnery PF. Multi-system neurological disease is common in patients with OPA1 mutations. Brain. 2010a;133:771–786. doi: 10.1093/brain/awq007. [DOI] [PMC free article] [PubMed] [Google Scholar]
- Yu-Wai-Man P, Sitarz KS, Samuels DC, Griffiths PG, Reeve AK, Bindoff LA, Horvath R, Chinnery PF. OPA1 mutations cause cytochrome c oxidase deficiency due to loss of wild-type mtDNA molecules. Hum Mol Genet. 2010b;19:3043–3052. doi: 10.1093/hmg/ddq209. [DOI] [PMC free article] [PubMed] [Google Scholar]