

Abstract
The relationship between sarcoplasmic reticulum (SR) Ca2+ content and calsequestrin (CSQ) isoforms was investigated in human skeletal muscle. A fibre-lysing assay was used to quantify the endogenous Ca2+ content and maximal Ca2+ capacity of the SR in skinned segments of type I and type II fibres from vastus lateralis muscles of young healthy adults. Western blotting of individual fibres showed the great majority contained either all fast or all slow isoforms of myosin heavy chain (MHC), troponins C and I, tropomyosin and SERCA, and that the strontium sensitivity of the force response was closely indicative of the troponin C isoform present. The endogenous SR Ca2+ content was slightly lower in type I compared to type II fibres (0.76 ± 0.03 and 0.85 ± 0.02 mmol Ca2+ per litre of fibre, respectively), with virtually all of this Ca2+ evidently being in the SR, as it could be rapidly released with a caffeine-low [Mg2+] solution (only 0.08 ± 0.01 and <0.07 mmol l−1, respectively, remaining). The maximal Ca2+ content that could be reached with SR Ca2+ loading was 1.45 ± 0.04 and 1.79 ± 0.03 mmol l−1 in type I and type II fibres, respectively (P < 0.05). In non-lysed skinned fibres, where the SR remained functional, repeated cycles of caffeine-induced Ca2+ release and subsequent Ca2+ reloading similarly indicated that (i) maximal SR Ca2+ content was lower in type I fibres than in type II fibres (P < 0.05), and (ii) the endogenous Ca2+ content represented a greater percentage of maximal content in type I fibres compared to type II fibres (∼59% and 41%, respectively, P < 0.05). Type II fibres were found on average to contain ∼3–fold more CSQ1 and ∼5–fold less CSQ2 than type I fibres (P < 0.001). The findings are consistent with the SR Ca2+ content characteristics in human type II fibres being primarily determined by the CSQ1 abundance, and in type I fibres by the combined amounts of both CSQ1 and CSQ2.
Key points
Ca2+ release from the sarcoplasmic reticulum (SR) controls contraction in vertebrate skeletal muscle. Calsequestrin (CSQ) is thought to be the principal Ca2+ binding protein in the SR but little is known about SR Ca2+ content and loading characteristics, or CSQ isoform distribution, in human skeletal muscle fibres.
Type I (slow-twitch) and type II (fast-twitch) skeletal muscle fibres in young healthy adults show highly-stereotyped patterns of isoform expression of CSQ and SR Ca2+ pumps, in tight correspondence with isoform expression of the contractile proteins, which probably facilitates optimal contractile function in the individual fibre types.
Endogenous Ca2+ content of the SR is slightly larger in type II fibres than in type I fibres, but its maximal capacity is substantially greater, probably due to the larger amount of the CSQ1 isoform present. SR Ca2+ content and capacity in type I fibres is probably determined by their content of both CSQ1 and CSQ2.
Introduction
Contraction of mammalian skeletal muscle is regulated by the intracellular Ca2+ level (Ebashi et al. 1969; Gordon et al. 2000). In the resting state, most cellular Ca2+ is stored within the sarcoplasmic reticulum (SR; Somlyo et al. 1981; Berchtold et al. 2000), bound in large part to high-capacity, low-affinity Ca2+-binding proteins, in particular calsequestrin (CSQ; MacLennan & Wong, 1971; Beard et al. 2004; Park et al. 2004; Rossi & Dirksen, 2006; Murphy et al. 2009a). Two isoforms of calsequestrin are found in mammalian skeletal muscle, calsequestrin–1 (CSQ1) and calsequestrin–2 (CSQ2); in rabbit, rat and mouse, type II fibres contain predominantly or exclusively the CSQ1 isoform, and type I fibres contain appreciable amounts of both CSQ1 and CSQ2 (Damiani et al. 1990; Paolini et al. 2007; Murphy et al. 2009a).
The absolute Ca2+ content of individual fibres from rat skeletal muscle has been measured for different SR load states, using a fibre-lysing technique (Fryer & Stephenson, 1996; Owen et al. 1997). When the SR of the skinned fibres was loaded at close to its normal endogenous state, the total fibre Ca2+ content was ∼1.3 mmol per litre fibre volume both in type I fibres from soleus muscle and type II fibres from extensor digitorum longus (EDL) muscle, of which all but ∼0.25 mmol l−1 could be released by exposing the skinned fibre to a caffeine-low Mg2+ release solution or by repeated depolarizations (Fryer & Stephenson, 1996; Owen et al. 1997). The maximal Ca2+ content level reached following maximal loading of the SR, however, was found to be far lower in the type I fibres (∼1.35 mmol l−1) than in the type II fibres (∼3.9 mmol l−1). It was subsequently shown that the maximal Ca2+ content levels in the two fibre types could each be accounted for by the absolute amounts of CSQ1 and CSQ2 present, ∼10 μmol l−1 CSQ1 and ∼5 μmol l−1 CSQ2 in soleus type I fibres and ∼36 μmol l−1 CSQ1 in EDL type II fibres (Murphy et al. 2009a).
Little is known, however, about the SR Ca2+ content and loading characteristics, or the CSQ isoform distribution, in human skeletal muscle fibres. The endogenous Ca2+ content in mixed fibre samples of vastus lateralis muscle of young adults was found by atomic absorption to be ∼0.7 mmol per litre fibre volume (Overgaard et al. 2004). Another study using chemically skinned fibres (of unspecified type) from human pectoralis muscle found that the total Ca2+ content reached after maximally loading the SR was only ∼0.8 mmol l−1 (Salviati et al. 1982), very much lower than seen in rat fibres. It remains unknown whether the endogenous SR Ca2+ content and maximal SR Ca2+ capacity differ between type I and type II fibres in human muscle, and how such Ca2+ content values relate to the CSQ isoforms present.
Here we use the fibre-lysing assay utilised previously with rat muscle fibres (Fryer & Stephenson, 1996; Owen et al. 1997) to measure the amount of Ca2+ present in individual type I and type II fibres from vastus lateralis muscle of young healthy human subjects. We assess not only the endogenous Ca2+ content but also the Ca2+ content present after maximally loading or fully depleting the SR. Further, we use western blotting to measure the relative amounts of CSQ1 and CSQ2 present in the fibres, as well as the isoform expression of sarco(endo)plasmic reticulum Ca2+-ATPase (SERCA), the SR Ca2+ pump, and also myosin heavy chain (MHC) and other key contractile proteins. It was hypothesized that (i) individual fibres from these young adult subjects would have highly stereotyped, fibre-specific isoform distribution patterns of both the SR and contractile proteins, because close coordination of SR and contractile properties would help optimize contractile function in each fibre type, (ii) there would be less disparity in the SR Ca2+ content characteristics between type I and type II fibres in humans compared to rat, as human muscle lacks the very fast type IIB fibres present in rat muscle, and (iii) the SR Ca2+ content characteristics of the human fibres would be explicable in terms of the relative amounts of the particular CSQ isoforms present.
Methods
Muscle biopsy, subject details and ethical approval
All protocols and procedures were approved by the Human Research Ethics Committees at Victoria University and La Trobe University. Informed consent was obtained in writing from all subjects and the studies conformed to the standards set by the Declaration of Helsinki. All the experiments on human skinned fibres were performed on fibres obtained from vastus lateralis muscle biopsies from 23 rested subjects, comprising sixteen males and seven females (age 24 ± 5 years; height, 173 ± 10 cm; body mass, 70 ± 11 kg; mean ± SD). All subjects were healthy and most participated in regular physical activity but were not specifically trained in any sport. After injection of a local anaesthetic (1% lidocaine (lignocaine)) into the skin and fascia, a small incision was made in the middle third of the vastus lateralis muscle of each subject and a muscle sample taken using a Bergstrom biopsy needle (McKenna et al. 2006). An experienced medical practitioner took all biopsies at approximately constant depth. The excised muscle sample was rapidly blotted on filter paper to remove excess blood and placed in paraffin oil (Ajax Chemicals, Sydney, Australia) at 10°C for 45 min before individual muscle fibres were dissected. The remaining muscle sample from the biopsies was frozen and stored in liquid nitrogen for later analyses.
Preparations and force recording
The muscle biopsy was pinned at resting length in a Petri dish containing paraffin oil (Ajax Chemicals, Sydney, Australia), and kept cool (∼10°C) on an icepack. As described previously (Murphy et al. 2009b; Dutka et al. 2012), individual fibre segments were mechanically skinned and mounted at 120% of resting length on a force transducer (AME801, SensoNor, Horten, Norway), and then placed in a Perspex bath containing 2 ml of the standard K+-based solution broadly mimicking the intracellular milieu (see below). Force responses were recorded using a Bioamp pod and Powerlab 4/20 series hardware (ADInstruments, Sydney, Australia). All experiments were performed at room temperature (∼23 ± 2°C).
Skinned fibre solutions
All chemicals were purchased from Sigma-Aldrich (St Louis, MO, USA) unless specified otherwise. The standard K-HDTA solution contained (in mm): hexa-methylene-diamine-tetraacetate (HDTA2−), 50 (Fluka, Buchs, Switzerland); total ATP, 8; Na+, 36; K+, 126; total Mg2+, 8.5 (giving 1 mm free [Mg2+]); creatine phosphate, 10; total EGTA, 0.05; Hepes, 90; pH 7.1 and pCa (−log10[Ca2+]) ∼7.2, except where stated. Free [Ca2+] for pCa < 7.3 was determined with a Ca2+-sensitive electrode (Orion Research, Boston, MA, USA). Where required, the SR of the skinned fibre was totally depleted of all releasable Ca2+ by exposure to the ‘full release solution’, which was similar to the K-HDTA solution but with 30 mm caffeine, 0.05 mm free Mg2+ (total Mg2+ of 2.1 mm) and 0.5 mm free EGTA (pCa 8.5) present to chelate released Ca2+. Where required, the SR was reloaded with Ca2+ by exposing the fibre for a set period (from 15 s to 3 min) to the load solution, which was the same as the standard K-HDTA solution but with the pCa buffered at 6.7 with 1 mm total CaEGTA–EGTA. Under these conditions, a 3 min load period was sufficient to load the SR to close to its maximum capacity.
When examining the properties of the contractile apparatus, it was necessary to use heavily Ca2+-buffered solutions in which all HDTA was replaced with EGTA (relaxing solution) or CaEGTA (maximum Ca2+-activating solution), as described previously (Lamb & Posterino, 2003). The relaxing solution had no added Ca2+ (pCa > 9) and the maximum Ca2+-activating solution (‘max’) had 49.5 mmol l−1 added Ca2+ (pCa 4.7), with total Mg2+ of 10.3 and 8.1 mm, respectively, to maintain the free [Mg2+] at 1 mm. These two solutions were mixed in appropriate ratios to produce solutions with pCa in the range 6.7–4.7. In addition, a strontium-based solution (at pSr 5.2) was made by mixing relaxing solution (50 mm EGTA) with Sr-EGTA solution similar to the maximum Ca2+-activating solution.
The solution used to pre-equilibrate fibres before lysing was similar to the standard K-HDTA solution but had no EGTA and instead had 0.025–1.8 mm BAPTA, added from a 47 mm BAPTA stock solution. The BAPTA stock solution was titrated with Ca2+ using a Ca2+-sensitive electrode (Orion Research, Boston, MA, USA) to establish the exact amount of BAPTA present. In some experiments 50 μm 2,5-di-tert-butyl-1,4-hydroquinone (TBQ) was present in both the full release solution and BAPTA pre-equilibration solution to block Ca2+ binding to SERCA pumps. TBQ was added from a freshly prepared 50 mm stock solution in DMSO.
Experimental protocol for quantifying total Ca2+ content in the fibre
The total amount of Ca2+ contained in a fibre after a given treatment can be quantified by pre-equilibrating the skinned fibre in a solution with a known concentration of the very fast calcium buffer BAPTA and then transferring the fibre to an emulsion of 10% Triton X-100 and paraffin oil (TX–oil) to lyse all membranous compartments and release any Ca2+ from within the fibre. This procedure has been described comprehensively elsewhere (Fryer & Stephenson, 1996; Owen et al. 1997). Briefly, the skinned fibre was first placed in the standard solution K-HDTA for 2 min to wash out all the diffusible Ca2+-binding proteins present endogenously in the cytoplasm. Then the fibre was pre-equilibrated for 20 s in a solution with a particular [BAPTA] before placing the fibre in a freshly triturated emulsion of Triton X-100 in paraffin oil (TX–oil) (10% v/v). The paraffin oil formed a closed compartment around the skinned fibre and the detergent lysed all intracellular membranes and liberated Ca2+ from intracellular stores. As a result, the released Ca2+ rapidly binds to the known amount of BAPTA within the fibre and to other sites, predominantly troponin C (TnC). If the pre-equilibrating [BAPTA] was chosen such that the fibre produced a finite, non-maximal force response upon lysis, then the total amount of Ca2+ present in the fibre could be calculated in absolute terms from the [BAPTA] in the equilibration solution and the magnitude of the force response (see ‘Calculation of Ca2+ release from lysing experiment’). To check that the peak force upon lysis had not reached maximum, the fibre was washed in relaxing solution and then activated in the maximum Ca2+-activation solution. Finally, the fibre was moved back into the TX–oil emulsion again to determine whether the maximum force produced was the same in the TX–oil environment as in free solution.
Other skinned fibre segments, prior to the TX–oil lysing, were (i) fully depleted of their endogenous SR Ca2+ content by a 1 min exposure to the full release solution, or (ii) loaded to their maximal SR Ca2+ capacity by a 4 min exposure to standard load solution (pCa 6.7, buffered with 1 mm total EGTA; see ‘Skinned fibre solutions’).
Calculation of Ca2+ release from lysing experiment
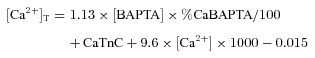
The total Ca2+ content within the fibre at the time of lysis ([Ca2+]T), expressed in millimoles per litre total fibre volume (in keeping with previous studies: Fryer & Stephenson, 1996; Owen et al. 1997), could be calculated as the sum of (i) the Ca2+ bound to BAPTA, (ii) the Ca2+ bound to all other high affinity binding sites in the fibre (predominantly TnC), and (iii) the free Ca2+ in the myoplasm ([Ca2+]). As mentioned, prior to lysis all skinned fibres were bathed for 2 min in the standard K-HDTA solution to ensure all diffusible Ca2+ buffers had been washed out and would not affect the Ca2+ content estimate. Furthermore, this K-HDTA solution had very little contaminating Ca2+ and very weak Ca2+ buffering (0.05 mm total EGTA, pCa ∼7.2), so that the SR could not take up any substantial net amount of Ca2+ from the bathing solution but nevertheless could still readily recover most or all of any Ca2+ that leaked from the SR into the cytoplasmic space within the fibre. The total amount of Ca2+ within the fibre after various treatments was calculated as follows.
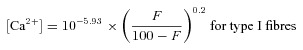
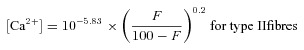
The cytoplasmic free Ca2+ concentration ([Ca2+], in molar units) prevailing in the fibre during the finite force response upon lysis was derived from the mean Hill curve describing the relationship between force and [Ca2+]:
 |
(1) |
 |
(2) |
where 5.93 and 5.83 are the average pCa50 (pCa at half-maximum force) of the contractile apparatus in human type I and type II skeletal muscle fibres, respectively, F is the percentage force elicited upon lysis and 0.2 is the reciprocal of the average Hill coefficient in human skeletal muscle fibres (see Results section).
(2) The effective [BAPTA] within the fibre (in mM) was taken as being 1.13 times the [BAPTA] of the pre-equilibration solution, to account for the swelling of the fibre when initially placed in solution, and also the fibre volume to which BAPTA is not accessible (i.e. that occupied by the SR, t-tubular system, and mitochondria etc. (Eisenberg, 1983; Owen et al. 1997).
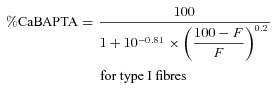
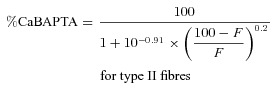
(3) The percentage of BAPTA with bound Ca2+ (%CaBAPTA) was determined from the percentage force, F, as follows:
 |
(3) |
 |
(4) |
where the exponents −0.81 and −0.91 are the difference between the negative logarithm of the apparent affinity constant of BAPTA for Ca2+ (6.74) (Harrison & Bers, 1987) and the pCa50 of the contractile apparatus in the respective fibre type (5.93 and 5.83; see Results and Owen et al. 1997; Posterino & Lamb, 2003).
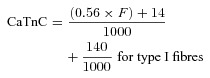
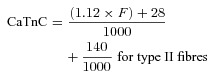
(4) The total possible increase in Ca2+ binding to TnC was taken here as 70 and 140 μmol l−1 binding to the Ca2+-specific sites in type I and type II fibres, respectively, and a further 140 μmol l−1 binding to the non-Ca2+-specific sites present in both (i.e. 1 or 2 Ca2+-specific sites and 2 non-specific sites per TnC molecule; Fryer & Stephenson, 1996). For experiments where a fibre was pre-equilibrated in [BAPTA] > 0.5 mm (and hence pCa > 8.3), the amount of Ca2+ binding to TnC (CaTnC) (in mmol l−1) as a function of force was calculated from the data of Fuchs (1985) and Robertson et al. (1981) as being:
 |
(5) |
 |
(6) |
which assumes (i) that the amount of Ca2+ bound to the specific sites on TnC rose in an approximately linear manner from 14 to 70 μmol l−1 for F in the range of 0–100% for type I fibres, and from 28 to 140 μmol l−1 for type II fibres, and (ii) that the non-specific sites on TnC had become fully occupied with Ca2+ at and above the force threshold. In cases where the [BAPTA] in the pre-equilibration solution was very low (∼0.025 mm), the pCa of the solution was ∼6.5, and so the non-specific sites on TnC were assumed to have bound Ca2+ already in the pre-equilibration solution before the lysing, and hence the final term in eqns (5) and (6) was omitted.
(5) Ca2+ binds to the ATP and HDTA present, and the total of these and the free [Ca2+] was estimated as being ∼9.6 ×[Ca2+] (Posterino & Lamb, 2003).
(6) Finally, 0.015 mmol l−1 was deducted from the total to take into account the contaminating Ca2+ present in the BAPTA pre-equilibration solution.
In summary, the total Ca2+ content within the fibre at the time of the lysis (expressed in millimoles per litre fibre volume) can be calculated as:
 |
(7) |
SR Ca2+ uptake properties of the fibre
As the muscle fibres were kept and skinned under paraffin oil, the SR initially retained its endogenous level of Ca2+. The procedure to assess the relative endogenous and maximal SR Ca2+ content has been described comprehensively elsewhere (Trinh & Lamb, 2006). Briefly, each skinned fibre segment was first bathed for 2 min in the standard K-HDTA solution to wash out all diffusible Ca2+ buffers present endogenously in the cytoplasm. The SR was then depleted of all of its releasable Ca2+ by exposing the fibre to the full release solution (see above). The fibre was then washed for 1 min in standard K-HDTA solution (with 0.5 mm free EGTA present to prevent any Ca2+ reuptake), and subjected to repeated load–release cycles as follows.
Step 1: Load SR for a set time (15–180 s) in standard load solution (pCa 6.7 with 1 mm total CaEGTA–EGTA).
Step 2: Pre-equilibrate skinned fibre for 15 s in K-HDTA solution with 0.5 mm free EGTA.
Step 3: Empty SR of all releasable Ca2+ by exposing fibre for 60 s to full release solution.
Step 4: Wash skinned fibre for 1 min in K-HDTA solution with 0.5 mm free EGTA.
The time integral (area) of the force response to the initial exposure to the full release solution was indicative of the endogenous SR Ca2+ content initially present in the fibre, and the responses to the subsequent exposures indicated the SR content for the respective load time (e.g. see Fig. 4). The relationship between the time integral of the force response and load time was well fitted by an exponential fit approaching saturation after ∼180 s (Fig. 4C). The parameters were adjusted (Fig. 4D) to take into account (1) the true maximum SR Ca2+ content, derived by extrapolation of the exponential fit to longer load times, and (2) the amount of SR Ca2+ that had to be released to elicit any detectable force in the presence of 0.5 mm EGTA, determined by back-extrapolation of the response area–load time curve to zero load time (Fig. 4C; see Murphy et al. 2009a).
Figure 4. Relative measurement of Ca2+ content and loading characteristics in human fibres.
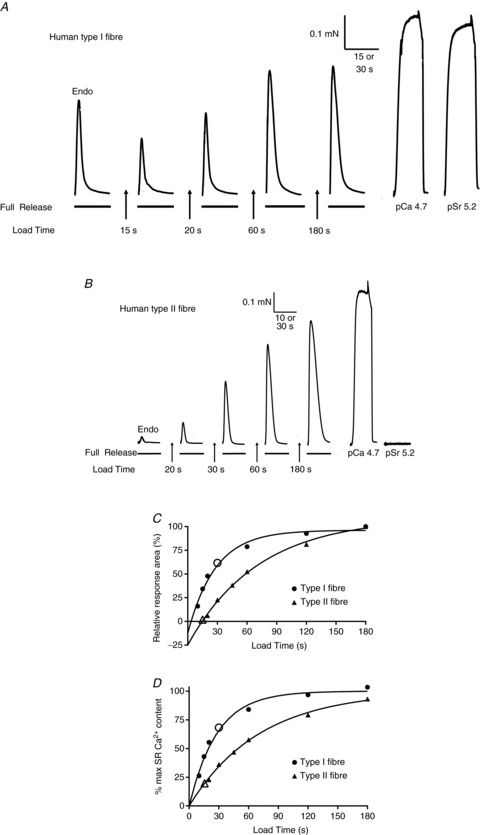
Representative force responses in a type I fibre (A) and a type II fibre (B) when emptying the SR of all releasable Ca2+ with the ‘full release solution’ (caffeine-low Mg2+ solution). First response (Endo) elicited by releasing the endogenous Ca2+ present in the SR at start of experiment. SR then reloaded to various levels by placing fibre in load solution for a set time (15–180 s) before again emptying the SR. Maximum force production ascertained by activation with pCa 4.7 solution. Response to pSr 5.2 solution indicative of predominant TnC isoform present (see text). Time scale: 10 or 15 s during SR Ca2+ release, and 30 s for maximum Ca2+-activated force and Sr2+-activated force. C, plot of time integral of force response versus load time for data in A and B. Each value expressed as percentage of that found for 180 s load. Data sets fitted with best-fit single exponential function. Open symbols on fitted functions indicate relative force–time integral found upon releasing the endogenous Ca2+ content. D, corrected data from C, adjusted for ordinate intercept (i.e. negative integral values indicated for zero load time, see text) and redefining 100% as the maximum found by extrapolation of the respective exponential fit. Such analysis indicates that the endogenous SR Ca2+ content relative to maximum SR capacity in these two fibres (open symbols) was ∼68% and 20% in the type I and type II fibres, respectively.
Contractile apparatus experiments
The force–Ca2+ relationship in type I and type II fibres was determined by exposing skinned fibre segments to a sequence of heavily buffered solutions at progressively higher free [Ca2+] (50 mm CaEGTA–EGTA, pCa > 9–4.7, the latter value eliciting maximum force). Isometric force responses produced at each [Ca2+] were expressed as a percentage of the corresponding maximum force and analysed by fitting a Hill curve using GraphPad Prism 4 software to ascertain the pCa50 (pCa at half-maximum force) and Hill coefficient (h) for each sequence.
Western blotting
Individual skinned fibre segments were placed in a small volume (10 μl) of 1x solubilizing buffer which contained 0.125 m Tris-HCl, 10% glycerol, 4% SDS, 4 m urea, 10% mercaptoethanol and ∼0.001% bromophenol blue (pH 6.8) diluted (2:1 v/v) with double distilled water. Fibres were stored at −80°C until analysed by western blotting. Total protein in the single fibres was separated on 4–15% Criterion Stain Free gels (Bio-Rad, Hercules, CA, USA), as previously described (Murphy, 2011). After appropriate washes and blocking, membranes were probed with the required primary antibody (see Table 1), being constantly rocked overnight at 4°C and for 2 h at room temperature (RT) and then incubated with the appropriate secondary antibody (2 h, RT). Chemiluminescent images were captured and densitometry performed using Chemidoc MP and ImageLab software (BioRad). For each fibre the density of the myosin heavy chain (MHC) band on the Stain Free gel was used as the measure of the relative amount of protein loaded. The densities of the CSQ bands in a given fibre were expressed relative to the MHC density for that fibre, and the resulting values then normalized to the mean obtained in all type I fibres (CSQ2) or in all type II fibres (CSQ1) run on that same gel, enabling subsequent amalgamation of data from different gels (Fig. 6). Fibre type was defined by the predominant MHC isoform present (e.g. Fig. 1B and related text), as detected with antibodies to MHC I or MHC II (Table 1). Every fibre in the present study was positive to MHC I or MHC II or both.
Table 1.
Antibody details
| Antibody | Catalogue no. and supplier | Dilution |
|---|---|---|
| Primary | ||
| Mouse monoclonal anti-CSQ1 (VIIID12) | Ab2824, Abcam | 1:2000 |
| Rabbit polyclonal anti-CSQ2 | Ab3516, Abcam | 1:1000 |
| Mouse monoclonal anti-myosin heavy chain I (MHC I) | A4.840, Developmental studies hybridoma bank (DSHB) | 1:200 |
| Mouse monoclonal anti-myosin heavy chain II (MHC II) | A4.74, DSHB | 1:200 |
| Mouse monoclonal anti- SERCA1 | CA F2-5D, 5 DSHB | 1:1000 |
| Mouse monoclonal anti-SERCA2a | A010-2, Badrilla | 1:5000 |
| Mouse monoclonal anti-tropomyosin | CH1, DSHB | 1:750 |
| Rabbit polyclonal anti-troponin I | 4002, Cell Signaling | 1:1000 |
| Rabbit polyclonal anti-troponin C | sc20642, Santa Cruz | 1:400 |
| Secondary | ||
| Goat anti-mouse IgG-horseradish peroxidase (HRP) | 31430, Pierce | 1:20,000 |
| Goat anti-rabbit IgG-HRP | 31460, Pierce | 1:20,000 |
| Goat anti-mouse IgM-HRP | 62 6820, Invitrogen | 1:20,000 |
Figure 6. Relative amounts of CSQ1 and CSQ2 in human type I and II skeletal muscle fibres.
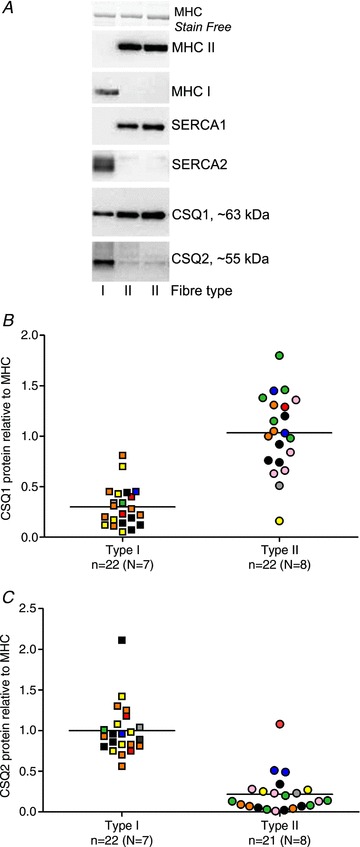
A, western blots of proteins in three individual fibres. B, relative amount of CSQ1 in individual fibres, normalized to mean of that found in the type II fibres (see Methods). C, relative amount of CSQ2 in individual fibres, normalized to mean of that found in the type I fibres. Number of fibres (n) and subjects (N) indicated for each case. A given colour represents same subject in both panels B and C. Significant difference between fibre types in both B and C (Mann–Whitney rank test).
Figure 1. Contractile properties and isoform expression in human skeletal muscle fibres.
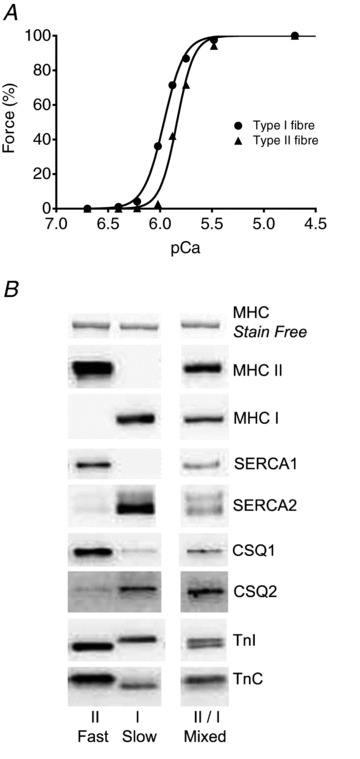
A, representative force–Ca2+ relationships in a type I (•) and a type II (▴) fibre from a vastus lateralis muscle biopsy from a young, healthy adult. pCa =−log10[Ca2+]. The best-fit Hill curves had pCa50 (pCa at half-maximum force) and h coefficient, respectively, of 5.96 and 4.4 for the type I fibre, and 5.84 and 5.3 for the type II fibre. B, western blotting of multiple proteins in a single fibre segment; representative examples shown of a type I fibre, a type II fibre, and a ‘mixed’ fibre, the latter being very uncommon in young, healthy adults (5 out of 153 fibres analysed). Type I fibres contained almost exclusively only ‘slow’ isoforms of contractile apparatus proteins (MHC, TnI, TnC) and SERCA pumps, type II fibres only ‘fast’ isoforms, and mixed fibres contained both slow and fast isoforms. MHC band density in Stain Free image (top) indicates relative amount of tissue loaded in given lane.
Statistics
Values are presented individually, or as mean ± SEM or mean ± SD as indicated, with n denoting the number of fibres examined and N the number of subjects. Statistical significance (P < 0.05) was determined with Student's t test or the non-parametric Mann–Whitney rank test as appropriate.
Results
Contractile apparatus properties and fibre type determination
The Ca2+ sensitivity of the contractile apparatus in human skinned muscle fibre segments was determined by directly activating the contractile apparatus in solutions with free [Ca2+] strongly buffered in the range pCa 6.7–4.7 (see Methods), and fitting the resulting force–pCa data with a Hill curve (e.g. Fig. 1A). In addition, the force response to a strontium-based solution at pSr 5.2 was also determined in each fibre (e.g. Fig. 2A). After completing all relevant force measurements, including any assessment of SR Ca2+ content and loading (see below), the fibre segment was placed in SDS and western blotting subsequently employed to determine the isoform profile and relative amounts of a range of contractile and SR proteins (e.g. Fig. 1B). In the great majority of fibres examined from the young healthy subjects (>95% of 153 fibres), the myosin heavy chain (MHC) isoform present was almost entirely either MHC I or MHC II, such fibres being defined as ‘type I’ and ‘type II’ respectively. The small number of remaining fibres contained appreciable amounts of both MHC I and MHC II, and were denoted as being ‘mixed’ fibres (e.g. Fig. 1B). In virtually every case, the type I fibres contained only the slow isoforms of TnC and TnI, the type II fibres contained only the fast isoforms, and the mixed fibres contained both the slow and fast isoforms of both troponins. A similar tight relationship between fibre type (i.e. MHC isoform) and TnC isoform has been reported in rat skeletal muscle (O’Connell et al. 2004). It was further found here that the human type II fibres containing solely the fast TnC isoform were much less sensitive to activation by Sr2+ than were the type I fibres containing solely the slow TnC isoform. In every case, type II fibres gave little or no force to a solution at pSr of 5.2 (<5% of maximum force), type I fibres gave >80% of maximum force (e.g. Figs 2A and 4), and mixed fibres gave an intermediate force response (10–70%), all in close accord with the Sr2+ responses found previously in rat fibres (Bortolotto et al. 2000).
Figure 2. Ca2+ content assay in human type II fibre segments in three different SR load states.
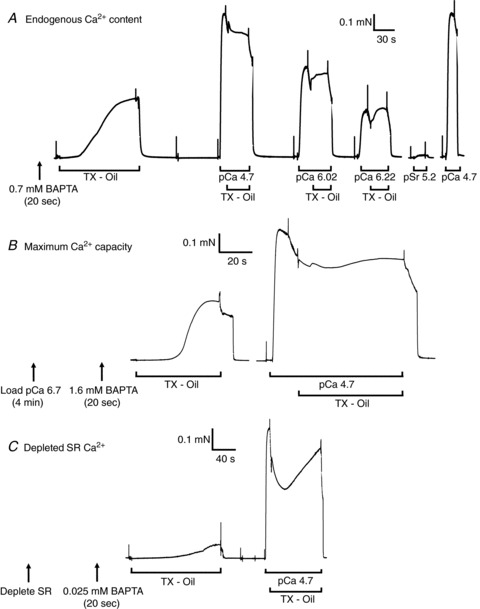
A, a skinned fibre segment with endogenous Ca2+ content was briefly equilibrated with 0.7 mm free BAPTA and when lysed in the Triton–paraffin oil emulsion (TX–Oil) produced ∼40% of maximal force. Fibre subsequently activated in aqueous solutions buffered at various pCa and each time again transferred to TX–oil to gauge its effect. Fibres washed in relaxing solution between solution changes. Fibre gave very little force to a Sr2+ solution at pSr 5.2. B, a skinned fibre segment in which the SR was maximally loaded (by 4 min in pCa 6.7 load solution) required equilibration with 1.6 mm BAPTA in order to yield a similar size force response when lysed in TX–oil. C, a skinned fibre segment that had been emptied of SR Ca2+ (by exposure to caffeine-low [Mg2+] solution) and then equilibrated in 0.025 mm BAPTA produced only a small force response upon lysis in TX–oil. Western blotting subsequently showed all segments were from type II fibres.
In the 40 type I fibres (from 12 subjects) in which the force–pCa relationship was determined, the mean pCa50 was 5.93 ± 0.01 pCa units, which was significantly higher (P < 0.05) than that found in the type II fibres examined (5.83 ± 0.01 pCa units in 30 type II fibres, obtained from 10 of the same subjects). The Hill coefficient (h) of the fits was not significantly different between the type I fibres (5.2 ± 0.2) and the type II fibres (5.1 ± 0.2). The difference in the pCa50 is only small, but nevertheless will substantially affect the responses of the individual muscle fibres. This is most clearly seen in the force–[Ca2+] relationship examples shown in Fig. 1A. It is apparent that the force produced at pCa 6 (i.e. 1 μm free Ca2+) is >40% of maximum in the type I fibre but <20% of maximum in the type II fibre. As the cytoplasmic [Ca2+] is tightly controlled in this range by Ca2+ binding and release from troponin C and Ca2+ binding and uptake by the SERCA, the precise Ca2+ dependence of the contractile apparatus will be critical for force production and relaxation.
Measurement of total Ca2+ content in muscle fibres
The method of assaying the total amount of Ca2+ contained in a fibre has been described in detail previously (Fryer & Stephenson, 1996; Owen et al. 1997; Dutka et al. 2005) and is illustrated in Fig. 2. The given skinned fibre segment was briefly equilibrated in a solution containing a known concentration of BAPTA and then transferred into an emulsion of Triton X–100 and paraffin oil in order to lyse all intracellular membranous compartments and release any Ca2+, which then remained trapped within the fibre space. If an appropriate [BAPTA] was used, the BAPTA buffered the rise in free [Ca2+] sufficiently such that the fibre produced a detectable but non-maximal level of force. In such a situation the total amount of Ca2+ present within the fibre could be calculated from the [BAPTA] in the pre-equilibrating solution and the amplitude of the relative force response (see Methods). If zero or maximum force was produced upon lysis, the response indicated only an upper or a lower estimate of the total fibre Ca2+, respectively. Experiments were performed using fresh muscle fibres that had been skinned under paraffin oil, and hence the fibres initially still contained their normal endogenous Ca2+ content. Figure 2A presents the results for a typical type II fibre, which was equilibrated in 0.7 mm BAPTA and produced ∼40% of maximal force when lysed in TX–oil. Similar results were found in every endogenously loaded type II fibre examined from the young adult subjects, with a detectable, non-maximal force being elicited when the [BAPTA] was in the range 0.65–0.75 mm, and with maximal or zero force being elicited if the [BAPTA] was <0.6 mm or >0.8 mm, respectively (results not shown). The responses in type I fibres were very similar, except that the optimal [BAPTA] was slightly lower (∼0.60–0.70 mm). Such data indicated that the mean (±SEM) of the endogenous Ca2+ content was 0.76 ± 0.03 mmol per litre fibre volume in the type I fibres (n= 8) and slightly higher, 0.85 ± 0.02 mmol l−1, in the type II fibres (n= 15; P < 0.05).
Further measurements were performed to ascertain the total Ca2+ content in skinned fibres (i) when the SR was loaded to its maximum capacity, by pre-exposing the fibre to the load solution for 4 min (e.g. Fig. 2B), and (ii) when the SR had been depleted of all readily releasable Ca2+ by a 1 min pre-exposure to the caffeine-low [Mg2+]-based ‘full release solution’ (e.g. Fig. 2C). Such experiments indicated that the mean (±SEM) of the maximal Ca2+ capacity was 1.44 ± 0.04 mmol l−1 in the type I fibres (n= 14) and 1.79 ± 0.03 mmol l−1 in the type II fibres (n= 19; P < 0.05). In the cases where the SR had been depleted prior to the BAPTA-lysing procedure, the mean total amount of Ca2+ remaining was determined to be 0.08 ± 0.01 mmol l−1 in type I fibres (n= 8) and <0.07 mm in type II fibres (n= 11). In the latter fibres, no force response was elicited upon fibre lysing even though there was only 0.025 mm BAPTA present, and consequently only an upper estimate of the Ca2+ content could be obtained. It was expected that the lysing of the SR in the TX–oil would have rendered the SERCA pumps in a non-functional state with relatively low affinity for Ca2+, hence preventing them from contributing to the total number of high affinity Ca2+ binding sites present in the fibre (those primarily being BAPTA and TnC). In order to verify that the low force responses seen in the depleted SR experiments were not due to the SERCA binding appreciable amounts of Ca2+, a further three type I and seven type II fibres from three subjects were examined with 50 μm TBQ present in both the BAPTA pre-equilibration solution and the full release solution (see Methods). TBQ drives SERCA into a state with low Ca2+ affinity (Wictome et al. 1992), but its presence did not cause any appreciable difference in the force response upon lysing the fibres.
Figure 3 is a summary of the Ca2+ content data in the type I and type II fibres for the three different states of SR Ca2+ loading (endogenous content, maximum Ca2+ capacity and depleted SR). The Ca2+ content values found for a given fibre type and SR load state were similar in all subjects examined, as is apparent from the comparatively small SD values in Fig. 3.
Figure 3. Ca2+ content of human muscle fibres in various SR load states.
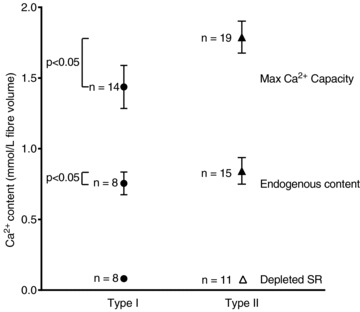
Mean ± SD of total Ca2+ content in type I (•) and type II (▴) fibres for indicated states (maximum capacity, endogenous content, and fully depleted SR, as in Fig. 2). Δ denotes fibres in which only an upper estimate of Ca2+ content could be established.
Using SR Ca2+ release to gauge Ca2+ capacity and uptake in human muscle fibres
An alternate, relative measure of the endogenous and maximal SR Ca2+ content in human fibres was also obtained by examining the force responses elicited in skinned fibres subjected to repeated Ca2+ release–reload cycles (see Fig. 4). As in the fibre-lysing experiments above, the fibres were skinned under paraffin oil and so initially had their endogenous SR Ca2+ present, which was then all released by the first exposure to the full release solution (30 mm caffeine-low [Mg2+], with 0.5 mm free EGTA to chelate the released Ca2+). The time integral (area) of the resulting force response was used as an indicator of the amount of Ca2+ that had been present in the SR before the release (Trinh & Lamb, 2006; Murphy et al. 2009a). The SR was then reloaded to some particular level and the Ca2+ again released (Fig. 4). The amount of Ca2+ loaded into the SR depended on the load time, with the relationship between the time integral of the force response and load time approaching saturation after approximately 180 s loading (Fig. 4C), when the SR was loaded at close to its maximal capacity. After taking into account the finite amount of Ca2+ that had to be released from the SR to generate any detectable force in the presence of 0.5 mm free EGTA (adjustment of ordinate origin in Fig. 4D; see Murphy et al. 2009a), it was possible to directly compare endogenous Ca2+ content to maximal Ca2+ content in the same fibre. Such analysis showed that the endogenous Ca2+ content in the type I fibre shown in Fig. 4A was a relatively large percentage of maximal content (open circle in Fig. 4D), whereas in the type II fibre it was a relatively low percentage of maximal content (open triangle in Fig. 4D). The values of all the individual fibres studied are shown in Fig. 5A. The endogenous Ca2+ content as a percentage of maximal Ca2+ content was on average 59 ± 5% in the type I fibres (n= 17) and 41 ± 2% in the type II fibres (n= 17; P < 0.05).
Figure 5. Relative measures of endogenous and maximal SR Ca2+ content in human skeletal muscle fibres.
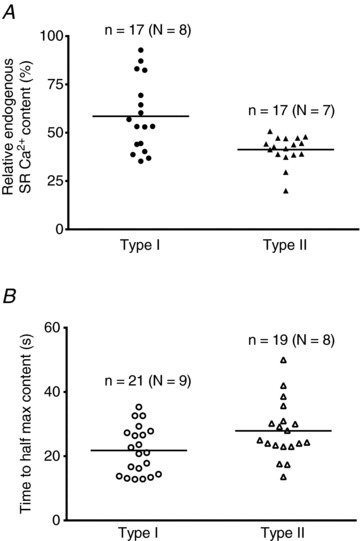
A, endogenous SR Ca2+ content as a percentage of maximal capacity in type I (•) and type II fibres (▴), determined from SR Ca2+ release–reloading experiments as in Fig. 4. Horizontal bars indicate mean value for each fibre type, which was significantly higher in type I fibres compared to type II fibres (59% and 41%, respectively, P < 0.05). B, time taken to reload the SR to 50% of maximum Ca2+ capacity (in standard load solution, pCa 6.7, 1 mm total EGTA) for type I (○) and type II Δ fibres, determined from exponential fit to loading data as in Fig. 4. The mean time taken to reach 50% of maximal Ca2+ capacity was significantly shorter in type I than in type II fibres (21.8 ± 1.6 s and 27.9 ± 2.0 s, respectively, P < 0.05). Number of fibres (n) and subjects (N) indicated for each case. Note that for some fibres in B the endogenous Ca2+ content was not ascertained and so there is no corresponding value in A.
A second distinction in the force–load time data between the two fibres shown in Fig. 4 was that the SR loading in the type II fibre appeared to be relatively slower than in the type I fibre (compare loading curves in Fig. 4D). On average the time taken to load the SR to half its maximum capacity was greater in type II fibres (27.9 ± 2.0 s, n= 19) than in type I fibres (21.8 ± 1.6 s, n= 21) (P < 0.05, Fig. 5B). As the Ca2+ buffering of the load solution was set at a low level in order to limit Ca2+ diffusion into the fibres to a similar low rate in both fibre types, these data indicate that the maximal Ca2+ capacity of the SR was ∼25% greater in type II fibres than in type I fibres (see Discussion).
CSQ and SERCA isoforms in human muscle fibres
Finally, western blotting was used to examine the relative amounts of the CSQ and SERCA isoforms present in human type I and type II fibres. Such data were obtained from the same fibres used in the SR load–release experiments, and other additional fibres from the same subjects, but did not include the fibres used in the lysing experiments, where the SR was disrupted with the TX–oil emulsion. In every type I fibre examined there was high SERCA2 abundance with very little or no SERCA1 apparent, and conversely in every type II fibre there was high SERCA1 abundance and little or no SERCA2 (e.g. Fig. 6A). The mixed fibres on the other hand had prominent bands for both SERCA1 and SERCA2 (e.g. Fig. 1A). Type II fibres on average had ∼3 times more CSQ1 than type I fibres and comparatively little CSQ2, whereas type I fibres almost invariably showed a strong CSQ2 signal, which on average was ∼5 times greater than in type II fibres (Fig. 6).
Discussion
One of the important findings of the present study is that the individual fibres in the vastus lateralis muscles of young healthy adults display strongly stereotypical patterns in isoform expression of CSQ and SERCA, the key SR calcium binding and pump proteins, in very tight correspondence with the predominant isoforms of both MHC and troponin (e.g. Figs 1B and 6A). Such tight correspondence of the SR and contractile proteins probably facilitates optimal contractile function in the individual fibre types by coordinating Ca2+ storage and re-uptake with the specific properties of the contractile apparatus (Schiaffino & Reggiani, 2011).
The endogenous Ca2+ content in vastus lateralis muscle fibres of young healthy adults was found to be slightly higher in type II fibres than in type I fibres (Fig. 3). Virtually all of this Ca2+ was rapidly releasable with the caffeine-low [Mg2+] stimulus, indicating that it was present in the SR. The remnant Ca2+ may also have been present in the SR and not released by the caffeine, or instead contained in other compartments, such as the mitochondria, transverse-tubular system or nuclei. The mitochondria in skeletal muscle take up Ca2+ (Rudolf et al. 2006; Rossi et al. 2011), but it appears that the absolute amount is comparatively low (Somlyo et al. 1981; Madsen et al. 1996; Allen et al. 2008). The amount of releasable Ca2+ present in the SR in human muscle fibres (∼0.7–0.8 mmol l−1) is substantially less than in rat fibres (∼1.0–1.1 mmol l−1; Fryer & Stephenson, 1996; Owen et al. 1997). This is probably because less Ca2+ release is needed to elicit maximum tetanic contractions in human fibres compared to rat fibres. The amount of Ca2+ released has to be sufficient to occupy not only the sites on TnC but also all other high affinity Ca2+ binding sites present. In contrast to rat muscle, human extrafusal muscle fibres do not contain any parvalbumin, the fast Ca2+-binding molecule found at millimolar levels in the cytoplasm of rat type II fibres (Heizmann et al. 1982; Fohr et al. 1993). Furthermore, the number of SERCA pumps in human vastus lateralis muscle fibres is only ∼70% of that in rat soleus muscle (Everts et al. 1989). At resting cytoplasmic [Ca2+] (∼50 nm) and [Mg2+] (1 mm), ∼25% of the Ca2+-specific sites and ∼40% of the Ca2+–Mg2+ sites on TnC are expected to already have Ca2+ bound (Robertson et al. 1981; Posterino & Lamb, 2003), and so full occupation of all sites on TnC would require ∼135 and ∼190 μmol l−1 additional Ca2+ in human type I and II fibres, respectively (see Methods). During a tetanus, the SR is constantly resequestering as well as releasing Ca2+, and at any instant a large proportion of the total circulating Ca2+ is found inside the SR (Canato et al. 2010). These considerations suggest that (i) the total amount of releasable Ca2+ held in the SR in human muscle fibres is not much more than the minimum necessary to ensure saturation of TnC and maintenance of maximum force throughout a prolonged tetanus, and (ii) the amount of Ca2+ release needed to elicit maximal force in human type II fibres is probably only slighter greater than in type I fibres, matching the observed endogenous SR Ca2+ contents (Fig. 3).
The technique used here also allowed measurement of the maximum Ca2+ capacity of the SR (Fig. 2B), which is ∼1.45 and 1.8 mmol l−1 in human type I and type II fibres, respectively (Fig. 3). Previous work with human muscle fibres that had been chemically skinned for 24 h in a glycerol–EGTA solution found the Ca2+ content reached after maximally reloading the SR was only ∼0.8 mmol l−1 (Salviati et al. 1982, no oxalate). That substantially lower value for maximal SR Ca2+ content was probably the result of (i) increased leakage through the Ca2+ release channels, due to the chemical skinning procedure having disrupted the normal inhibitory action exerted on the ryanodine receptors by the t-tubule dihydropyridine receptors (Lamb & Cellini, 1999; Weiss et al. 2004; Zhou et al. 2006), and (ii) increased loss of SR Ca2+ via ‘leakage’ through the SERCA pumps occurring in the presence of ADP (Inesi & de Meis, 1989; Macdonald & Stephenson, 2001; Murphy et al. 2009a), as the [ADP] in the load solution would have been considerably higher in the experiments of Salviati et al. because no creatine phosphate was present. The maximum Ca2+ content values found here also show that the 34% increase in Ca2+ content seen in the vastus lateralis muscle of humans following a 20 km run (from ∼0.66 to 0.88 mmol l−1 in mixed fibre samples; Overgaard et al. 2004) is still well below the maximal SR Ca2+ capacity of those fibres.
The maximal Ca2+ capacity in human type II fibres (∼1.8 mmol l−1) is much smaller than in rat EDL type II fibres (∼3.9 mmol l−1; Fryer & Stephenson, 1996), and concomitantly the endogenous Ca2+ content constitutes a larger percentage of maximum capacity (∼47% in human type II fibres (Fig. 3) versus∼30% in rat EDL fibres). These differences probably stem from the less extreme contractile demands on the human type II fibres, which are predominantly type IIA fibres (Bottinelli & Reggiani, 2000; Szentesi et al. 2001) whereas rat EDL fibres are mostly IIB or IID/X (Delp & Duan, 1996). Rat EDL fibres have relatively large amounts of SERCA1 (∼100 μmol kg−1; Wu & Lytton, 1993) to be able to relax rapidly, and also large amounts of CSQ1 so that the SR can store the Ca2+ necessary for contractile activation and yet keep the free [Ca2+] within the SR at a relatively low level to both aid Ca2+ reuptake and minimize Ca2+ leakage through the high density of SERCA (Murphy et al. 2009a). Human type II fibres do not need to relax as rapidly as rat IIB fibres and have ∼6–fold fewer SERCA (Everts et al. 1989), the values in human type I and type II fibres estimated as being ∼12 and 16 μmol kg−1, respectively (based on absolute and relative values for rat muscle; Everts et al. 1989; Wu & Lytton, 1993), and assuming maximum SR ATPase rates in human type I and II fibres (Szentesi et al. 2001) are indicative of the relative SERCA densities).
The present study was not able to quantify the absolute amounts of CSQ present in human muscle because purified human CSQ protein was not available for the necessary calibrations. Nevertheless, given that it has been previously shown that CSQ content appears to quantitatively account for maximal SR Ca2+ content in rat fibres (Murphy et al. 2009a), it seems reasonable to conclude from the maximal Ca2+ content values found here that human type II fibres probably contain less than half as much CSQ1 as rat EDL fibres, and that the total CSQ content in human type I fibres is similar to or slightly lower than in the type II fibres (based on the relative Ca2+ binding capacities of CSQ1 and CSQ2 (Park et al. 2004; Murphy et al. 2009a). These values of relative CSQ content seem in accord with the respective SR volumes, which constitute ∼9.3% and 3.3% of total fibre volume in rat EDL and soleus fibres, respectively, and ∼3.8% in human vastus lateralis fibres (Eisenberg, 1983). Overall, human type II fibres have less SR Ca2+ than rat type IIB/D fibres but the CSQ content/maximum Ca2+ capacity is proportionately even lower, and as a result the free [Ca2+] within the SR in human type II fibres is probably higher than in rat type II fibres. However, this higher SR free [Ca2+] should not be a major energetic disadvantage, because the human fibres do not need to take up Ca2+ as rapidly and also have far few SERCA contributing to leakage of Ca2+ from the SR.
In view of the similar fibre-specific distributions of the CSQ isoforms in the present study and in our previous work in rat fibres (Murphy et al. 2009a), it seems likely that the roles of the respective CSQ isoforms are similar in human and rat muscle, with CSQ1 being the primary determinant of SR Ca2+ buffering and maximum capacity in type II fibres, and with CSQ1 and CSQ2 collectively having such a role in type I fibres. The findings, however, also point to some important unanswered questions. In particular, why do type I fibres seemingly always express substantial amounts of CSQ2 in addition to CSQ1? It is possible that this allows the SR to be loaded at relatively higher free [Ca2+] (as found here and previously for type I fibres), perhaps by CSQ2 regulating the ryanodine receptors as suggested to occur in cardiac muscle (Knollmann, 2009; Chen et al. 2013). It could also be that CSQ2 modulates Ca2+ uptake by interacting with SERCA2, as suggested for histidine-rich calcium-binding protein, another SR Ca2+-buffering protein (Arvanitis et al. 2011), and this might also account for why CSQ2 seems to always be co-expressed with SERCA2.
Relative measures of SR Ca2+ content and loading
The fibre-lysing methodology yielded absolute values for fibre Ca2+ content in the different conditions, but one major limitation was that measurement could be made only under a single condition in any given fibre. Consequently, an additional aim was to compare the results with those obtained using a repeated Ca2+ release–reload protocol (Trinh & Lamb, 2006; Murphy et al. 2009a) as a means of gauging the relative SR Ca2+ content levels in the human fibres (Figs 4 and 5). These experiments indicated that the endogenous Ca2+ content of the SR relative to maximum content measured in the same fibre was greater in type I fibres (mean ∼59%) than in type II fibres (mean ∼41%; Fig. 5A), in broad agreement with the absolute Ca2+ content data measured in the fibre-lysing experiments (Fig. 3). It was further found that the time taken to reload the SR to half-maximal capacity in type II fibres was on average ∼28% longer than in type I fibres (Fig. 5B). The level of Ca2+ buffering in the SR load solution was made comparatively low in order to limit the rate of SR Ca2+ uptake to that determined by the relatively slow rate of diffusion of Ca2+ into the skinned fibre (Trinh & Lamb, 2006). As the average fibre diameter is similar in type I and type II fibres in vastus lateralis muscle of young healthy adults (Trappe et al. 2004), the rate of Ca2+ diffusion into the fibres should also have been similar. Consequently, the loading data indicate that the maximal SR Ca2+ capacity was ∼25–30% greater in the type II fibres, in agreement with the direct measurements of the content (Fig. 3).
Consideration of reliability of lysing assay
The estimates of endogenous and maximal Ca2+ content obtained here with the fibre lysing technique were determined primarily by the [BAPTA] in which the fibre was pre-equilibrated, because a comparatively large amount of the total Ca2+ had to bind to the BAPTA for the free [Ca2+] to reach a sufficient level (>0.5 μm) to elicit any force response. This estimate of the amount of Ca2+ bound to BAPTA was relatively insensitive to the precise force level measured, owing to the relatively high Ca2+ affinity of BAPTA and the steepness of the force–[Ca2+] relationship (see Fryer & Stephenson, 1996; Owen et al. 1997), the latter verified as being virtually unchanged in the TX–oil emulsion (e.g. Fig. 2A). Thus, the effect on these estimates of any errors in the assumptions about Ca2+ binding to contractile or other sites (see Methods) would have been comparatively small, and in any case would not affect comparisons between the endogenous and maximal content estimates. The estimates of the Ca2+ content in fibres with a depleted SR, however, are possibly less reliable, because the amount of BAPTA present in the fibre was only ∼25 μm, and consequently the force response upon lysing was probably determined largely by the extent of Ca2+ binding to other sites, the density and properties of which are less certain. However, previous work using Triton-treated mammalian fibres has shown that very little total Ca2+ (∼40 μmol per litre fibre volume) binds within the fibres near and below the threshold at which detectable force is elicited (Fuchs, 1985), which implies that the error in Ca2+ content estimates in the depleted fibres was probably relatively small in absolute terms.
Concluding remarks
This study is the first to provide quantitative estimates of the endogenous and maximal Ca2+ content of individual type I and type II muscle fibres of humans. The findings provide evidence that SR Ca2+ content and capacity in the type II fibres is determined predominantly by the amount of CSQ1 present but in type I fibres it is probably determined by the amounts of both CSQ1 and CSQ2. The study also found the isoform expression of SERCA and CSQ to be highly stereotyped, conforming closely with the isoform expression of MHC and other contractile proteins in a tightly fibre-specific manner in the muscle of the healthy, active young adults examined. Future studies using the same technique could reveal whether or how these processes and isoform expression of various SR and contractile proteins alter with ageing, inactivity or chronic diseases. The reason why type I fibres invariably express considerable CSQ2 in addition to CSQ1, and the precise role(s) of CSQ2 in SR Ca2+ storage and function, remain unanswered.
Acknowledgments
We thank Maria Cellini and Heidy Latchman for technical assistance.
Glossary
Abbreviations
- CaBAPTA
calcium bound to BAPTA
- CaEGTA
calcium bound to EGTA
- CSQ
calsequestrin
- EDL
extensor digitorum longus
- HDTA
hexa-methylene-diamine-tetraacetate
- h
Hill coefficient
- MHC
myosin heavy chain
- n
number of fibres
- N
number of subjects
- pCa
–log10[Ca2+]
- pCa50
pCa producing half-maximal force
- pSr
–log10[Sr2+]
- SERCA
sarco(endo)plasmic reticulum Ca2+-ATPase
- SR
sarcoplasmic reticulum
- TBQ
2,5-di-tert-butyl-1,4-hydroquinone
- TnC
troponin C
- TnI
troponin I
Additional information
Competing interests
The authors declare that they have no competing interests.
Author contributions
Muscle biopsies were performed at Victoria University, and biochemical and physiological measurements on skinned fibres made at La Trobe University. C.R.L. and M.J.M. were responsible for subject care and obtaining muscle biopsies from human subjects. Skinned fibre experiments were designed and analysed by G.D.L. and C.R.L. and carried out by C.R.L.; R.M.M. and G.D.L. were responsible for Western blotting procedures and analysis. C.R.L. and G.D.L. drafted the manuscript. All authors were involved in the conception of the project and have reviewed the final version of the submitted manuscript.
Funding
This work was supported by the National Health & Medical Research Council of Australia (Grant number 1051460).
References
- Allen DG, Lamb GD, Westerblad H. Skeletal muscle fatigue: cellular mechanisms. Physiol Rev. 2008;88:287–332. doi: 10.1152/physrev.00015.2007. [DOI] [PubMed] [Google Scholar]
- Arvanitis DA, Vafiadaki E, Sanoudou D, Kranias EG. Histidine-rich calcium binding protein: the new regulator of sarcoplasmic reticulum calcium cycling. J Mol Cell Cardiol. 2011;50:43–49. doi: 10.1016/j.yjmcc.2010.08.021. [DOI] [PMC free article] [PubMed] [Google Scholar]
- Beard NA, Laver DR, Dulhunty AF. Calsequestrin and the calcium release channel of skeletal and cardiac muscle. Prog Biophys Mol Biol. 2004;85:33–69. doi: 10.1016/j.pbiomolbio.2003.07.001. [DOI] [PubMed] [Google Scholar]
- Berchtold MW, Brinkmeier H, Muntener M. Calcium ion in skeletal muscle: its crucial role for muscle function, plasticity, and disease. Physiol Rev. 2000;80:1215–1265. doi: 10.1152/physrev.2000.80.3.1215. [DOI] [PubMed] [Google Scholar]
- Bortolotto SK, Cellini M, Stephenson DG, Stephenson GM. MHC isoform composition and Ca2+- or Sr2+-activation properties of rat skeletal muscle fibers. Am J Physiol Cell Physiol. 2000;279:C1564–C1577. doi: 10.1152/ajpcell.2000.279.5.C1564. [DOI] [PubMed] [Google Scholar]
- Bottinelli R, Reggiani C. Human skeletal muscle fibres: molecular and functional diversity. Prog Biophys Mol Biol. 2000;73:195–262. doi: 10.1016/s0079-6107(00)00006-7. [DOI] [PubMed] [Google Scholar]
- Canato M, Scorzeto M, Giacomello M, Protasi F, Reggiani C, Stienen GJ. Massive alterations of sarcoplasmic reticulum free calcium in skeletal muscle fibers lacking calsequestrin revealed by a genetically encoded probe. Proc Natl Acad Sci U S A. 2010;107:22326–22331. doi: 10.1073/pnas.1009168108. [DOI] [PMC free article] [PubMed] [Google Scholar]
- Chen H, Valle G, Furlan S, Nani A, Gyorke S, Fill M, Volpe P. Mechanism of calsequestrin regulation of single cardiac ryanodine receptor in normal and pathological conditions. J Gen Physiol. 2013;142:127–136. doi: 10.1085/jgp.201311022. [DOI] [PMC free article] [PubMed] [Google Scholar]
- Damiani E, Volpe P, Margreth A. Coexpression of two isoforms of calsequestrin in rabbit slow-twitch muscle. J Muscle Res Cell Motil. 1990;11:522–530. doi: 10.1007/BF01745219. [DOI] [PubMed] [Google Scholar]
- Delp MD, Duan C. Composition and size of type I, IIA, IID/X, and IIB fibers and citrate synthase activity of rat muscle. J Appl Physiol. 1996;80:261–270. doi: 10.1152/jappl.1996.80.1.261. [DOI] [PubMed] [Google Scholar]
- Dutka TL, Cole L, Lamb GD. Calcium phosphate precipitation in the sarcoplasmic reticulum reduces action potential-mediated Ca2+ release in mammalian skeletal muscle. Am J Physiol Cell Physiol. 2005;289:C1502–C1512. doi: 10.1152/ajpcell.00273.2005. [DOI] [PubMed] [Google Scholar]
- Dutka TL, Lamboley CR, McKenna MJ, Murphy RM, Lamb GD. Effects of carnosine on contractile apparatus Ca2+ sensitivity and sarcoplasmic reticulum Ca2+ release in human skeletal muscle fibers. J Appl Physiol. 2012;112:728–736. doi: 10.1152/japplphysiol.01331.2011. [DOI] [PubMed] [Google Scholar]
- Ebashi S, Endo M, Otsuki I. Control of muscle contraction. Q Rev Biophys. 1969;2:351–384. doi: 10.1017/s0033583500001190. [DOI] [PubMed] [Google Scholar]
- Eisenberg BR. Quantitative ultrastructure of mammalian skeletal muscle. In: Peachy LD, Adrian RH, Geiger SR, editors. Handbook of Physiology. section 10. Bethesda, MD, USA: American Physiological Society; 1983. pp. 73–112. Skeletal Muscle. [Google Scholar]
- Everts ME, Andersen JP, Clausen T, Hansen O. Quantitative determination of Ca2+-dependent Mg2+-ATPase from sarcoplasmic reticulum in muscle biopsies. Biochem J. 1989;260:443–448. doi: 10.1042/bj2600443. [DOI] [PMC free article] [PubMed] [Google Scholar]
- Fohr UG, Weber BR, Muntener M, Staudenmann W, Hughes GJ, Frutiger S, Banville D, Schafer BW, Heizmann CW. Human α and β parvalbumins. Structure and tissue-specific expression. Eur J Biochem. 1993;215:719–727. doi: 10.1111/j.1432-1033.1993.tb18084.x. [DOI] [PubMed] [Google Scholar]
- Fryer MW, Stephenson DG. Total and sarcoplasmic reticulum calcium contents of skinned fibres from rat skeletal muscle. J Physiol. 1996;493:357–370. doi: 10.1113/jphysiol.1996.sp021388. [DOI] [PMC free article] [PubMed] [Google Scholar]
- Fuchs F. The binding of calcium to detergent-extracted rabbit psoas muscle fibres during relaxation and force generation. J Muscle Res Cell Motil. 1985;6:477–486. doi: 10.1007/BF00712584. [DOI] [PubMed] [Google Scholar]
- Gordon AM, Homsher E, Regnier M. Regulation of contraction in striated muscle. Physiol Rev. 2000;80:853–924. doi: 10.1152/physrev.2000.80.2.853. [DOI] [PubMed] [Google Scholar]
- Harrison SM, Bers DM. The effect of temperature and ionic strength on the apparent Ca-affinity of EGTA and the analogous Ca-chelators BAPTA and dibromo-BAPTA. Biochim Biophys Acta. 1987;925:133–143. doi: 10.1016/0304-4165(87)90102-4. [DOI] [PubMed] [Google Scholar]
- Heizmann CW, Berchtold MW, Rowlerson AM. Correlation of parvalbumin concentration with relaxation speed in mammalian muscles. Proc Natl Acad Sci U S A. 1982;79:7243–7247. doi: 10.1073/pnas.79.23.7243. [DOI] [PMC free article] [PubMed] [Google Scholar]
- Inesi G, de Meis L. Regulation of steady state filling in sarcoplasmic reticulum. Roles of back-inhibition, leakage, and slippage of the calcium pump. J Biol Chem. 1989;264:5929–5936. [PubMed] [Google Scholar]
- Knollmann BC. New roles of calsequestrin and triadin in cardiac muscle. J Physiol. 2009;587:3081–3087. doi: 10.1113/jphysiol.2009.172098. [DOI] [PMC free article] [PubMed] [Google Scholar]
- Lamb GD, Cellini MA. High intracellular [Ca2+] alters sarcoplasmic reticulum function in skinned skeletal muscle fibres of the rat. J Physiol. 1999;519:815–827. doi: 10.1111/j.1469-7793.1999.0815n.x. [DOI] [PMC free article] [PubMed] [Google Scholar]
- Lamb GD, Posterino GS. Effects of oxidation and reduction on contractile function in skeletal muscle fibres of the rat. J Physiol. 2003;546:149–163. doi: 10.1113/jphysiol.2002.027896. [DOI] [PMC free article] [PubMed] [Google Scholar]
- Macdonald WA, Stephenson DG. Effects of ADP on sarcoplasmic reticulum function in mechanically skinned skeletal muscle fibres of the rat. J Physiol. 2001;532:499–508. doi: 10.1111/j.1469-7793.2001.0499f.x. [DOI] [PMC free article] [PubMed] [Google Scholar]
- McKenna MJ, Medved I, Goodman CA, Brown MJ, Bjorksten AR, Murphy KT, Petersen AC, Sostaric S, Gong X. N-Acetylcysteine attenuates the decline in muscle Na+,K+-pump activity and delays fatigue during prolonged exercise. J Physiol. 2006;576:279–288. doi: 10.1113/jphysiol.2006.115352. [DOI] [PMC free article] [PubMed] [Google Scholar]
- MacLennan DH, Wong PT. Isolation of a calcium-sequestering protein from sarcoplasmic reticulum. Proc Natl Acad Sci U S A. 1971;68:1231–1235. doi: 10.1073/pnas.68.6.1231. [DOI] [PMC free article] [PubMed] [Google Scholar]
- Madsen K, Ertbjerg P, Djurhuus MS, Pedersen PK. Calcium content and respiratory control index of skeletal muscle mitochondria during exercise and recovery. Am J Physiol Endocrinol Metab. 1996;271:E1044–E1050. doi: 10.1152/ajpendo.1996.271.6.E1044. [DOI] [PubMed] [Google Scholar]
- Murphy RM. Enhanced technique to measure proteins in single segments of human skeletal muscle fibers: fiber-type dependence of AMPK-α1 and -β1. J Appl Physiol. 2011;110:820–825. doi: 10.1152/japplphysiol.01082.2010. [DOI] [PubMed] [Google Scholar]
- Murphy RM, Larkins NT, Mollica JP, Beard NA, Lamb GD. Calsequestrin content and SERCA determine normal and maximal Ca2+ storage levels in sarcoplasmic reticulum of fast- and slow-twitch fibres of rat. J Physiol. 2009a;587:443–460. doi: 10.1113/jphysiol.2008.163162. [DOI] [PMC free article] [PubMed] [Google Scholar]
- Murphy RM, Mollica JP, Lamb GD. Plasma membrane removal in rat skeletal muscle fibers reveals caveolin–3 hot-spots at the necks of transverse tubules. Exp Cell Res. 2009b;315:1015–1028. doi: 10.1016/j.yexcr.2008.11.022. [DOI] [PubMed] [Google Scholar]
- O’Connell B, Nguyen LT, Stephenson GM. A single-fibre study of the relationship between MHC and TnC isoform composition in rat skeletal muscle. Biochem J. 2004;378:269–274. doi: 10.1042/BJ20031170. [DOI] [PMC free article] [PubMed] [Google Scholar]
- Overgaard K, Fredsted A, Hyldal A, Ingemann-Hansen T, Gissel H, Clausen T. Effects of running distance and training on Ca2+ content and damage in human muscle. Med Sci Sports Exerc. 2004;36:821–829. doi: 10.1249/01.mss.0000126468.65714.60. [DOI] [PubMed] [Google Scholar]
- Owen VJ, Lamb GD, Stephenson DG, Fryer MW. Relationship between depolarization-induced force responses and Ca2+ content in skeletal muscle fibres of rat and toad. J Physiol. 1997;498:571–586. doi: 10.1113/jphysiol.1997.sp021884. [DOI] [PMC free article] [PubMed] [Google Scholar]
- Paolini C, Quarta M, Nori A, Boncompagni S, Canato M, Volpe P, Allen PD, Reggiani C, Protasi F. Reorganized stores and impaired calcium handling in skeletal muscle of mice lacking calsequestrin–1. J Physiol. 2007;583:767–784. doi: 10.1113/jphysiol.2007.138024. [DOI] [PMC free article] [PubMed] [Google Scholar]
- Park H, Park IY, Kim E, Youn B, Fields K, Dunker AK, Kang C. Comparing skeletal and cardiac calsequestrin structures and their calcium binding: a proposed mechanism for coupled calcium binding and protein polymerization. J Biol Chem. 2004;279:18026–18033. doi: 10.1074/jbc.M311553200. [DOI] [PubMed] [Google Scholar]
- Posterino GS, Lamb GD. Effect of sarcoplasmic reticulum Ca2+ content on action potential-induced Ca2+ release in rat skeletal muscle fibres. J Physiol. 2003;551:219–237. doi: 10.1113/jphysiol.2003.040022. [DOI] [PMC free article] [PubMed] [Google Scholar]
- Robertson SP, Johnson JD, Potter JD. The time-course of Ca2+ exchange with calmodulin, troponin, parvalbumin, and myosin in response to transient increases in Ca2+ Biophys J. 1981;34:559–569. doi: 10.1016/S0006-3495(81)84868-0. [DOI] [PMC free article] [PubMed] [Google Scholar]
- Rossi AE, Boncompagni S, Wei L, Protasi F, Dirksen RT. Differential impact of mitochondrial positioning on mitochondrial Ca2+ uptake and Ca2+ spark suppression in skeletal muscle. Am J Physiol Cell Physiol. 2011;301:C1128–C1139. doi: 10.1152/ajpcell.00194.2011. [DOI] [PMC free article] [PubMed] [Google Scholar]
- Rossi AE, Dirksen RT. Sarcoplasmic reticulum: the dynamic calcium governor of muscle. Muscle Nerve. 2006;33:715–731. doi: 10.1002/mus.20512. [DOI] [PubMed] [Google Scholar]
- Rudolf R, Magalhães PJ, Pozzan T. Direct in vivo monitoring of sarcoplasmic reticulum Ca2+ and cytosolic cAMP dynamics in mouse skeletal muscle. J Cell Biol. 2006;173:187–193. doi: 10.1083/jcb.200601160. [DOI] [PMC free article] [PubMed] [Google Scholar]
- Salviati G, Sorenson MM, Eastwood AB. Calcium accumulation by the sarcoplasmic reticulum in two populations of chemically skinned human muscle fibers. Effects of calcium and cyclic AMP. J Gen Physiol. 1982;79:603–632. doi: 10.1085/jgp.79.4.603. [DOI] [PMC free article] [PubMed] [Google Scholar]
- Schiaffino S, Reggiani C. Fiber types in mammalian skeletal muscles. Physiol Rev. 2011;91:1447–1531. doi: 10.1152/physrev.00031.2010. [DOI] [PubMed] [Google Scholar]
- Somlyo AV, Gonzalez-Serratos HG, Shuman H, McClellan G, Somlyo AP. Calcium release and ionic changes in the sarcoplasmic reticulum of tetanized muscle: an electron-probe study. J Cell Biol. 1981;90:577–594. doi: 10.1083/jcb.90.3.577. [DOI] [PMC free article] [PubMed] [Google Scholar]
- Szentesi P, Zaremba R, van Mechelen W, Stienen GJ. ATP utilization for calcium uptake and force production in different types of human skeletal muscle fibres. J Physiol. 2001;531:393–403. doi: 10.1111/j.1469-7793.2001.0393i.x. [DOI] [PMC free article] [PubMed] [Google Scholar]
- Trappe S, Trappe T, Gallagher P, Harber M, Alkner B, Tesch P. Human single muscle fibre function with 84 day bed-rest and resistance exercise. J Physiol. 2004;557:501–513. doi: 10.1113/jphysiol.2004.062166. [DOI] [PMC free article] [PubMed] [Google Scholar]
- Trinh HH, Lamb GD. Matching of sarcoplasmic reticulum and contractile properties in rat fast- and slow- twitch muscle fibres. Clin Exp Pharmacol Physiol. 2006;33:591–600. doi: 10.1111/j.1440-1681.2006.04412.x. [DOI] [PubMed] [Google Scholar]
- Weiss RG, O’Connell KM, Flucher BE, Allen PD, Grabner M, Dirksen RT. Functional analysis of the R1086H malignant hyperthermia mutation in the DHPR reveals an unexpected influence of the III-IV loop on skeletal muscle EC coupling. Am J Physiol Cell Physiol. 2004;287:C1094–C1102. doi: 10.1152/ajpcell.00173.2004. [DOI] [PubMed] [Google Scholar]
- Wictome M, Michelangeli F, Lee AG, East JM. The inhibitors thapsigargin and 2,5-di(tert-butyl)-1,4- benzohydroquinone favour the E2 form of the Ca2+,Mg2+-ATPase. FEBS Lett. 1992;304:109–113. doi: 10.1016/0014-5793(92)80599-c. [DOI] [PubMed] [Google Scholar]
- Wu KD, Lytton J. Molecular cloning and quantifi- cation of sarcoplasmic reticulum Ca2+-ATPase isoforms in rat muscles. Am J Physiol Cell Physiol. 1993;264:C333–C341. doi: 10.1152/ajpcell.1993.264.2.C333. [DOI] [PubMed] [Google Scholar]
- Zhou J, Yi J, Royer L, Launikonis BS, González A, García J, Ríos E. A probable role of dihydropyridine receptors in repression of Ca2+ sparks demonstrated in cultured ma- mmalian muscle. Am J Physiol Cell Physiol. 2006;290:C539–C553. doi: 10.1152/ajpcell.00592.2004. [DOI] [PubMed] [Google Scholar]