

Abstract
Aortic aneurysm is a leading cause of death in adults, often taking lives without any premonitory signs or symptoms. Adverse clinical outcomes of aortic aneurysm are preventable by elective surgical repair; however, identifying at-risk individuals is difficult. The objective of this study was to perform a predictive biomechanical analysis of ascending aortic aneurysm (AsAA) tissue to assess rupture risk on a patient-specific level. AsAA tissues, obtained intra-operatively from 50 patients, were subjected to biaxial mechanical and uniaxial failure tests to obtain their passive elastic mechanical properties. A novel analytical method was developed to predict the AsAA pressure-diameter response as well as the aortic wall yield and failure responses. Our results indicated that the mean predicted AsAA diameter at rupture was 5.6 ± 0.7 cm, and the associated blood pressure to induce rupture was 579.4 ± 214.8 mmHg. Statistical analysis showed significant positive correlation between aneurysm tissue compliance and predicted risk of rupture, where patients with a pressure-strain modulus ≥100 kPa may be nearly twice as likely to experience rupture than patients with more compliant aortic tissue. The mechanical analysis of pre-dissection patient tissue properties established in this study could predict the “future” onset of yielding and rupture in AsAA patients. The analysis results implicate decreased tissue compliance as a risk factor for AsAA rupture. The presented methods may serve as a basis for the development of a pre-operative planning tool for AsAA evaluation, a tool currently unavailable.
Keywords: Ascending aortic aneurysm, Bicuspid aortic valve, Bovine aortic arch, Rupture potential
1. Introduction
Aortic aneurysm is a leading cause of death of adults [1], often claiming lives without any premonitory signs or symptoms. Adverse clinical outcomes of aortic aneurysm are preventable by elective surgical repair; however, identifying at-risk individuals is difficult [2]. Currently the decision to repair an ascending aortic aneurysm (AsAA) lies predominantly on the aneurysm diameter: namely, patients with an AsAA dilated to 5.5 cm or greater are recommended for surgery [3,4]. However, the reliability of the diameter criterion to predict aneurysm rupture and dissection has been largely debated in the literature [3,5,6]. Ruptured AsAAs at diameters less than 4.5 cm have been documented [3].
Recent studies have shown that the peak vessel wall stress in abdominal aortic aneurysms may be a more reliable rupture criterion than the overall diameter, as the peak wall stress for ruptured aneurysms is about 60% higher than for non-ruptured [7,8]. In a study by Koullias et al. [4] the ascending aortic wall stress was estimated in vivo. They found that the aneurismal wall stress in a hypertensive patient with an AsAA 6 cm in diameter may exceed the strength of the tissue [4]. However, this conclusion may not be sufficient to assess rupture risk on a patient-specific level, because the AsAA tissue elastic properties and failure strength are different for each individual. The aortic tissue strength may be compromised by underlying microstructural changes brought on by aging [9,10], disease progression [11], or other factors [12,13]. Therefore, the patient-specific tissue strength and the aortic wall stress are both critical for assessing AsAA rupture potential.
In this study, we performed a biomechanical analysis of the passive AsAA tissue elastic properties and failure strength. A total of 50 AsAA patients were studied among 3 sub-groups: AsAA – patients without a bicuspid aortic valve (BAV) or bovine aortic arch (BAA) (n = 20), ASAA-BAV – patients with a BAV (n = 17), and ASAA-BAA – patients with BAA and without a BAV (n = 13). We developed a novel analytical method to characterize the experimental data and predict the in vivo failure criteria (aneurysm diameter and blood pressure) on a patient specific level. We focus on AsAA patients with concomitant BAV and BAA in this study, because BAV has long since been known as a risk factor of AsAA and dissection [14], and a recent study by the Yale Aortic Institute [15] suggests a link between BAA and dissection. The failure criteria for each patient group were compared to determine whether the presence of BAV or BAA elevates rupture risk in patients with AsAA.
The details of the experimental methods, data and results are presented in part 1 [16] of this study, while the focus of this paper (part 2) is the analytical methods and results to predict AsAA rupture risk in different patient groups.
2. Methods
2.1. Patient selection
AsAA tissue specimens were collected perioperative from 50 patients undergoing elective AsAA repair at Yale – New Haven hospital between December 2008 and September 2010 and stored fresh at −80 °C. Once the fresh frozen specimens were transported to our lab, the samples were cryopreserved [17] and stored at −80 °C until they could be tested (refer to Fig. 1 in [16]). The use of human tissues in this study was approved by the Research Compliance Office of the University of Connecticut. The 50 AsAA patients studied were divided among 3 sub-groups: AsAA – patients without a BAV or BAA (n = 20), AsAA-BAV – patients with a BAV (n = 17), and AsAA-BAA – patients with BAA and without a BAV (n = 13). The mean patient age was 58.2 ± 11.6 years and the ratio of male to female patients was 38:12. The following clinical data were provided for each patient: the systolic/diastolic blood pressure, age, gender, height, weight, aneurysm diameter, and presence of a BAV or a BAA. The AsAA diameter provided by the Yale Aortic Institute for each patient was assumed to correspond to the systolic condition, because the clinical practice is to record the largest diameter observed. The patient characteristics are summarized in Table 1.
Fig. 1.

(a) τ11 vs. τ22 plot, (b) τ11 vs. E11 plot, and (c) τ22 vs. E22 plot with all biaxial test protocols.
Table 1.
Summary of patients’ characteristics.
| Patient group | Age | Gender (M:F) | Pdias (mmHg) | Psys (mmHg) | Dsys (cm) | Height (in) | Weight (lbs) |
|---|---|---|---|---|---|---|---|
| AsAA | 64.1 ± 8.33 | 15:5 | 76.4 ± 8.97 | 133.6 ± 16.9 | 4.92 ± 0.44 | 69.3 ± 4.52 | 203.0 ± 41.5 |
| BAV | 53.9 ± 9.66 | 13:4 | 73.4 ± 10.9 | 124.6 ± 18.7 | 5.02 ± 0.49 | 67.7 ± 3.33 | 186.3 ± 38.3 |
| BAA | 55.0 ± 14.8 | 3:10 | 73.2 ± 11.2 | 131.8 ± 15.8 | 4.91 ± 0.54 | 65.1 ± 15.8 | 194.3 ± 33.2 |
| p-value | 0.012 | - | 0.583 | 0.273 | 0.765 | 0.180 | 0.393 |
2.2. Biomechanical testing
2.2.1. Planar biaxial mechanical test
The tissue specimens were defrosted via the published method [17] and inspected for the presence of calcification and evidence of prior dissection before undergoing mechanical testing. The biaxial tests were performed [16] according to the methods of Sacks and Sun [18]. Briefly, specimens were submerged in a bath of Ca2+-free and glucose-free Tyrode solution (mM: NaCl 136.9, KCl 2.7, MgCl2 1.05, NaHCO3 11.9, NaHPO4 0.47, EGTA 2.0, and 0.1 M papaverine) at 37 °C for the duration of each test, which consisted of preconditioning for at least 40 continuous cycles followed by tension-controlled loading protocols at the following first Piola Kirchhoff tension, τ, ratios: τ11:τ22 = 0.75:1, 0.5:1, 0.3:1, 0.1:1, 1:1, 1:0.75, 1:0.5, 1:0.3, and 1:0.1 (see Fig. 1a). An illustrative set of biaxial data is given in Fig. 1b–c for one specimen. For a more complete description of the biaxial mechanical testing, please refer to part 1 of this study [16].
2.2.2. Uniaxial tensile failure test
The uniaxial failure properties of the tissue specimens were also quantified in part 1 of this study [16]. Briefly, thin strips of tissue approximately 15 × 5 mm in size were cut along both the circumferential and longitudinal directions of the biaxial test specimens. Each strip of tissue was loaded to failure with a Tinius Olsen uniaxial test device (Horsham, PA). From the uniaxial test data, the yield (YT) and ultimate tension (UT) were determined for each specimen in each anatomical direction. The YT represents the points in the tension-strain curves where the slope decreases marking the elastic limits of the tissue, while the UT represents the highest tension values in each direction. Representative failure test data is presented for one AsAA patient in Fig. 2. Further details on the uniaxial tensile failure test can be found in [16].
Fig. 2.

Uniaxial failure test in the (a) circumferential and (b) longitudinal directions for a selected patient with green triangles and red squares corresponding to the yield and ultimate tension values respectively.
2.3. Predictive modeling
2.3.1. Constitutive modeling of biaxial testing data
The AsAA tissue specimens were assumed to be anisotropic, incompressible, nonlinear hyperelastic materials. Therefore, the second Piola Kirchhoff stress (S) can be expressed as
| (1) |
where E represents the Green-Lagrangian strain tensor and W is a strain energy function. The experimental data was fitted with the generalized Fung-type strain energy function [19] for the planar biaxial responses of soft biological tissues given by the following equations:
| (2) |
| (3) |
where c and A1–6 are the material constants. The Cauchy stress tensor, σ, can then be calculated by
| (4) |
where F is the deformation gradient and J is the determinant of F. The tension tensor in the spatial description, t, can be obtained by
| (5) |
where h is the deformed tissue thickness.
To fit and extrapolate the 1:0.5 protocol biaxial testing data to higher loads, F was incremented, and t was determined for each increment through Eqs. (1)–(5).
2.3.2. Extrapolation of the biaxial testing protocol
Several assumptions were made in order to calculate the aortic wall tension. The AsAA tissue was assumed to be of a closed-end, thin-walled cylinder as in previous studies [4,12,20,21]. The assumed cylindrical shape may be valid for aneurysms of the ascending aorta proximal to the ligamentum arteriosum, because unlike descending and abdominal aortic aneurysms, these are typically diffuse and relatively homogenous, with no significant intraluminal thrombus [3]. According to the Laplace law, the ratio of the circumferential to longitudinal Cauchy stress in the aortic wall is 1:0.5. Thus, we utilized the 1:0.5 τ11: τ22 protocol of the biaxial testing data assuming that this protocol most closely approximates the in vivo condition, and extrapolated the tissue response to a level at which tensile failure could occur. Throughout the derivation, the subscript “11” refers to the circumferential direction, while the subscript “22” refers to the longitudinal direction of the tissue specimen.
In order to extrapolate the biaxial data, the deformation gradient, F, must be incremented in each direction, and the increments of F11 and F22 are not arbitrary, rather they are dependent on the material properties and the loading conditions. To extrapolate the raw biaxial test data, given that the τ11: τ22 ratio is kept at 1:0.5, E12 = E21 = 0, and F11 is incremented, we have
| (6) |
Using Eqs. (1)–(3), and (6), and , we get
| (7) |
and by reorganizing Eq. (7), we have
| (8) |
Therefore, F22 can be solved in terms of F11 and the Fung model coefficients by solving for the roots of the cubic function in Eq. (8). Equation (8) was solved numerically using the built-in “fzero” function in Matlab (Natick, MA), and the resulting, real-number, F22 value for each F11 increment was used in subsequent calculations. Now, assuming tissue incompressibility, i.e. λ11λ22λ33 = 1, t along each principal axis was then determined from Eq. (9) for each F increment where T is the tension in the material description analogous to S.
| (9) |
2.3.3. Calculation of the unloaded (0 mmHg) aneurysm diameter, D0
The resected AsAA tissue specimens were not in intact tubular form; therefore, the unloaded diameter was unknown and had to be calculated. The circumferential Cauchy wall tension, t11sys, at the patient’s systolic blood pressure, psys, was calculated by the Laplace equation,
| (10) |
where Dsys is the diameter of the aneurysmal vessel at psys, as measured preoperatively through image analysis. From the extrapolated biaxial data, the circumferential strain, E11sys, corresponding to t11sys, was determined (see Fig. 3a). From E11sys, the aneurysm stretch in the circumferential direction, λ11sys, at psys can be determined as,
| (11) |
Fig. 3.
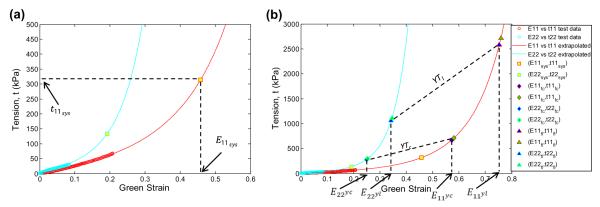
(a) Extrapolated biaxial test data with raw test data represented by open circles and the biaxial test data generated by the extrapolation method represented by the lines. The circumferential strain, E11sys , at the systolic blood pressure is determined from the extrapolated biaxial data. (b) Extrapolated data with the yield criteria (blue markers) and rupture criteria (green markers). Only the yield strains are indicated on the figure for clarity. In this case, the sample yields in the circumferential direction.
Since the Dsys at psys is known from the provided patient data, the aneurysm diameter at the unloaded (0 mmHg) state can then be determined as,
| (12) |
2.3.4. Calculation of the specimen yield and failure criteria
Once D0 is known, it is possible to generate the entire pressure vs. diameter curve. The diameter, D, at each strain increment is calculated by Eq. (13), and is used to calculate the pressure, P, at each strain increment by Eq. (14).
| (13) |
| (14) |
Aneurysm tissue yielding is assumed to occur when either the yield tension, determined by uniaxial failure tests, in the circumferential direction, YTc, or the longitudinal direction, YTl, are exceeded. The ultimate tension in each direction, UTc and UTl, are assumed to indicate rupture. From the extrapolated biaxial data, the circumferential and longitudinal strains leading to tissue yielding E11y , E22y and failure E11f , E22f were determined to satisfy the following relations: t(E11y , E22y) = YT and t(E11f , E22f = UT, respectively (see Fig. 3b). The circumferential stretches associated with yield and failure were obtained by replacing E11sys in Eq. (11) with the yield and failure strains respectively, given explicitly as
| (15) |
The failure diameter and pressure associated with these stretches were then obtained through Eqs. (16–18).
| (16) |
| (17) |
| (18) |
The lower of the two yield pressure values (circumferential and longitudinal) was considered to be the yield pressure and the lower rupture pressure value was considered to be the rupture pressure. The corresponding aneurysm diameters were considered the yield and rupture diameter respectively.
2.4. Data and statistical analysis
Risk of AsAA tissue yielding and rupture was assessed as the “diameter risk”, defined as the ratio of the aneurysm diameter at systole to the predicted aneurysm yield (Dsys/Dy) and failure diameter (Dsys/Df), as well as the “pressure risk”, defined as the ratio of the systolic blood pressure to the predicted yield (Psys/Py) and failure pressure (Psys/Pf). Note that a value of 1 indicates imminent yielding and rupture; therefore, as these ratios approach unity, a patient’s risk increases. The aortic size index (ASI) [22] was calculated for each patient as the aortic diameter normalized to the patient body surface area. The ASI has been shown to be a significant indicator of thoracic aortic aneurysm rupture potential [22]. The pressure-strain modulus, PSmod, [23–25] was also calculated as a measure of the physiological aortic compliance given by
| (19) |
where the subscript “dias” refers to the diastolic condition.
The Spearman rank non-parametric test was used to determine correlation between the following patient characteristics and the predicted yielding and rupture risk: systolic/diastolic blood pressure, age, gender, ASI, PSmod, presence of calcification, presence of a BAV, presence of a BAA, and systolic wall tension. For the binary parameter categories, patients received a value of 1 for the presence of calcification, BAV, BAA, or male gender and a 0 for an absence of these characteristics. The Mann–Whitney rank sum test was used to compare the means between two groups. A p-value ≤0.05 was assumed to signify a statistically significant difference between the means. Predicted values are presented as a mean ± standard deviation.
3. Results
3.1. Predictive analysis
The Fung-type model of Eq. (2) was able to capture the biaxial mechanical testing data for 50 patients with a high degree of accuracy. The mean τ11: F22 = 1:0.5 biaxial test responses for each patient group were fit with the Fung-type model of Eq. (2): the convex and conditioned set of coefficients per Sun and Sacks [26] for each group are given in Table 2. Note that the shear stresses and strains were included in the biaxial testing dataset for Fung-model fitting, which is why parameters A4–A6 are non-zero values; however, neglecting the shear terms for biaxial test data extrapolation in the principal directions had a negligible effect on the model fit of the 1:0.5 protocol responses. The pressure-diameter response for each patient was then extracted, and the mean curve for each patient group is shown in Fig. 4 with standard error bars. The aneurysm yielding and rupture criteria were also determined for each patient. Briefly, AsAA, AsAA-BAV, and AsAA-BAA patients were predicted to experience rupture at an aneurysm diameter of 5.5 ± 0.8 cm, 5.7 ± 0.6 cm, and 5.4 ± 0.6 cm, with 552.9 ± 234.0 mmHg, 557.3 ± 201.0 mmHg, and 649.1 ± 201.6 mmHg of pressure respectively. There were no statistical differences between the mean predicted yielding and rupture criteria among the three patient groups (Fig. 5). The complete table of results can be found in Table A.1 of the Appendix.
Table 2.
Fung coefficients for the mean 1:0.5 biaxial test response for the three patient groups.
| Patient Group | C | A 1 | A 2 | A 3 | A 4 | A 5 | A 6 | R 2 |
|---|---|---|---|---|---|---|---|---|
| AsAA | 16.207 | 18.814 | 39.89 | −17.73 | 11.67 | 0.1 | 0.15 | 0.997 |
| BAV | 42.725 | 2.802 | 2.000 | 0.993 | 11.110 | −0.885 | 2.108 | 0.995 |
| BAA | 20.512 | 10.321 | 28.870 | −10.520 | 38.586 | −9.492 | 13.220 | 0.991 |
Fig. 4.
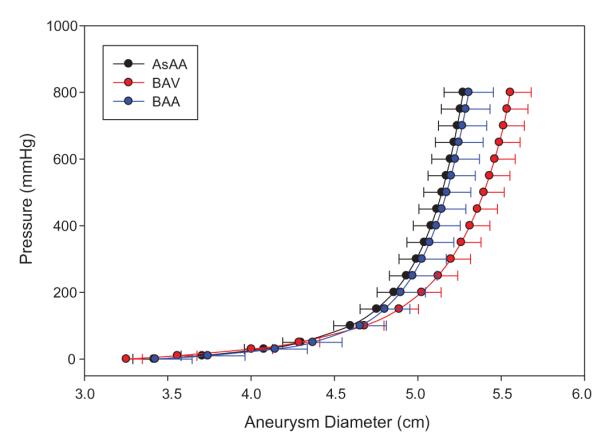
The average aneurysm pressure versus diameter response for each patient group shown with standard error bars (for clarity).
Fig. 5.
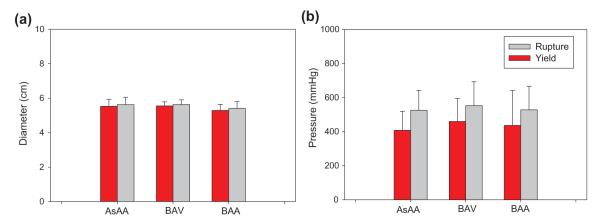
The mean predicted (a) diameter and (b) blood pressure at yield (red) and rupture (gray).
3.2. Statistical analysis
The Spearman rank order correlation test was used to determine correlation between the predicted patient tissue yielding and rupture risk with the clinically measured characteristics. Several statistically significant trends were observed (Table 3). An elevated yield diameter risk (Dsys/Dy) was significantly associated with increases in the systolic blood pressure (hypertension), age, PSmod, and systolic wall tension, while an elevated rupture diameter risk (Dsys/Df) was also significantly associated with these characteristics, and additionally with increasing ASI. This indicates that an increase in blood pressure, age, PSmod, systolic wall tension, or ASI may decrease the elastic capacity of AsAA tissue, i.e. Dsys/Df → 1. The PSmod was the most significant predictor of both the Dsys/Dy and Dsys/Df with p-values of 2.0E-7 (Fig. 6a).
Table 3.
Correlation between yield/rupture risk and patient clinical characteristics.
| Characteristic | Psys | Pdias | Dsys | Ddias | Age | Gender | ASI | PSmod | Cal | BAV | BAA | tsys |
|---|---|---|---|---|---|---|---|---|---|---|---|---|
| Dsys/Dy | ||||||||||||
| ρ | 0.460 | 0.220 | 0.092 | 0.227 | 0.300 | −0.188 | 0.243 | 0.806 | 0.116 | −0.203 | 0.033 | 0.469 |
| p-value | 0.001 | 0.125 | 0.522 | 0.113 | 0.034 | 0.190 | 0.116 | 2.00E-7 | 0.445 | 0.156 | 0.818 | 0.001 |
| Dsys/Df | ||||||||||||
| ρ | 0.493 | 0.161 | 0.119 | 0.254 | 0.353 | −0.276 | 0.305 | 0.861 | 0.086 | −0.203 | 0.033 | 0.469 |
| p-value | 3.10E-4 | 0.262 | 0.407 | 0.075 | 0.012 | 0.053 | 0.047 | 2.00E-7 | 0.574 | 0.156 | 0.818 | 0.001 |
| Psys/Py | ||||||||||||
| ρ | 0.193 | 0.255 | −0.176 | −0.154 | 0.088 | 0.033 | −0.016 | 0.152 | 0.075 | −0.098 | 0.049 | 0.035 |
| p-value | 0.178 | 0.074 | 0.221 | 0.284 | 0.543 | 0.822 | 0.920 | 0.290 | 0.621 | 0.497 | 0.735 | 0.810 |
| Psys/Pf | ||||||||||||
| ρ | 0.272 | 0.268 | −0.154 | −0.129 | 0.231 | −0.101 | −0.016 | 0.188 | 0.0958 | 0.0161 | −0.197 | 0.100 |
| p-value | 0.056 | 0.060 | 0.284 | 0.369 | 0.106 | 0.485 | 0.920 | 0.189 | 0.530 | 0.911 | 0.168 | 0.487 |
ρ = correlation coefficient, ‘Cal’ = calcification, and bold-face type indicates p-value < 0.05.
Fig. 6.
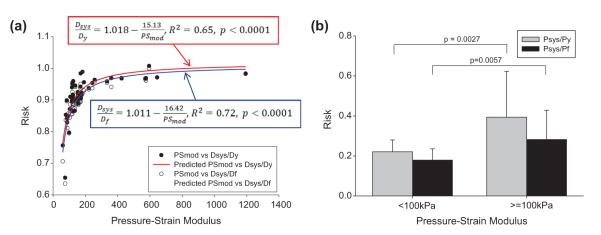
(a) Yield risk quantified as Dsys/Dy and rupture risk as Dsys/Df vs. the pressure-strain modulus, shows strong correlation. (b) Yield risk as Psys/Py (gray) and rupture risk as Psys/Pf (black) for patients with a pressure-strain modulus less than 100 kPa compared to those with a pressure-strain modulus greater than or equal to 100 kPa.
There were no observed correlations at the 5% significance level between the pressure risk factors (Psys/Py and Psys/Pf) and the clinically measured parameters. Due to the strong correlation between the diameter risk and the PSmod, the pressure risk factors were compared between the patients with high tissue compliance (PSmod < 100 kPa) to those with low tissue compliance (PSmod ≥ 100 kPa) (Fig. 6b). Note that a PSmod value of 100 kPa represents a normal ascending aorta value for male patients between the ages of 30 and 79 years [27]. Patients with high compliance (PSmod < 100 kPa) had a mean Psys/Py of 0.22 ± 0.06, which was significantly lower (p = 0.0027) than those with low compliance (PSmod ≥ 100 kPa) which had a mean Psys/Py of 0.39 ± 0.23. The rupture pressure risk, Psys/Pf, was also lower among the PSmod < 100 kPa patients with a mean of 0.18 ± 0.06, than the PSmod ≥ 100 kPa patients with a mean of 0.28 ± 0.15, with a p-value of 0.0057.
4. Discussion
4.1. Rupture characteristics of AsAA
The mean aneurysm diameter at yield was determined to be 5.4 ± 0.8 cm for AsAA patients, and 5.3 ± 0.6 cm for AsAA-BAA patients, which agree well with the clinically observed value of 5.31 cm at dissection [3]. The mean yield diameter predicted for AsAA-BAV patients (5.6 ± 0.5 cm) represents a slightly higher value than for AsAA and AsAA-BAA patients, yet slightly lower than the mean diameter of 6.0 ± 1.5 cm at dissection reported by Svensson et al. [28] in their study of 40 BAV patients. However, that value may be somewhat overestimated due to rapid aortic expansion once dissection is initiated [28]. The mean predicted aneurysm diameter at rupture was 5.5 ± 0.8 cm for AsAA patients, 5.7 ± 0.6 cm for AsAA-BAV patients, and 5.4 ± 0.6 cm for AsAA-BAA patients, which are consistent with the clinical finding that a patient’s risk of AsAA rupture greatly increases when the aneurysm has reached 6 cm in diameter [3], and reinforce the conclusion that such aneurysms should be electively repaired by 5.5 cm [3].
The predicted yield and rupture pressures for most of the patients are much higher than the physiological pressure range. The mean predicted yield/rupture pressure was 448.2 ± 226.3 mmHg/552.9 ± 234.0 mmHg for AsAA patients, 448.9 ± 171.0 mmHg/557.3 ± 201.0 mmHg for AsAA-BAV patients, and 439.2 ± 196.7 mmHg/649.1 ± 201.6 mmHg for AsAA-BAA patients, respectively. However, these values are reasonable considering it is estimated that an intravascular pressure of approximately 2500 mmHg is required to rupture the healthy human aorta [29,30]. Although clinically blood pressures are not seen above 300 mmHg, extreme blood pressures can be observed in emotionally or physically stressful situations. In fact, dissections commonly occur during the winter months and in the early morning hours when blood pressures are known to be highest [3]. In a retrospective study of patients treated for acute aortic dissection at Yale University, 66% of patients recalled severe emotional stress or physical exertion at the time of their dissection [31]. For example, in a follow-up study the authors [32] reported 31 cases of aortic dissection of young men with no evidence of aortic aneurysm during weightlifting, where blood pressures exceeding 300 mmHg have been observed [31,32]. It is also important to note that the predicted AsAA rupture pressures presented here are the pressure needed to rupture the tissue with its current material properties (i.e., at the time of elective surgery). As disease progresses the strength of the tissue may decline, and with it, the pressure to induce rupture.
For one patient, patient #AsAA6, the predicted yield pressure risk (Psys/Py) was 1.37 and rupture pressure risk (Psys/Pf) was 0.98 (see Table A.1 in the Appendix). Thus, according to our predictions, this patient should have experienced yielding already and possibly rupture at even slightly elevated blood pressures, yet none of the patients included in the study were known to have dissected/ruptured at the time of surgery. Examination of the resected AsAA6 ascending aortic aneurysm specimen at the tissue and microstructure levels revealed advanced aortic disease compared to the other samples (see Fig. 7a–c). There was evident disruption between the medial and adventitial layers of the wall, which indicates the onset of dissection (Fig. 7a). On the micro scale, the three layers of the aortic wall were severely damaged with evidence of intimal thickening, disruption and disorganization of the elastin network, and loss of smooth muscle cells with an accumulation of extracellular matrix ground substance and collagen in the media (Fig. 7c)[14,33]. Therefore, although this patient was not diagnosed with dissection, it appears that the tissue specimen tested was severely degenerated, which may explain our overly high predicted risk factor.
Fig. 7.

(a) AsAA6 biaxial test specimen with the (b) intimal surface and (c) adventitial surface on top, and representative histological slice through the aortic wall with Verhoeff-VanGieson stain rendering elastin purple-black and collagen pink-purple.
4.2. Bicuspid aortic valve effect
Although there were no significant differences in the predicted failure characteristics among the patient groups, the predicted yield and rupture diameters for AsAA-BAV patients were slightly larger than for the AsAA and AsAA-BAA patients. These results suggest that AsAAs dissect at smaller diameters in patients without BAV, which is in agreement with the International Registry of Acute Aortic Dissections report that the proportion of dissections occurring at smaller sizes (<5.5 cm) was actually higher among patients without BAV or Marfan syndrome [34,35].
AsAA-BAV patients also had slightly lower mean Psys/Py and Psys/Pf ratios than AsAA patients. Again, these differences were not significant. The clinical finding that BAV patients are more likely to experience rupture and dissection than patients with a tricuspid aortic valve [34], may be explained by the higher prevalence rate and younger onset age of aortic dilation in BAV patients [34,36–39]. However, the difference between patient groups may also be explained in part by the younger age of AsAA-BAV patients (53.9 ± 9.7 years) compared to the AsAA patients (64.1 ± 8.3 years) analyzed in this study. It is well documented that the mechanical properties of the human aorta undergo significant changes with age, including dramatic stiffening beyond the age of 60 years [40,41]; therefore, the differences in age between the AsAA and AsAA-BAV patients groups in this study may explain the higher predicted pressures for adverse events in the AsAA-BAV patient group.
4.3. Bovine aortic arch effect
The mean pressure versus diameter curves for both AsAA-BAA and AsAA patients were nearly identical (see Fig. 4). The predicted failure characteristics for AsAA-BAA patients were also similar to those for the AsAA patients. AsAA-BAA patients had a slightly lower mean predicted rupture risk than AsAA patients, but were also younger on average (55.0 ± 14.8 years) than the AsAA patients. From this analysis, the presence of BAA does not appear to affect a patient’s risk of ascending aortic rupture. A more thorough study comparing ascending aorta tissue properties in BAA and non-BAA patients with and without AsAA may be necessary for determining any association between BAA and AsAA.
4.4. Clinical indications of rupture potential
No correlation was determined between the aneurysm size and any of the yield and rupture risk ratios; yet, this is what is currently used clinically. Our results suggest that patients with stiff aortic aneurysm tissue are at higher risk for dissection and rupture, than those with more compliant tissue; therefore, the PSmod may be a more appropriate metric for the clinical in vivo and non-invasive evaluation of AsAA rupture risk. The patient risk quantified as the diameter risk (Dsys/Dy and Dsys/Df) and pressure risk (Psys/Py and Psys/Pf) increases dramatically when the PSmod exceeds 100 kPa. The mean Psys/Py and Psys/Pf ratios for patients with low tissue compliance (PSmod ≥ 100 kPa) were 1.8 and 1.6 times larger than the corresponding ratios for patients with high tissue compliance (PSmod < 100 kPa).
The statistical analysis also implicated elevated blood pressure, in addition to increased pressure-strain modulus, as a risk factor for AsAA rupture. Hypertension has long been known to be a risk factor for cardiovascular disease, and aortic stiffness has more recently been implicated as an indicator of aortic disease [4,42]. These findings are in tune with what we know about vessel mechanics. Blood vessels will burst when the stress acting on the wall exceeds the strength of the wall. For an AsAA, the blood pressure induces stress on the vessel wall, while the pressure-strain modulus depends on the wall tissue properties, geometry, and loading conditions.
4.5. Limitations
This prediction approach is limited in part by the experimental data which was collected at a relatively low load range, thus, requiring the extrapolation technique to predict the high-load response. We assume that the analytical model can predict the tissue response up until the rupture point. Ideally, we could collect the experimental data to higher loads. It is possible that freezing the tissue specimens before testing may have affected the tissue mechanical properties. This analysis also did not account for the time-dependent material property changes of AsAAs. Therefore, the timing of adverse events cannot be predicted. Moreover, the tensile strength of the aorta under in vivo conditions was assumed to be equivalent to the uniaxial tensile strength in each principal direction, while a Von-Mises type yield criterion may allow for a more accurate estimate of the tissue limits independent of the loading condition.
The AsAAs were assumed to be thin-walled tubes with a circular cross-section in this study. The tissue property around the circumference of the resected aneurysm was assumed to be homogeneous; however, some studies [20,21,43–45] suggest that the properties of the ascending aorta differ between the anterior and posterior regions. Although, a study by Azadani et al. [46] show that the properties of healthy human ascending aorta do not differ significantly around the aorta.
Because the in vivo tissue thickness was unknown, the vessel wall tension rather than the stress was used. We also did not include the vessel residual stress for this reason. By neglecting the in vivo wall thickness in the stress analyses we may be overestimating the true stress state of the vessel. The layer-specific material properties of the aortic wall were also not considered. Sokolis et al. [47] report differences in the uniaxial stress–strain and failure responses for the three layers of the AsAA wall. In the future it may be necessary to test the biaxial mechanical properties of each layer of the aortic wall and model the entire wall as a tri-layer composite, to enhance the accuracy of our risk assessment method.
5. Conclusions
In this study, the rupture potential of AsAAs was assessed in 50 patients, including patients with concomitant BAV and BAA. The aneurysmal tissue was resected from these patients prior to dissection or rupture, and through this biomechanical analysis, we predicted the “future” yield and rupture criteria for each patient. Our main findings are as follows:
No association could be made between the aneurysm diameter and rupture potential.
Aortic tissue stiffening and hypertension may increase a patient’s risk of rupture.
BAV and BAA patients with AsAAs may have a similar risk of rupture as patients without either of these conditions.
The close symmetry between our results and those observed clinically supports the potential use of the analytical techniques developed in this study for future pre-operative evaluation of AsAA. Our results indicate that the pressure-strain modulus may be a more reliable indicator of rupture potential than the previously used maximum aneurysm diameter criteria, and can also be easily obtained clinically, making it an attractive rupture potential metric.
Supplementary Material
Acknowledgements
This work was supported in part by the NIH HL108239 and HL104080 grants. Caitlin Martin and Thuy Pham are supported by NIH NRSA pre-doctoral fellowships. The authors would like to thank Laura Ondere, Mohammad Zafar, and Adam Sang for providing data support and Stephany Santos, Christine Vogel, Linda Caporale, and Kaitlyn Clarke for technical support.
Footnotes
6. Disclosures None.
Appendix A. Supplementary data Supplementary data associated with this article can be found, in the online version, at http://dx.doi.org/10.1016/j.actbio.2013.07.044.
References
- [1].CDC National Center for Injury Prevention and Control, WISQARS Leading Causes of Death Reports, 1999–2007. 2007 [Google Scholar]
- [2].Wang Y, Barbacioru CC, Shiffman D, Balasubramanian S, Iakoubova O, Tranquilli M, et al. Gene expression signature in peripheral blood detects thoracic aortic aneurysm. PLoS ONE. 2007;2(10) doi: 10.1371/journal.pone.0001050. [DOI] [PMC free article] [PubMed] [Google Scholar]
- [3].Elefteriades JA, Farkas EA. Thoracic Aortic Aneurysm: Clinically Pertinent Controversies and Uncertainties. J Am Coll Cardiol. 2010;55(9):841–57. doi: 10.1016/j.jacc.2009.08.084. [DOI] [PubMed] [Google Scholar]
- [4].Koullias G, Modak R, Tranquilli M, Korkolis DP, Barash P, Elefteriades JA. Mechanical deterioration underlies malignant behavior of aneurysmal human ascending aorta. The Journal of Thoracic and Cardiovascular Surgery. 2005;130(3):677.e671–677.e679. doi: 10.1016/j.jtcvs.2005.02.052. [DOI] [PubMed] [Google Scholar]
- [5].Bonow R, Carabello B, de Leon A, Edmunds LJ, Fedderly B, Freed M, et al. ACC/AHA Guidelines for the Management of Patients with Valvular Heart Disease Executive Summary. A report of the American College of Cardiology/American Heart Association Task Force on Practice Guidelines (Committee on Management of Patients With Valvular Heart Disease) J Heart Valve Dis. 1998;7(6):672–707. [PubMed] [Google Scholar]
- [6].Fillinger MF, Racusin J, Baker RK, Cronenwett JL, Teutelink A, Schermerhorn ML, et al. Anatomic characteristics of ruptured abdominal aortic aneurysm on conventional CT scans: implications for rupture risk. J Vas Surg. 2004;39(6):1243–52. doi: 10.1016/j.jvs.2004.02.025. [DOI] [PubMed] [Google Scholar]
- [7].Fillinger MF, Marra SP, Raghavan ML, Kennedy FE. Prediction of rupture risk in abdominal aortic aneurysm during observation: Wall stress versus diameter. J Vas Surg: Offic Public, Soc Vas Surg Int Soc Cardiovas Surg North Am Chapter. 2003;37(4):724–32. doi: 10.1067/mva.2003.213. [DOI] [PubMed] [Google Scholar]
- [8].Venkatasubramaniam AK, Fagan MJ, Mehta T, Mylankal KJ, Ray B, Kuhan G, et al. A comparative study of aortic wall stress using finite element analysis for ruptured and non-ruptured abdominal aortic aneurysms. Eur J Vas Endovas Surg. 2004;28(2):168–76. doi: 10.1016/j.ejvs.2004.03.029. [DOI] [PubMed] [Google Scholar]
- [9].Okamoto RJ, Wagenseil JE, DeLong WR, Peterson SJ, Kouchoukos NT, Sundt TM., Iii Mechanical properties of dilated human ascending aorta. Ann Biomed Eng. 2002;30(5):624–35. doi: 10.1114/1.1484220. [DOI] [PubMed] [Google Scholar]
- [10].Guinea GV, Atienza JM, Rojo FJ, Garcia-Herrera CM, Yiqun L, Claes E, et al. Factors influencing the mechanical behaviour of healthy human descending thoracic aorta. Physiolog Measure. 2010;31(12):1553–65. doi: 10.1088/0967-3334/31/12/001. [DOI] [PubMed] [Google Scholar]
- [11].Vorp DA, Schiro BJ, Ehrlich MP, Juvonen TS, Ergin MA, Griffith BP. Effect of aneurysm on the tensile strength and biomechanical behavior of the ascending thoracic aorta. Ann Thoracic Surg. 2003;75(4):1210–4. doi: 10.1016/s0003-4975(02)04711-2. [DOI] [PubMed] [Google Scholar]
- [12].García-Herrera CM, Atienza JM, Rojo FJ, Claes E, Guinea GV, Celentano DJ, García-Montero C, Burgos RL. Mechanical behaviour and rupture of normal and pathological human ascending aortic wall. Med Biol Eng Comput. 2012:1–8. doi: 10.1007/s11517-012-0876-x. [DOI] [PubMed] [Google Scholar]
- [13].Sokolis DP, Lampropoulos KM, Iliopoulos DC. Gender variations in the mechanical properties of ascending aortic aneurysms. Proc 7th IASTED Int Conf Biomed Eng Biomed; 2010.2010. pp. 340–4. [Google Scholar]
- [14].Fedak PWM, Verma S, David TE, Leask RL, Weisel RD, Butany J. Clinical and pathophysiological implications of a bicuspid aortic valve. Circulation. 2002;106(8):900–4. doi: 10.1161/01.cir.0000027905.26586.e8. [DOI] [PubMed] [Google Scholar]
- [15].Hornick M, Mommiaie R, Mojibian H, Tranquilli M, Elefteriades JA. Bovine arch – a marker for thoracic aortic aneurysm. 15th World Congress on Heart DiseaseVancouver; Canada; BC; 2012. [Google Scholar]
- [16].Pham TM, Martin C, Elefteriades JA, Sun W. Biomechanical characterization of ascending aortic aneurysm with concomittant bicuspid aortic valve and bovine aortic arch. Acta Biomater. 2013;9:7927–36. doi: 10.1016/j.actbio.2013.04.021. 2013. [DOI] [PMC free article] [PubMed] [Google Scholar]
- [17].Bia D, Pessana F, Armentano R, Perez H, Graf S, Zocalo Y, et al. Cryopreservation procedure does not modify human carotid homografts mechanical properties: an isobaric and dynamic analysis. Cell Tissue Banking. 2006;7:183–94. doi: 10.1007/s10561-005-0655-0. [DOI] [PubMed] [Google Scholar]
- [18].Sacks MS, Sun W. Multiaxial mechanical behavior of biological materials. Ann Rev Biomed Eng. 2003;5:251–84. doi: 10.1146/annurev.bioeng.5.011303.120714. [DOI] [PubMed] [Google Scholar]
- [19].Fung YC. Biomechanics: Mechanical Properties of Living Tissues. Springer Verlag; New York: 1993. [Google Scholar]
- [20].Duprey A, Khanafer K, Schlicht M, Avril S, Williams D, Berguer R. In vitro characterisation of physiological and maximum elastic modulus of ascending thoracic aortic aneurysms using uniaxial tensile testing. Eur J Vas Endovas Surg. 2010;39(6):700–7. doi: 10.1016/j.ejvs.2010.02.015. [DOI] [PubMed] [Google Scholar]
- [21].Khanafer K, Duprey A, Zainal M, Schlicht M, Williams D, Berguer R. Determination of the elastic modulus of ascending thoracic aortic aneurysm at different ranges of pressure using uniaxial tensile testing. J Thoracic Cardiovas Surg. 2011;142(3):682–6. doi: 10.1016/j.jtcvs.2010.09.068. [DOI] [PubMed] [Google Scholar]
- [22].Davies RR, Gallo A, Coady MA, Tellides G, Botta DM, Burke B, et al. Novel measurement of relative aortic size predicts rupture of thoracic aortic aneurysms. Ann Thorac Surg. 2006;81(1):169–77. doi: 10.1016/j.athoracsur.2005.06.026. [DOI] [PubMed] [Google Scholar]
- [23].Hunter KS, Albietz JA, Lee P-F, Lanning CJ, Lammers SR, Hofmeister SH, Kao PH, Qi HJ, Stenmark KR, Shandas R. In vivo measurement of proximal pulmonary artery elastic modulus in the neonatal calf model of pulmonary hypertension: development and ex vivo validation. Journal of Applied Physiology. 2010;108(4):968–75. doi: 10.1152/japplphysiol.01173.2009. [DOI] [PMC free article] [PubMed] [Google Scholar]
- [24].Lanne T, Sonesson B, Bergqvist D, Bengtsson H, Gustafsson D. Diameter and compliance in the male human abdominal aorta: Influence of age and aortic aneurysm. Eur J Vas Surg. 1992;6(2):178–84. doi: 10.1016/s0950-821x(05)80237-3. [DOI] [PubMed] [Google Scholar]
- [25].Peterson LH, Jensen RE, Parnell J. Mechanical properties of arteries in vivo. Circ Res. 1960;8(3):622–39. [Google Scholar]
- [26].Sun W, Sacks MS. Finite element implementation of a generalized Fung-elastic constitutive model for planar soft tissues. Biomech Model Mechanobiol. 2005;4(2–3):190–9. doi: 10.1007/s10237-005-0075-x. [DOI] [PubMed] [Google Scholar]
- [27].Martin C, Sun W, Primiano C, McKay R, Elefteriades J. Age-dependent ascending aorta mechanics assessed through multi-phase CT. 2012 doi: 10.1007/s10439-013-0856-9. (unpublished results) [DOI] [PMC free article] [PubMed] [Google Scholar]
- [28].Svensson LG, Kim K-H, Lytle BW, Cosgrove DM. Relationship of aortic cross-sectional area to height ratio and the risk of aortic dissection in patients with bicuspid aortic valves. J Thorac Cardiovasc Surg. 2003;126(3):892–3. doi: 10.1016/s0022-5223(03)00608-1. [DOI] [PubMed] [Google Scholar]
- [29].Kirklin J, Barrat-Boyes B, editors. 1993.
- [30].Richens D, Field M, Neale M, Oakley C. The mechanism of injury in blunt traumatic rupture of the aorta. Eur J Cardio-Thoracic Surg. 2002;21(2):288–93. doi: 10.1016/s1010-7940(01)01095-8. [DOI] [PubMed] [Google Scholar]
- [31].Hatzaras I, Tranquilli M, Coady M, Barrett PM, Bible J, Elefteriades JA. Weight lifting and aortic dissection: more evidence for a connection. Cardiology. 2007;107(2):103–6. doi: 10.1159/000094530. [DOI] [PubMed] [Google Scholar]
- [32].Elefteriades JA. Beating a sudden killer. Scientific American. 2005;(293):64–71. doi: 10.1038/scientificamerican0805-64. [DOI] [PubMed] [Google Scholar]
- [33].De Sa M, Moshkovitz Y, Butany J, David TE, Robicsek F, Gardner TJ, et al. Histologic abnormalities of the ascending aorta and pulmonary trunk in patients with bicuspid aortic valve disease: Clinical relevance to the Ross procedure. J Thoracic Cardiovas Surg. 1999;118(4):588–96. doi: 10.1016/S0022-5223(99)70002-4. [DOI] [PubMed] [Google Scholar]
- [34].Tadros TM, Klein MD, Shapira OM. Ascending aortic dilatation associated with bicuspid aortic valve. Circulation. 2009;119(6):880–90. doi: 10.1161/CIRCULATIONAHA.108.795401. [DOI] [PubMed] [Google Scholar]
- [35].Pape LA, Tsai TT, Isselbacher EM, Oh JK, Gara PT, Evangelista A, Fattori R, Meinhardt G, Trimarchi S, Bossone E, Suzuki T, Cooper JV, Froehlich JB, Nienaber C, Eagle KA. On behalf of the international registry of acute aortic dissection, I. Aortic diameter â%‰¥5.5 cm is not a good predictor of type a aortic dissection. Circulation. 2007;116(10):1120–7. doi: 10.1161/CIRCULATIONAHA.107.702720. [DOI] [PubMed] [Google Scholar]
- [36].La Canna G, Ficarra E, Tsagalau E, Nardi M, Morandini A, Chieffo A, et al. Progression Rate of Ascending Aortic Dilation in Patients With Normally Functioning Bicuspid and Tricuspid Aortic Valves. Am J Cardiol. 2006;98(2):249–53. doi: 10.1016/j.amjcard.2006.01.096. [DOI] [PubMed] [Google Scholar]
- [37].Davies RR, Kaple RK, Mandapati D, Gallo A, Botta DM, Jr, Elefteriades JA, et al. Natural history of ascending aortic aneurysms in the setting of an unreplaced bicuspid aortic valve. Ann Thoracic Surg. 2007;83(4):1338–44. doi: 10.1016/j.athoracsur.2006.10.074. [DOI] [PubMed] [Google Scholar]
- [38].Edwards WD, Leaf DS, Edwards JE. Dissecting aortic aneurysm associated with congenital bicuspid aortic valve. Circulation. 1978;57(5):1022–5. doi: 10.1161/01.cir.57.5.1022. [DOI] [PubMed] [Google Scholar]
- [39].Gore I. Dissecting aneurysms of the aorta in persons under forty years of age. AMA Arch Pathol. 1953;55:1–13. [PubMed] [Google Scholar]
- [40].Haskett D, Johnson G, Zhou A, Utzinger U, Vande Geest J. Microstructural and biomechanical alterations of the human aorta as a function of age and location. Biomech Model Mechanobiol. 2010;9(6):725–36. doi: 10.1007/s10237-010-0209-7. [DOI] [PubMed] [Google Scholar]
- [41].Geest JPV, Sacks MS, Vorp DA. Age Dependency of the Biaxial Biomechanical Behavior of Human Abdominal Aorta. J Biomech Eng. 2004;126(6):815–22. doi: 10.1115/1.1824121. [DOI] [PubMed] [Google Scholar]
- [42].O’Rourke M. Arterial stiffness, systolic blood pressure, and logical treatment of arterial hypertension. Hypertension. 1990;15(4):339–47. doi: 10.1161/01.hyp.15.4.339. [DOI] [PubMed] [Google Scholar]
- [43].Sokolis DP, Kritharis EP, Giagini AT, Lampropoulos KM, Papadodima SA, Iliopoulos DC. Biomechanical response of ascending thoracic aortic aneurysms: association with structural remodelling. Comput Meth Biomech Biomed Eng. 2012;15(3):231–48. doi: 10.1080/10255842.2010.522186. [DOI] [PubMed] [Google Scholar]
- [44].Choudhury N, Bouchot O, Rouleau L, Tremblay D, Cartier R, Butany J, et al. Local mechanical and structural properties of healthy and diseased human ascending aorta tissue. Cardiovas Pathol. 2009;18(2):83–91. doi: 10.1016/j.carpath.2008.01.001. [DOI] [PubMed] [Google Scholar]
- [45].Iliopoulos DC, Kritharis EP, Giagini AT, Papadodima SA, Sokolis DP. Ascending thoracic aortic aneurysms are associated with compositional remodeling and vessel stiffening but not weakening in age-matched subjects. J Thoracic Cardiovas Surg. 2009;137(1):101–9. doi: 10.1016/j.jtcvs.2008.07.023. [DOI] [PubMed] [Google Scholar]
- [46].Gundiah N, Matthews PB, Karimi R, Azadani A, Guccione J, Guy TS, et al. Significant material property differences between the porcine ascending aorta and aortic sinuses. J Heart Valve Dis. 2008;17(6):606–13. [PubMed] [Google Scholar]
- [47].Sokolis D, Kritharis E, Iliopoulos D. Effect of layer heterogeneity on the biomechanical properties of ascending thoracic aortic aneurysms. Med Biol Eng Comput. 2012:1–11. doi: 10.1007/s11517-012-0949-x. [DOI] [PubMed] [Google Scholar]
Associated Data
This section collects any data citations, data availability statements, or supplementary materials included in this article.